

 PDF
PDF ePub
ePub Citation
 Print
Print


Introduction
Vitamin K is involved in blood coagulation [1] and is known to facilitate bone formation by promoting osteoblast formation [2,3]. In addition, recent studies have reported that vitamin K has preventive effects against type II diabetes, obesity, and cardiovascular diseases [4-7]. Vitamin K, a fat-soluble vitamin predominantly found in nature, is classified as vitamin K1 (phylloquinone) that is present in green vegetables and vitamin K2 (menaquinone) that is present in meat, fish, and fermented foods [8-10]. Many researchers have investigated the content of vitamin K1 in food; however, further studies analyzing foods containing vitamin K2 produced by bacteria are needed [10].
The United States Institute of Medicine announced that the adequate intake levels for vitamin K are 120 ug for men and 90 ug for women [11], while in the United Kingdom (UK), 1 ug of vitamin K per 1 kg of body weight is recommended [12]. In Japan, the adequate intake level of vitamin K has been set at 75 ug for males and 60 ug for females aged 18-29 years, and 65 ug for females aged ≥ 30 years [13]. Currently, Korean dietary reference intake for vitamin K is 75 ug and 65 ug for male and female adults, respectively as adequate intake (AI) [14]. There is a lack of evidence for setting vitamin K reference intake in Koreans due to insufficient large-scale investigations on vitamin K intake and nutritional status assessment.
According to previous studies on vitamin K intake by country and age group, young Japanese women, aged 18-29 years, consume 230 ug/day of vitamin K [13]. Yan et al. [15] found that the elderly in China had a higher vitamin K intake (247 ug/day) than those in the UK (103 ug/day). Estimates of vitamin K intake in each country have been determined. However, due to the lack of reliable vitamin K content data on foods, studies on vitamin K intake in Koreans and vitamin K food sources are limited.
Therefore, the objective of this study was to evaluate vitamin K intake in Koreans and search for major food sources that provide vitamin K in the diet using newly-available food content data.
Subjects and Methods
Subjects
This study included 7,792 subjects (3,979 subjects in 2010 and 3,813 subjects in 2011) 2,972 men and 4,820 women, who participated in the nutrition examination survey as part of the fifth Korean National Health and Nutrition Examination Survey (KNHANES) in the primary and secondary years (2010-2011). Subjects with a daily caloric intake below 500 kcal or over 4,000 kcal were excluded from this study.
Dietary assessment and vitamin K intake
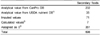
Dietary assessments and vitamin K intake were determined using the raw data collected from the KNHANES via the method of 24-hour recall. When the raw materials of the foods were identical to each other, they were classified as the same food, and called "secondary foods", if the moisture content differed by ± 15%. For instance, Japonica type and Tongil type of rice hardly had any differences in their moisture content, and they were classified as the same food. The subjects in this study consumed 696 secondary foods in 2010-2011 KNHANES, and a total of 500 food items (71.8% of consumed foods)were evaluated for vitamin K, including 459 items from the food database, Computer Aided Nutritional analysis Program (Can-Pro) Version 4.0, and 41 items from the United States Department of Agriculture (USDA) of National Nutrient Database for Standard Reference, Release 26.
Analysis was done based on second food names and was used to estimate vitamin K intake. With regard to food items, 149 items with no Vitamin K were included.
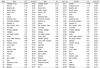
In the case of the Kimchi group, the value of Baechukimchi was imputed to food items without analytical value. An average of 3 analytic values from the Mushroom group was imputed to the missing values of 12 items in the food group. An average of 24 analytic values from the fish group was imputed to the missing values in the food group. An average of 4 analytic values from the clam group was imputed to the missing values of 13 items in the food group. For dried foods, vitamin K content was calculated by searching the database and multiplying by the 7 items which were analyzed as values that correspond to the missing vitamin K content of 7.06, which is the conversion factor suggested in the analytical guidelines from KNHANES. For other foods, vitamin K values of all 30 food items were calculated by granting the same vitamin K content to 'baekseolgi' based on 'milled rice' and the food such as 'oisobagi' and 'pickled cucumber' based on 'cucumber' (Table 1).
"Secondary foods" were classified into one of the following 18 food categories: "cereals and their products", "potatoes and starches", "sugars and their products", "beans and its products", "seeds and nuts and their products", "vegetables", "mushrooms", "fruits", "meat and its products", "eggs", "seafood", "seaweeds", "oils and its products", "fat", "drinks and alcoholic beverages", "seasonings", "processed foods", and "others".
Selection of vitamin K food sources
In total, 217 vitamin K-containing food items were excluded from the study as their intake frequency was less than 10 of vitamin K consumed by adults aged 19-64 years. To determine foods items that made the highest contribution to vitamin K intake, the nutrient contribution of each food item was analyzed, followed by selection of the top 30 vitamin K-containing food items and calculation of cumulative percent contribution (Cum%). If the sum of the Cum% was higher than 90%, it was identified as a major food source.
Statistical analysis
Statistical analyses were performed using SPSS (version 19.0). The raw data from health interview examinations and nutrition examinations were used as representative data of the entire Korean population. A complex sampling design was employed to analyze the KNHANES data, and weight, strata, and cluster (primary sampling unit) were considered so that an unbiased estimation could be obtained. The subjects were categorized by age and gender. The Rao-Scott Chi-square tests were performed to determined the differences in socio-economic status between men and women. Potential confounders such as residence, economic status, education level, smoking status, alcohol status, and energy intake, were identified by examining the differences in the means of vitamin K intake between age groups. Only energy intake showed significantly different means and was adjusted in the analyses. Vitamin K intake by age was analyzed by controlling energy intake through ANCOVA of the complex samples design and was indicated by the Mean ± SE (standard error). Significance level was set at α = 0.05.
Results
General characteristics
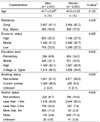
The baseline characteristics of the subjects are summarized in Table 2. There was no significant difference in residence and economic status between men and women. The percentage of smoking status was significantly higher in men than in women (P < 0.001). The percentage of alcohol drinking status was significantly higher in men than in women (P < 0.001).
Dietary assessment and Nutrient intake
The total calorie intake was 2,372.02 ± 16.99 kcal/day for men and 1,753.40 ± 11.96 kcal/day for women. In addition, vitamin K intake was 322.40 ± 6.33 ug/day for men and 271.20 ± 4.92 ug/day for women.
Based on age group, vitamin K intake values were 255.71 ± 10.99 ug/day, 308.85 ± 8.95 ug/day, 351.11 ± 14.09 ug/day, and 366.02 ± 14.91 ug/day for men (P for trend < 0.001) aged 19-29, 30-39, 40-49, and 50-59 years, respectively, and 200.60 ± 11.57 ug/day, 257.65 ± 7.58 ug/day, 292.83 ± 8.92 ug/day, and 308.25 ± 11.80 ug/day for women (P for trend < 0.001) aged 19-29, 30-39, 40-49 and 50-59, respectively. This indicates that vitamin K intake increases with age in both men and women (Table 3).
Contribution of the food sources to vitamin K intake
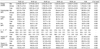
The contribution of each food item to vitamin K intake is shown in Table 4. The highest contribution of vitamin K was from vegetables (72.84%), followed by seaweeds (12.35%), seasonings (5.53%), fat (3.47%), fruits (2.64%), beans and its products (1.20%), and cereals and their products (0.69%).
Major food sources of vitamin K
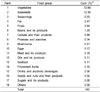
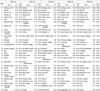
We investigated major food sources rich in vitamin K using the KNHANES data by the 24-hour recall method (Table 5). Overall, cabbage kimchi made the highest contribution to vitamin K intake (19.26%), followed by spinach (17.38%), sesame leaves (7.11%), radish leaves (6.65%), spring onions (6.28%), and laver (4.82%). In men, cabbage kimchi (22.11%) made the highest contribution, followed by spinach (17.70%), spring onions (6.96%), radish leaves (6.52%), and sesame leaves (5.86%); in women, spinach (17.48%) made the highest contribution, followed by cabbage kimchi (17.18%) sesame leaves (7.77%), radish leaves (6.60%), and spring onions (5.61%).
Major food sources of vitamin K by age group
Spinach made the highest contribution to vitamin K intake (20.16%) in those aged 30-39 years. Overall, for all age groups, the best 4 food sources of vitamin K were all from green vegetables. However, cabbage kimchi (19.50%), spinach (17.09%), spring onions (8.26%), and soybean oils (6.26%) were identified as the top vitamin K food sources in those aged 19-29 years, suggesting that the contribution of soybean oils to vitamin K intake in the youngest age group was relatively higher than that in the older age groups. Furthermore, ramyun (instant noodle) was ranked 25th among the foods contributing to vitamin K intake (0.41%) in those aged 19-29 years, which indicates that the dietary habits of this age group differ from those of the 30-64 age group (Table 6).
Discussion
The study examined foods which attribute to dietary vitamin K intake and differences among gender and age groups. The KNHANES is a nationwide health and nutrition examination providing representative and reliable data on the level of health, health-related awareness and behaviors, and food and nutrition intake at the country, city, and province levels. In this study, we investigated vitamin K intake and its main food sources for Koreans using the raw data from the KNHANES. Additionally, the results of this study will be further applied to determine dietary reference intakes for Koreans in the future.
Green vegetables have been reported as the main food sources of vitamin K1 (phylloquinone), and oils are also known to contain abundant levels of phylloquinone [16,17]. The analysis of vitamin K content showed that collards, spinach, broccoli, and cabbage contain 440 ug, 380 ug, 180 ug, and 145 ug of vitamin K per 100 g of food item, respectively. Vegetable oils are also considered the main food sources of vitamin K. It was reported that 193 ug, 127 ug, and 102 ug of vitamin K per 100 g of food item are present in soybean oils, canola oils, and margarine with hydrogenated oils, respectively [10]. Vegetables made the highest contribution to vitamin K intake (72.84%), including cabbage kimchi (19.26%), spinach (17.38%), sesame leaves (7.11%), and radish leaves (6.65%). This is because the Korean diet includes green vegetables as side dishes. The results of this study are in agreement with those of another study from Japan which found that vegetables (72.9%) have the highest contribution to vitamin K1 intake among young women [13].
However, when the food sources of both phylloquinone and menaquinone were investigated, vegetables contributed 49.5% of the total vitamin K intake. Beans and its products (including fermented foods) accounted for 28.8% of vitamin K2 intake [13]. Vitamin K2 analysis is yet to be carried out in Korea, and this implies that vitamin K intake for Koreans who frequently consume fermented foods, similar to those found in Japanese diets, may be underestimated. Therefore, the vitamin K2 content of soybean paste and red pepper paste, which are traditional Korean fermented foods, should also be analyzed, and these results would enhance the accurate estimation of vitamin K intake in the Korean population.
In this study, the vitamin K intake of Koreans was 322.40 ± 6.33 ug/day in men and 271.20 ± 4.92 ug/day in women. Similar results were found in a Japanese study that showed a vitamin K intake of 230.2 ± 143.3 ug/day in women aged 19-29 years [13]. Yan et al. [15] also investigated vitamin K intake of the elderly in China and the UK. The results showed that the vitamin K intake of the Chinese elderly was similar to that observed in our study (247 ug/day), whereas elderly individuals in the UK had a lower vitamin K intake than those in our study (103 ug/day). The study further analyzed the UK's National Diet and Nutrition Survey and found that the vitamin K contribution from vegetables decreased from 63% in the 1980s to 60% in the 2000s [18]. In addition, the vitamin K intake of male and female Irish adults (aged 18-64 years) was found to be 84.2 ± 48.7 ug/day and 75.2 ± 39.1 ug/day, respectively [19]. Such differences in vitamin K intake could be due to different dietary habits between Western and Asian countries.
Furthermore, we found that vitamin K (phylloquinone) intake was the lowest in Koreans in their 20s and that the intake increased with age. These differences in vitamin K intake among age groups may be due to westernized dietary habits in the younger generation that show an increased consumption of foods that can be consumed quickly, such as processed foods and fast foods. Moreover, another US study reported higher vitamin K intakes (80-210 ug/day) in adults over 55 years of age, compared to 60-110 ug/day in adults below 45 years of age, suggesting that adults over 55 years of age consume more vegetables [20]. Similarly, in the present study, the discrepancies found in vitamin K intakes between Korean young, middle-aged, and elderly adults are reflective of whether the traditional Korean dietary habits, for example, consumption of large amounts of vegetables, has been maintained.
In summary, this is the first study to investigate vitamin K intake in Koreans and food sources of vitamin K. The results show that vitamin K intake could be increased through consumption of green vegetables, which are richest in vitamin K. This could be accomplished by employing traditional Korean diet that has higher vitamin K content than Western diet. The limitation of this study is that vitamin K2 intake could not be estimated due to the lack of information on vitamin K2 content in fermented foods including kimchi, Cheongukjang, and soybean paste. In conclusion, the main food sources of vitamin K for Koreans were vegetables, and the contribution was 72.8% of daily intake, followed by seaweeds, seasonings, and fat and oils. The findings of this study will give useful information for the evaluation of vitamin K status in the Korean population. Further studies on vitamin K content in Korean traditional foods are needed.
 XML Download