

 PDF
PDF ePub
ePub Citation
 Print
Print


Introduction
A chronic high-fat (HF) diet produces obesity and insulin resistance in rodents and humans, resulting in an effect similar to that of a Western-style diet [1-3]. A negative relationship between fat intake and insulin sensitivity has been noted in adult individuals [2]. Unfortunately, the incidence of insulin resistance is increasing in humans, resulting in various metabolic changes [4].
Insulin resistance is intimately involved in the pathogenesis of dyslipidemia because it impairs normal insulin-mediated suppression of free fatty acid (FFA) release from visceral adipose tissue, which results in the overproduction of very-low-density lipoprotein (VLDL) and leads to an increase in the plasma triglyceride (TG) levels. This situation is exacerbated by the reduced TG metabolism that occurs in an insulin-resistant state [4,5].
Researchers have recently become increasingly interested in studying the peroxisome proliferator-activated receptors α and γ (PPAR-α, PPAR-γ). PPARs are ligand-regulated transcription factors that belong to the nuclear hormone receptor super-family [6]. PPARs play a critical role in regulating insulin sensitivity and lipid metabolism during the development of high-fat diet-induced obesity, which likely has clinically relevant effects on the lipid profile [6]. Additionally, PPARs modify the β-oxidation of free fatty acid and regulate genes related to lipogenesis, resulting in lower levels of serum lipids [6,7].
Vitamin E is a lipophilic antioxidant that blocks the chain reaction of lipid peroxidation. Earlier studies have shown that supplementation with vitamin E had beneficial effects on insulin resistance in overweight individuals (BMI > 27 kg/m2) [8]. In recent years, there have been many attempts to study the effects of vitamin E with regard to the expression of PPAR-α and PPAR-γ in the liver by improving the cytoprotective effects in vivo and in vitro [9,10]. However, the effects of vitamin E administered orally as a lipid regulator with a HF diet over a long period of time have not been thoroughly investigated in the context of insulin resistance prevention.
Therefore, in this study, we examined the effects of oral supplementation of d-α-tocopherol with a high-fat diet for 20 weeks on insulin resistance, the lipid profile, lipid peroxidation, and the expression of PPAR-α and PPAR-γ in an animal model fed an HF diet.
Materials and Methods
Animal models and diets
The experimental protocol was approved by the Animal Care and Use Review Committee of Kyung Hee University (KHUASP-09-009). Five-week-old male C57BL/6J mice (n = 27) were purchased from Japan SLC, Inc. (Kyoto, Japan). The animals were housed (three per cage) in polycarbonate cages in temperature-controlled rooms (22 ± 2℃) with a 12 hr light/dark cycle, fed a pelleted chow diet, and given water ad libitum for an adaptation period of one week.
After the adaptation period, the mice were randomly divided into three groups. Nine mice were placed in the control group [CON, regular diet (10% of calories derived from corn oil) and distilled water as a vehicle (0.1 ml, p.o.)]. Another set of nine mice were placed in the high-fat group [HF, high-fat diet (45% of calories derived from lard) with distilled water as a vehicle (0.1 ml, p.o.)], while the rest of the mice were placed in the high-fat diet with daily oral administration of 100 IU/kg B.W. of d-α-tocopherol group [HF-E, high-fat diet (45% of calories derived from lard)].
At the end of the 20 week experimental period, mice were fasted for 12 hr overnight and then sacrificed, after which blood and tissues were collected, weighed, and snap frozen at -70℃ until further analyses.
Body weight and food consumption
The body weight and food consumption of the mice were measured weekly. The food efficiency ratio was calculated by the following formula: [weight gain (g)/day] / [amount of food consumed (g)/day].
Analysis of blood samples
Glucose in whole blood was measured monthly at the same time each day with a glucometer (Accu-Check, US) using one drop of blood obtained from a cut on the underside of the tail after a 12 hr fasting period. The plasma insulin levels were measured using an ALPCO™ mouse insulin ultra-sensitive EIA (Alpco, USA) after a 12 hr fasting period. This assay was conducted in duplicate according to the manufacturer's instructions.
The levels of triglycerides (TG) and total cholesterol (TC) were enzymatically measured using the absorbance method at 550 nm and 500 nm vs. a reagent blank with a commercial kit (Asan Pharm. Co., Korea). The TC level was obtained based on the cholesterol oxidase method. Plasma high-density lipoprotein (HDL-C) was measured via absorbance at 500 nm vs. a reagent blank using a commercial kit (Asan Pharm. Co., Korea). Low-density lipoprotein (LDL-C) was obtained using the following equation: LDL-C = Total-C-HDL-C-TG/5; VLDL-C = TG/5. The level of FFA was also measured with a commercial kit (Bioassay, USA).
Estimation of hepatic lipids
The hepatic lipids were extracted according to Folch et al. [11]. Briefly, a 50 mg portion of liver tissue was homogenized with chloroform/methanol (2/1). After dispersion, the entire mixture was agitated for 30 min (300 rpm) in an orbital shaker at room temperature. The homogenate was then centrifuged for 5 min (2,000 rpm) to recover the liquid phase, after which the solvent was washed with 60 µl of distilled water. After vortexing for a few seconds, the mixture was centrifuged at low speed (2,000 rpm) for 5 min to separate the two phases. The upper phase was then removed, after which the lower chloroform phase containing the lipids was evaporated under vacuum condition.
To determine the serum levels of triglycerides, the extract (10 µg) was diluted with Folch solution (90 µg), while for the total cholesterol, the extract (10 µg) was diluted with Triton-X100: ETOH (1:3) (50 µg). The levels of triglycerides and total cholesterol in the liver were then measured using the same method that was used for the serum.
Analysis of serum and liver malondialdehyde (MDA)
The MDA levels, which represent the end-product of lipid peroxidation, were measured by the formation of thiobarbituric acid-reactive substance (TBARS). The TBARS levels were measured in duplicate with commercial TBARS Assay Kits (Cell Biolabs, USA).
Suspended liver tissues (50 mg/mL of PBS containing BHT) were homogenized on ice and then centrifuged (10,000 × g) at 4℃ for 15 min. Samples (100 µl) of serum or supernatant from the liver homogenate were then added to separate microcentrifuge tubes, after which an equal volume of sodium dodecyl sulfate lysis solution was added followed by 250 µL of TBA reagent. The adduct concentration was then determined at 540 nm on a plate reader. Finally, the results were expressed as µM (serum) and µM/mg protein (liver).
Protein expression
Total proteins were extracted from frozen liver tissues (50 mg) that were initially pulverized under liquid nitrogen. The samples were then homogenized on ice with a sonicator in lysis buffer (20 mM TrisHCl NaCl 37.5, 10% glycerol, 5 mM EDTA 4, 1% Triton-X, 0.5% Nonidet P-40, 100 µM phenylmethylsulfonyl fluoride, 50 M NaF, and 1 mM sodium orthovanadate). The lysates were then centrifuged for 4 min (12,000 rpm) at 4℃, after which the supernatant was collected and the protein concentration was determined using a Bradford Protein Assay (Sigma, Germany) with bovine serum albumin as a standard.
About 60 µg of total protein was loaded in each lane of a 7.5% polyacrylamide gel for Western blot experiments. Proteins were then separated by 7.5% sodium dodecyl sulphate-polyacrylamide gel electrophoresis (SDS-PAGE) and transferred to a polyvinyldenedifluoride (PVDF) membrane. After being transferred, the membranes were blocked overnight in TBS containing Tween 20, then probed with the appropriate primary antibody (rabbit anti-PPAR-γ (1/1000, Cell Signaling Technology, USA) or rabbit anti-PPAR-α (1/1000, Bioworld Technology, USA)). Western blot for β-actin was then performed using rabbit anti-β-actin (1/1000, Cell signaling technology, USA) to ensure equal sample loading. Following incubation with the antibodies, the membranes were washed in TBS-T, after which blots were incubated with secondary antibody conjugated to horseradish peroxidase in 5% skim milk (dilution 1:5000). Finally, the immunoreactive bands were visualized by autoradiography and the density of the bands was evaluated densitometrically using an enhanced chemiluminescence detection system.
Statistical analysis
Data were presented as the mean ± standard deviation (SD) for nine rats per group. Comparisons across groups were made by one-way analysis of variance (ANOVA) followed by Duncan's multiple range test. A P < 0.05 was considered statistically significant. All analyses were conducted using SPSS 13.0 (SPSS Inc., USA).
Results
Body weights, organ weights, and calorie intake
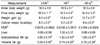
The body weights, organ weights, and calorie intakes are shown in Table 1. The high fat diet was associated with a higher body weight in both the HF and HF-E groups compared with the CON group after the 20-week experimental period (HF, 32.2 ± 2.9 g; HF-E, 32.4 ± 3.3 g; CON, 26.0 ± 1.1 g; P < 0.05). Additionally, the daily calorie intakes of the HF and HF-E groups were higher than that of the CON group (HF, 9.2 ± 0.3 kcal; HF-E, 9.4 ± 0.2 kcal; CON, 8.2 ± 0.2 kcal; P < 0.05). The adipose tissue weights were higher in the HF and HF-E groups than in the CON group (P < 0.05).
Blood levels of glucose, insulin and HOMA-IR
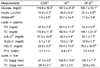
The levels of blood glucose, serum insulin and HOMA-IR are shown in Table 2. A high-fat diet was associated with higher blood glucose levels in both the HF and HF-E groups than in the CON group at 20 weeks (HF, 197.2 ± 21.6 mg/dl; HF-E, 190.1 ± 13.1 mg/dl; CON, 119.8 ± 19.3 mg/dl; P < 0.05). The high-fat diet was also associated with higher serum insulin concentrations (HF, 28.6 ± 8.5 µIU/dl; HF-E, 22.3 ± 5.8 µIU/dl; CON, 15.0 ± 6.7 µIU/dl; P < 0.05). The HF group had higher HOMA-IR levels than the CON and HF-E groups (HF, 20.7 ± 14.4; HF-E, 11.5 ± 3.4; CON, 7.0 ± 5.6; P < 0.05).
Serum and hepatic lipid levels
The serum and hepatic levels of lipids are also shown in Table 2. The serum levels of TG in the HF group were significantly higher than those in the CON and the HF-E groups (HF, 64.5 ± 11.7 mg/dl; HF-E, 54.3 ± 5.7 mg/dl; CON, 42.0 ± 7.9 mg/dl; P < 0.05). The levels of serum TC in the HF and HF-E groups were significantly higher than in the CON group (HF, 160.9 ± 11.6 mg/dl; HF-E, 146.1 ± 21.0 mg/dl; CON, 110.9 ± 11.9 mg/dl; P < 0.05).
The levels of serum VLDL-C were highest in the HF, HF-E and CON group in descending order (HF, 13.5 ± 1.8 mg/dl; HF-E, 10.9 ± 1.1 mg/dl; CON, 8.1 ± 1.3 mg/dl; P < 0.05). The HDL-C levels in the HF groups were significantly higher than in the CON group (HF, 83.4 ± 13.5 mg/dl; HF-E, 75.5 ± 16.0 mg/dl; CON, 63.0 ± 5.2 mg/dl; P < 0.05). There were no significant differences in serum FFA levels among groups.
The concentrations of hepatic TG in the HF and HF-E groups were significantly higher than in the CON group (HF, 106.9 ± 10.6 mg/g; HF-E, 108.7 ± 7.7 mg/dl; CON, 97.3 ± 2.6 mg/g, P < 0.05). No significant differences in hepatic total cholesterol levels were observed among groups.
Serum and hepatic MDA levels
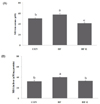
The MDA levels, which represent the index of lipid peroxidation in the serum and liver, are shown in Fig. 1. The serum levels of MDA in the HF group (57.5 ± 3.06 µM) were significantly higher than in the CON group (50.5 ± 1.23 µM). In addition, e d-α-tocopherol led to a clear reduction in MDA in the HF-E group (41.3 ± 1.54 µM) (P < 0.05).
In the liver, the MDA level of the HF group (40.2 ± 0.59 µ M/mg protein) was significantly higher (P < 0.05) than that of the CON group (32.4 ± 2.15 µM/mg protein). Moreover, a significant decrease in the MDA level was observed in the HF-E group (33.2 ± 0.63 µM/mg protein) (P < 0.05), while the MDA level of the HF-E group showed a similar decrease as that in the CON group.
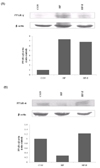
Expression of PPAR-α and PPAR-γ in liver
Expression levels of PPAR-α and PPAR-γ in the liver are shown in Fig. 2. The expression of PPAR-α was reduced in the liver in the HF group, while d-α-tocopherol supplementation prevented HF-induced PPAR-α down-regulation. Conversely, the expression of PPAR-γ in the liver of HF-fed mice was up-regulated, whereas supplementation of d-α-tocopherol reduced its expression.
Discussion
The high-fat diet-fed C57BL/6J mouse is an efficient model of insulin resistance and can therefore be used in mechanistic studies as a tool for developing novel therapeutic interventions [12]. Earlier studies have been investigated the treatment effects of d-α-tocopherols on insulin resistance, lipid profiles, or dyslipidemia-related other parameters [13-16]. Because the pathogenesis of insulin resistance and dyslipidemia is strongly linked to excessive food consumption, especially fat intake over a long period, the present study was designed to investigate the preventive effects of d-α-tocopherol supplementation with a HF diet (45% of total calories from fat) on insulin resistance, and several parameters related to lipid metabolism, oxidative stress and the expression of PPAR-α and PPAR-γ in C57BL/6J mice.
This study demonstrated that 20-weeks of high-fat diet induced significant body fat (subcutaneous and visceral fat) accumulation, insulin resistance, and dyslipidemia (specifically of the TG and TC levels) in an animal model. Numerous studies have demonstrated that pathogenesis of insulin resistance induced by HF diet is a consequence of chronically increased oxidative stress that impairs the insulin signaling pathways [17,18]. The identified effects of vitamin E on glucose control are related to the vitamin's antioxidant activity, with possible effects on insulin sensitivity and lipid oxidation [19]. An investigation of insulin resistant animal models [20] and overweight subjects [8] revealed that vitamin E supplementation improved insulin sensitivity. One of the proposed mechanisms of insulin sensitivity could be inhibition of activation of the nuclear factor kappa-light-chain-enhancer of activated B cells (NF-kB), which was activated by oxidative stress [21].
Interestingly, in the present study, the HF-E group exhibited a significant improvement in insulin resistance relative to the HF group, although no changes were observed in visceral and subcutaneous fat, suggesting that supplementation with d-α-tocopherol may be an important nutritional factor in the prevention of insulin resistance. A previous study provided strong evidence that dietary polyphenols reduce obesity-related inflammation by inhibiting NF-kB activation to regulate insulin resistance [22]. Moreover, supplementation of d-α-tocopherol was found to be associated with a significant reduction in the serum and hepatic MDA levels, which are markers of systemic and hepatic oxidative stress.
High fat intake may have an adverse effect on oxidative stress, which leads to increases in insulin resistance that increases the VLDL levels and results in increased plasma TG. Insulin resistance is both a cause and a consequence of abnormalities of lipid metabolism [5,20]. It was previously reported that d-α-tocopherol can regulate the expression of genes involved in lipid uptake [23], and a variety of transcription factors, including PPAR-α and PPAR-γ, mediate the regulation of lipid metabolism [24,25].
In a previous study, vitamin E treatment exerted beneficial effects by suppressing oxidative stress, which may lead to improvement by reducing insulin resistance and PPAR-α expression without changes in body mass index [26]. Another study also showed that polyphenol supplements improved insulin sensitivity and lipid profiles and altered the expression of PPAR-α without changes in body fat in an obese animal model [27]. In addition, increased PPAR-α expression in response to α-tocopherol in human hepatocytes might have a beneficial effect on lipid metabolism [10]. High levels of PPAR-α expression increase β-oxidation of fatty acids in the liver, which may be possible through the up-regulation of uncoupling protein-2 (UCP2) mRNA expression in the liver by PPAR-α [28]. PPAR-α activators increase the utilization of lipids in the liver, thereby reducing the serum TG levels [29]. In this study, a decrease in the expression of liver PPAR-α was observed in the HF group, while an increase was observed in the HF-E group.
Hepatic PPAR-γ has also been implicated in the regulation of insulin resistance [30]. Although these ligand-activated transcription factors are primarily expressed in adipose tissue, there is increasing evidence of their up-regulation in the liver. This is related to increased insulin resistance, despite the fact that this receptor isoform can protect other tissues from insulin resistance [30]. Moreover, the deficiency of hepatic PPAR-γ improves insulin sensitivity. In this study, an increase in the hepatic protein expression of PPAR-γ was observed in the high fat diet group and down-regulation was observed in response to vitamin E supplementation. These findings are in agreement with those of an earlier study that showed administration of vitamin E with a high-fat diet has a negative effect on PPAR-γ [9].
In conclusion, this study showed that administration of an HF diet (45% total calories from fat) for 20 weeks induced insulin resistance and altered the lipid profiles. D-α-tocopherol supplements improved insulin resistance and serum TG levels and decreased the levels of MDA in serum and the liver. Furthermore, increased hepatic PPAR-α expression and decreased PPAR-γ expression levels were noted. Thus, considering that the pathogenesis of insulin resistance and dyslipidemia are strongly linked to an HF diet over a long period of time, oral administration of d-α-tocopherol with a HF diet has positive and preventive effects on insulin resistance, lipid profiles, and oxidative stress through PPAR-α and PPAR-γ expression in mice.
It should be noted that there were several limitations to this study. Specifically, the PPAR-α and PPAR-γ expression levels were measured as lipid regulators; however, related factors such as CPT-1 activity or SREBP-1c expression should also be measured. Additionally, this study showed an effect of d-α-tocopherol on lipid metabolism via hepatic PPAR-α and PPAR-γ expression, but the expression of these compounds in adipose tissue might be also required.
 XML Download