

 PDF
PDF ePub
ePub Citation
 Print
Print


Introduction
A number of studies have found an inverse relation between sufficient intake of fruits high in phenolics and the risks of chronic disease [1,2]. Among many fruits [3], cranberry contains a relatively higher amount of bio-active substances such as anthocyanidin, procyanidins and quercetin, which are highly potent antioxidants and effective in management of infectious diseases, as well as protein glycation [4-6]. In our previous study, cranberry powder was shown to modulate inflammatory cytokine production in a lipopolysaccharide-induced rat model [7]. In addition, cranberry products have been shown to affect insulin release and glucose control in aged rats and humans [8,9], and cranberry powder has been suggested as a potential food-based strategy for management of hyperglycemia [10].
Oxidative stress is known to be closely related to diabetes and obesity, which are characterized by insulin resistance and low-grade inflammation [11]. People with diabetes or insulin resistance often have obesity along with dyslipidemia [12], and these metabolic disorders increase one's oxidative stress even further [13]. Elevated oxidative stress induced by high blood glucose in diabetes leads to development of chronic diabetic complications such as dyslipidemia, hypertension, and atherosclerosis [14]. In addition, type 2 diabetic patients are susceptible to lipopolysaccharides (LPS) [15], and have a greater risk for development of infectious disease and an increased infection-related mortality than people without diabetes [16].
LPS acts as an endotoxin and elicits inflammation in animals [17], as well as oxidative stress measured by suppression of cellular antioxidant enzyme status. It also enhanced radical production and increased markers of lipid and protein oxidation [18]. In addition, association of LPS with onset and progression of metabolic disease has been reported [19], and, together with a high fat diet, LPS triggers obesity and diabetes by facilitation of insulin resistance [20].
The C57BL/KsJ-db/db mouse, a well-accepted and most widely used mouse model of type 2 diabetes, has hyperglycemia, insulin resistance, and hyperleptinemia [21]. In the current study, we attempted to induce the course of diabetic complications in C57BL/KsJ-db/db mice by increasing oxidative stress with metabolic endotoxin and an atherogenic diet. Then, we aimed to investigate the question of whether oral administration of cranberry powder can alleviate dyslipidemia and oxidative stress in this animal model. In addition, glucose modulating effect of cranberry powder was examined in obese diabetic animals with high oxidative stress.
Materials and Methods
Animal and diet
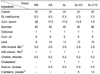
Forty obese diabetic homogeneous C57BL/KsJ-db/db mice weighing between 27 and 42 g were purchased from Animals Inc. (Central Lab., Seoul, Korea). The db/db mice were housed in the polycarbonate cages under a specific condition with temperature-controlled (23 ± 2℃), humidity-controlled (50 ± 10%), and light-controlled for 12 hours (07:00~19:00). The db/db mice were fed a chow diet and tap water ad libitum for one week before the experiment. After an adaptation period of one week, db/db mice were divided by randomized complete block design into the following five groups: (1) normal diet + saline (NS), (2) atherogenic diet + saline (AS), (3) atherogenic diet + LPS (AL), (4) atherogenic diet + 5% cranberry powder + LPS (AL-C5), and (5) atherogenic diet + 10% cranberry powder + LPS (AL-C10). All diets were the modified AIN-76 [22] (Table 1). Each diet and tap water were given ad libitum during the experimental period.
Cranberry powder was manufactured by Kiantama Oy (Suomussalmi, Finland). Anthocyanin and proanthocyanidin contents reported by the manufacturer were 120 mg/100 g and 2,600 mg/100 g, respectively. Analysis of nutrient amounts of cranberry powder was performed at the Korea Food Research Institute. Calorie of cranberry powder was 3.66 kcal/g and water, fat, protein, carbohydrate, sugar, and fiber amounts per 1 g cranberry powder were 0.116, 0.038, 0.035, 0.795, 0.107, and 0.231 g, respectively (Table 1).
The amount of food consumption was recorded daily, and body weights and blood glucose level were measured weekly. Eighteen hours prior to the final postmortem exam, the NS and AS groups were selected to receive an injection of 0.9% physiological salt solution (0.5 mg/kg body weight) and the AL, AL-C5, and AL-C10 groups were injected with 0.5 mg of LPS (lipopolysaccharide from Escherichia coli 026:B6, Sigma Co., St. Louis, MO, USA) per kg body weight into their abdominal cavity. After experimental periods of six weeks, mice were fasted for 12 hours and then sacrificed under ethyl ether anesthesia. All animal experiment procedures followed guidelines approved by the Animal Ethics Committee of Seoul Women's University (IACUC-A-1).
Blood and tissue preparation
Blood samples were collected in a vacuum tube (Becton Dickinson, Melylan, France) without anticoagulant for biochemical analysis. Serum was separated by centrifuging at 3,000 rpm (4℃) for 20 min (Sovall ST16R Centrifuge, Thermo Scientific Co., Rockford, IL, USA) and stored at -80℃ before analysis. Following rapid removal, liver was washed in saline buffer and weighed, and cytosol and microsome were separated. Remaining liver tissues were stored at -80℃ after being plunged into liquid nitrogen for further assay.
The liver cytosol and microsome were separated using the method of Masmoudi et al. [23]. The liver tissue was homogenized with buffer (0.3 mM sucrose, 2 mM ethylene diamine tetraacetic acid (EDTA), 10% glycerol, 20 mM N-2-hydroxyethylpiperazine-N-2-ethane sulfonic acid (HEPES), pH 7.5). A portion of the homogenates was centrifuged at 1000 g for 15 min and those of the pellet were discarded and the remaining supernatant was re-centrifuged at 100,000 g for one hour (Optima™ LE-80K Ultra centrifuge, Beckman Coulter Inc., Pasadena, California, USA). The supernatant was used as cytosol for measuring FRAP, total flavonoid and phenolics levels, and activities of superoxide dismutase (SOD), catalase, glutathione reductase (GSH-R), and glutathione peroxidase (GSH-Px). The remaining pellets were re-suspended in buffer (0.05 M potassium phosphate, 20 mM β-mercaptoethanol, 20 mM EDTA, pH 7.2) as microsomes for detection of thiobarbituric acid reactive substance (TBARS) level.
Serum lipid profiles
The concentrations of serum total cholesterol, triglyceride, high density lipoprotein (HDL)-cholesterol, and glucose were determined using an automatic biochemical analysis system (Vitalab Selectra E, Vital Scientific Co., Dieren, The Netherlands). Atherogenic index (AI) was deducted as the formulation of Lauer et al. [24].
AI = (total cholesterol-HDL cholesterol)/HDL cholesterol
Serum glucose, insulin, and leptin levels
Serum glucose level was determined using an automatic biochemical analysis system (Vitalab Selectra E, Vital Scientific Co., Dieren, The Netherlands). Serum insulin and leptin levels were measured using corresponding commercial kits (insulin: mouse insulin ELISA kit, ALPCO Diagnostics, Salem, NH, USA, leptin: mouse/rat leptin enzyme immunoassay (EIA) kit, SPI-bio, Bretonneux, France) that employ sandwich type immunoassay techniques. All optical density values of insulin and leptin detection were measured at 450 nm using a plate reader.
Cytosolic ferric reducing antioxidant power (FRAP), total phenolics and total flavonoids
The FRAP assay was performed using the Benzie and Strain method [25]. This method is based on the reduction of a ferric-tripyridyl triazine complex to its ferrous, forming color in the presence of antioxidants. FRAP values are measured by detection of the absorbance change of the test sample as the reducing power of antioxidants present compared with that of the trolox standard, using a plate reader (Spectra Max 250, Molecular Devices, Sunnyvale, CA, USA).
The total phenolics concentration was measured using the Folin-Ciocalteu method [26]. With the mixture of 25 µl cytosol, 432.5 µl distilled water was incubated with 37.5 µl Folin-Ciocalteu reagent at room temperature for 5 min. After 5 min, 300 µl of a 20% Na2CO3 solution was added with mixing. The solution was then immediately diluted to a volume of 285 µl with distilled water and mixed thoroughly. After incubation for 2 hours at 23℃, the absorbance relative to that of a prepared blank at 760 nm was measured using a plate reader (Spectra Max 250, Molecular Devices, Sunnyvale, CA, USA). The total phenolic contents of the samples are expressed in micromoles per serving of gallic acid equivalent (GAE).
The total flavonoid level in cytosol was measured by spectrophotometric method using catechin as standard [27]; 250 µl of sample and 37.5 µl of 5% NaNO2 were mixed and incubated at room temperature for 5 min; 75 µl of 10% AlCl3 was added and also incubated for 5 min at room temperature, followed by addition of 250 µl of 1 M NaOH. The absorbance of the solution was measured at 510 nm.
Cytosolic antioxidant enzyme activities
Total SOD activity in liver cytosol was measured using a commercial kit (Cayman chemical superoxide dismutase assay kit, Cayman Chemical Co., Ann Arbor, MI, USA) and determined spectrophotometrically as the inhibition rate of reduction of cytochrome by superoxide radical in absorbance at 440 nm. One unit of SOD is defined as the amount of enzyme required to inhibit 50% dismutation of the superoxide radical.
Cytosolic catalase, GSH-Px, and GSH-R activities were measured using commercial assay kits (Cayman Chemical Co., Ann Arbor, MI, USA). Catalase activity was expressed as the rate of decomposition for H2O2 at 240 nm and GSH-Px activity was expressed as nmole of reduced NADPH/min/mg protein.
Serum protein carbonyl and microsomal TBARS levels
Serum protein carbonyl level was measured using enzyme linked immunosorbent assay (ELISA) based on detection of protein hydrazones formed from the reaction of dinitrophenylhydrazine (DNP) with protein carbonyl using the Biocell PC test kit (BioCell Corp., Ltd., Papatoetoe, Auckland, New Zealand). Protein concentration was determined using the method of Lowry with bovine serum albumin as the standard [28].
As a marker of lipid peroxidation, microsomal TBARS concentration was determined using a spectrophotometer (Spectra Max 250, Molecular Devices, Sunnyvale, CA, USA) and the TBARS assay kit (ZeptoMetrix Co., St. Buffalo, NY, USA) was used.
Statistical analysis
Data were analyzed using the SAS program (version 9.1, SAS Inc., Cary, NC, USA). One-way analysis of variance was performed using a completely randomized block design and Duncan's multiple range tests were applied for comparison of individual means when the F-value was significant. A P < 0.05 was considered significant unless otherwise stated.
Results
Food intake, body weight, and liver weight
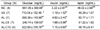
As four mice in each NS and AL-C10 group and one mouse in each AS, AL, and AL-C5 group died during the experiment, this study was conducted with 29 mice. The amount of dietary intake of groups with LPS was significantly decreased compared to that of the NS group; however, we did not observe significant effects with cranberry powder treatment. No significant differences in final body weights and weight gain were observed among all groups. Significantly heavier liver weight was observed in the AS group than in the NS group, but it was decreased with LPS injection. However, liver weight was not significantly affected by treatment with cranberry powder. The relative liver weight was significantly increased by an atherogenic diet, but was not affected by LPS injection or treatment with cranberry powder (Table 2).
Lipid profiles
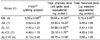
The mean triglyceride level tended to show an increase with an atherogenic diet. Serum total-cholesterol level was significantly increased with an atherogenic diet, however, no significant changes were observed with LPS injection or cranberry powder fortification. HDL-cholesterol level was decreased by 30~60% with an atherogenic diet with or without LPS and 5% cranberry powder. However, with 10% cranberry fortification, HDL-cholesterol tended to be restored to the level close to that of the NS group. AIs of all atherogenic diet groups were significantly higher compared with the NS group, and no significant changes were observed with LPS or cranberry treatments (Table 3).
Serum glucose, insulin, and leptin levels
The level of glucose showed the greatest increase in the AS group, and tended to decrease with LPS injection. With 5% cranberry treatment, a further decrease of 19% was observed (Table 4).
Serum insulin concentration tended to decrease by an atherogenic diet only; however, injection of LPS along with an atherogenic diet resulted in four times of elevation. This increased insulin level was significantly decreased by treatment with cranberry powder. No significant differences were observed in serum leptin levels of groups (Table 4).
Total antioxidant status
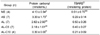
Cytosolic FRAP level and total flavonoid concentration were not significantly different in all groups. However, the levels tended to be repressed by LPS injection and were slightly restored by fortification with 10% cranberry powder. The concentrations of cytosolic total phenolic compounds tended to decrease by LPS injection or treatment with cranberry powder (Table 5).
Liver cytosolic antioxidant enzyme activities
We observed no significant effect of an atherogenic diet on cytosolic SOD activity; however, SOD activity was significantly lowered by LPS injection. In addition, SOD activities tended to decrease by treatment with cranberry powder (Table 6).
Cytosolic catalase activity tended to increase with an atherogenic diet itself, but was lowered by additional LPS injection or cranberry fortification. However, these changes did not meet statistical significance (Table 6).
GSH-Px activities were significantly decreased by an atherogenic diet, and increased by LPS injection. With 10% cranberry treatment, there was significant reduction of GSH-Px activity. No significant differences in GSH-R activities were observed among all groups. However, GSH-R activities tended to be lowered by an atherogenic diet or LPS injection (Table 6).
Serum protein carbonyl and liver microsomal TBARS concentration
Reductions of approximately 17 and 89% were observed in groups with 5 and 10% cranberry treatments, respectively, as compared to the AL group (Table 7). However, these changes did not reach statistical significance.
No significant differences in TBARS concentrations were observed among all groups. However, with cranberry powder, mean TBARS concentrations tended to show a decrease (Table 7).
Discussion
This study was conducted in order to examine the ameliorative effects of cranberry powder on dyslipidemia, glucose control, and oxidative stress in obese diabetic animals treated with LPS and an atherogenic diet. C57BL/KsJ-db/db mice, one of the known diabetic animal models, have approximately 2-fold higher serum cholesterol and 81% higher HDL-cholesterol levels, a major lipoprotein in db/db mice, compared to non-diabetic control mice [29]. In addition, plasma cholesterol level in db/db mice was increased to approximately 350 mg/dL when animals were fed a western diet containing 20% fat and 0.15% cholesterol for two weeks [29]. Following 30 days of an atherogenic diet with 15% fat and 1.25% cholesterol, an increase in plasma cholesterol level, close to 500 mg/dL (13 mmol/L), was observed, while HDL-cholesterol level and HDL/VLDL + LDL ratio were reduced by 20% and 3.2 times [30]. We also observed that serum total cholesterol level was increased twice by the atherogenic diet. Treatment of animals with LPS injection in addition to the atherogenic diet resulted in an increase of serum triglyceride level by 2 to 4.5 times and HDL-cholesterol was decreased by 1.5 times, compared to diabetic animals without LPS and diet modification. As expected, use of an atherogenic diet in this study resulted in impairment of lipid profiles of diabetic animals, and additional LPS treatment appeared to cause even worse dyslipidemia than that induced by only a high fat diet. In the study reported by Memon et al. [31], LPS administration (1 µg per mouse) induced hepatic synthesis of cholesterol and fatty acid in LPS-sensitive C57BL6 mice, which led to a 62% increase in serum triglyceride and a 41% increase in serum cholesterol. Dyslipidemia observed in the current study, increases in levels of serum total-cholesterol and triglyceride, and a decrease in level of HDL-cholesterol are diabetic complications [12], and the main cause of exacerbation of cardiovascular and coronary diseases [32,33]. Although no hypolipidemic effect was observed with cranberry powder fortification, we observed an elevation of mean HDL-cholesterol level of approximately 30% when animals were given 10% cranberry powder for six weeks. In our previous study [7], fortification with 5% cranberry powder resulted in increased serum HDL-cholesterol of rats treated with LPS and an atherogenic diet. A similar effect of cranberry product on modulation of HDL-cholesterol was observed in a human clinical trial in which 30 males consumed 125/250/500 mL of cranberry juice each day for a period of four weeks [34]. In the current study, we regrettably observed non-significant elevations of serum triglyceride in groups treated with cranberry powder. The cranberry powder used in the current study contained 79.5% carbohydrate and 3.6 kcal/g, which are similar to the composition of corn starch utilized as the replacement for cranberry powder. In addition, cranberry powder contained 23.1% dietary fiber, which is known to lower circulating triglyceride level in diabetic patients [35]. Therefore, we assume that neither carbohydrate content nor additional calories of cranberry powder may be main factors affecting synthesis of hepatic triglyceride. Similarly, in a study reported by Deyhim et al. [36], drinking cranberry juice for a period of four months resulted in an increase in plasma triglyceride concentration even though hepatic triglyceride level was decreased in orchidectomized rats. Findings of this study suggested that cranberry juice has abundant bioactive anthocyanins and flavonoids; however, it did not have an effect on circulating triglyceride homeostasis regardless of hepatic clearance of triglyceride. Further study of the physiological mechanism of potential increase in circulating triglyceride by cranberry products is needed. However, based on the results of the current study, we also assume that cranberry powder at the levels used in the current study might not be effective for lowering or significantly changing serum triglyceride level.
In a study reported by Vives-Pi et al. [37], high-dose of LPS was shown to stimulate insulin secretion from human pancreatic islets. This observation partially explains our findings in the current study, increased circulating insulin levels with LPS injection. Subsequently, increased insulin might play a role in decreasing serum glucose level. Zhu et al. [9] reported that long term cranberry supplementation led to an increase in release of insulin in aging rats. Jankowski et al. [38] reported that red wine anthocyanin decreased sugar levels in urine and serum of streptozotocin induced diabetes rats. On the other hand, Khanal et al. [39] reported that fasting plasma insulin level was lowered in diet groups with cranberry powder compared with the control group. In addition, in the intervention study reported by Chambers and Camire [8], insulin levels of diabetic patients were significantly lowered by supplementation of cranberry juice concentrate powder capsules, however, fasting serum glucose levels were not significantly changed, possibly due to poor glycemic control of diabetic subjects. Similarly, we also observed that mean levels of serum insulin were significantly decreased in diabetic animals fed cranberry powder, however, we did not observe any significant changes in the fasting glucose level. We might assume that a cranberry powder fortified diet, up to 10%, could decrease serum insulin level but was not effective in improvement of glucose control of db/db mice. However, of particular interest, the mean serum glucose level in the 5% cranberry group was slightly lower than that in the AL group, even though an increase in serum insulin concentration by LPS injection was repressed by consumption of cranberry powder. These observations suggest that a certain level of cranberry powder, possibly a moderate amount, may have a potential glucose lowering effect, which might be related to modulation of insulin sensitivity rather than stimulation of insulin release. Leptin, an adipocytokine, is known to be related to inhibition of appetite, regulation of metabolism and energy balance, and control of body weight [40]. Morton et al. [41] reported that suppression of leptin gene expression caused an increase in insulin resistance, suggesting that leptin might have a role in control of insulin sensitivity. The db/db mouse generally has hyperglycemia, insulin resistance, and hyperleptinemia while on a control diet. Sahai et al. [21] reported a range of serum leptin levels in db/db mice of 18.9-52.7 ng/mL. In addition, serum leptin level showed an increase, up to 58.2 ng/mL, by a high fat diet in ICR mice [42]. These levels are similar to the leptin levels observed in the current study. We did not observe a significant difference in serum leptin level by LPS injection or treatment with cranberry powder, however, we observed a significantly negative correlation between serum glucose and leptin levels (r = -0.647, P < 0.001). In addition, a non-significant increase in mean leptin level was observed with 5% cranberry powder. Khanal et al. [39] reported that consumption of cranberry powder caused a reductive tendency of fasting glucose and insulin levels and decreased homeostatic models of insulin resistance (HOMA-IR). In the current study, we were also able to observe some changes in serum glucose, insulin, and leptin levels with cranberry powder, and these observations may support that the potential function of cranberry powder in blood glucose modulation was related to control of insulin sensitivity.
Our results showed that liver cytosolic FRAP and total flavonoid content were not significantly changed by any treatments, but were slightly decreased by LPS injection and increased by a 10% cranberry powder diet. The tendency of decreasing by LPS injection was also observed in the cytosolic level of phenolic compounds. It is assumed that antioxidant status measured by FRAP, total phenolic and flavonoid contents was decreased by LPS injection, which is considered a consequence of increased oxidative stress [43]. In a short-term intervention study for evaluation of cranberry juice, a slight increase of plasma antioxidant capacity was observed, while dietary and possibly active compounds from cranberry juice did not appear to have an effect on plasma levels, possibly due to rapid degradation after consumption [44]. This metabolic degradation theory might partially explain the reason for our failure to observe any significant changes in FRAP, total phenolics, and flavonoid contents after treating with cranberry powder.
SOD, catalase, and GSH-Px play important roles in antioxidant defense mechanism by scavenging reactive oxygen species as well as removing free radicals. In the current study, with 10% cranberry powder treatment, the cytosolic SOD activity showed an insignificant decrease, and GSH-Px activity showed a significant decrease compared with the AL group. Although no significant changes were observed, catalase activity also showed a tendency to be repressed by a cranberry powder fortified diet. In an animal study reported by Kim and Kim [45], SOD and xanthine oxidase activities were insignificantly lowered when rats were fed a diet containing mandarin peel. They suggested that SOD activity was decreased because a number of flavonoids in mandarin peel could lower the activity of xanthine oxidase and consequently decrease levels of superoxide radicals and hydrogen peroxide. Therefore, we might assume that flavonoids in cranberry powder utilized in the current study acted as antioxidants, which suppress production of oxygen radicals, resulting in a decrease in activities of antioxidant enzymes such as SOD, catalase, and GSH-Px. In a study reported by Zhu et al. [46], an increase in activities of GSH redox recycling enzymes, GSH-Px and GSH-R was observed in the midbrain after supra-nigral LPS injection for three days, accompanied by a significant decrease in reduced form of GSH. Unlike this result, we did not observe any significant changes in liver cytosolic GSH-R activities 18 hours after abdominal LPS injection. However, we found that GSH-Px activity in the AL group was significantly higher than that in the AS group, possibly due to an increase in the body's antioxidant defense system against LPS-induced oxidative stress, suggesting a compensatory response to increased oxidative stress in animals receiving acute LPS injection [46]. In addition, with 10% cranberry powder, but not with 5% cranberry powder, GSH-Px activity was lowered to a level close to that of the AS group. This result, in part, explains that consuming 10% cranberry powder might provide a sufficient amount of antioxidants for restoration of GSH redox status altered by LPS.
In the current study, we treated animals with LPS in order to increase oxidative stress, as reported by Kukongviriyapan et al. [18]. Of markers of oxidative stress, serum levels of protein carbonyl were not increased by LPS injection, while microsomal TBARS tended to show an increase. In addition to LPS injection, when we treated animals with 10% cranberry powder, a reduction of mean microsomal TBARS and mean serum protein carbonyl of approximately 58% and 89% was observed, respectively. Antioxidant effect is a well-established function of cranberry or flavonoids found in the cranberry [47]. In addition, cranberry procyanidins have been found to scavenge reactive carbonyls by formation of adducts [4], and the current study demonstrated a reduction of serum protein carbonyl when diabetic animals were treated with 10% cranberry powder. The reactive carbonyl compounds are formed during lipid peroxidation and sugar glycoxidation, and accumulate with aging and oxidative stress associated chronic diseases such as atherosclerosis and diabetes [48]. Scavenging of lipid-derived reactive carbonyl species has been suggested as a new therapeutic target of carbonyl associated diseases, including diabetes [49], and development of new drugs having both antioxidant and carbonyl trapping properties has been suggested for treatment of those diseases [50]. Although further investigations may be required to verify prospective properties against carbonyl stress, it might be worthwhile to consider cranberry or polyphenol(s) in cranberry as a potential natural agent for sharing both antioxidant and carbonyl scavenging properties.
In summary, fortification of the high fat diet with cranberry powder is likely to have potential effects on increasing insulin sensitivity, in addition to increasing HDL-cholesterol and providing antioxidants that modulate activities of antioxidant enzymes in type 2 diabetic animal models. Furthermore, lowered protein carbonyl levels with 10% cranberry powder suggested cranberry or its components as a potential therapeutic agent for carbonyl associated diseases such as diabetes. However, we cannot overlook the potential disadvantages of cranberry product, which might affect serum levels of triglyceride and glucose. Overall findings from the current study suggest that cranberry products might be considered as functional foods that can ameliorate physiological condition of diabetes with high oxidative stress, while verification of the physiological mechanism underlying increased triglyceride by cranberry product is still needed.


 XML Download