

 PDF
PDF ePub
ePub Citation
 Print
Print


Introduction
Vinegar is a useful liquid that results from the fermentation of ethanol. Historically, it has been used not only as a seasoning and preservative but also as a traditional folk medicine. The key component of vinegar is acetic acid, which is present at a concentration of 3-9% for consumer use [1]. The liver is the principal organ responsible for the metabolism of absorbed acetic acid after oral administration. It is metabolized via acetyl-CoA in the tricarboxylic acid cycle, resulting in an elevation of the AMP/ATP ratio and subsequent phosphorylation of AMP kinase (AMPK) [2]. Activated AMPK leads to concomitant inhibition of fatty acid synthesis and activation of fatty acid oxidation. Gene expressions of acetyl-CoA carboxylase (ACC), fatty acid synthase (FAS), and the transcription factors sterol regulatory element binding protein (SERBP-1) and peroxisome proliferator-activated receptor γ (PPARγ) are downregulated, whereas gene expressions of acyl-CoA oxidase (ACO), carnitinepalmitoyl transferase-1 (CPT-1), uncoupling protein-2 (UCP-2), and transcription factor PPARα are upregulated through activating AMPK [3]. In fact, Fushimi et al. [4] have reported that the expression levels of lipogenesis-related proteins such as ACC, FAS, and SREBP-1 are reduced in the rat liver due to acetic acid administration. More recently, Kondo et al. [3] investigated the effect of acetic acid on the activation of fatty acid oxidation in mice fed a high-fat diet. They reported that acetic acid upregulates genes involving AMPK-mediated fatty acid oxidation and thermogenic proteins, such as ACO, CPT-1, and UCP-2, in the liver. They also demonstrated the effect of vinegar intake on the reduction of body fat mass in obese subjects [5].
As public interest in the potential health benefits of vinegar has increased over the past few years, many different types of vinegars are being introduced into the market with a range of diverse uses. In Asia, the popularity of vinegar beverages containing various kinds of fruit extracts has been increasing. Fruits are the richest source of phytochemicals, which are capable of performing a number of functions. Recent studies have shown that some fruit phytochemicals such as rutin (rich in citrus fruits), quercetin (rich in lovage and apples), and resveratrol (rich in grapes) are able to increase AMPK phosphorylation and thus reduce lipid accumulation in hepatic cells [6-7]. In addition, cranberry extract administration improved the lipid profile and reduced visceral fat mass mediated by the activation of the adiponectin/AMPK pathway in obese mice [8]. However, all phytochemicals do not necessarily have the same traits. Moreover, it is necessary to figure out a strategy to determine which phytochemicals, in combination with acetic acid, are in fact providing the additive health benefits of fatty acid oxidation.
Based on previous studies mainly focusing on fat oxidation, we investigated whether the combination of phytochemicals and acetic acid in seven fruit vinegar beverages provides an additive effect in a model cell system. Then, we studied the phytochemical composition of fruit vinegars by using liquid chromatography in combination with quadrupole time-of-flight mass spectrometry (LC-QTOF-MS). This combined approach led to the identification of candidate phytochemicals responsible for the additive effect on fat oxidation.
Materials and Methods
Fruit vinegars
Seven kinds of fruit vinegars (Rubuscoreanus, Opuntia, blueberry, cherry, red ginseng, mulberry, and pomegranate) were obtained from Daesang Corp. (Seoul, Korea). Fruit vinegar, the main ingredient of fruit vinegar beverages, was prepared by two stage fermentation. Briefly, each aqueous fruit extract was added after the alcohol fermentation and then acetic acid fermentation was continued. The content of acetic acid in each fruit vinegar was analyzed using high performance liquid chromatography (HPLC, Agilent Technologies 1200, Santa Clara, CA, USA). HPLC separation was achieved using an Aminex HPX-87H column (300 × 7.8 mm i.d., 9 µm particle size; Bio-Rad, Hercules, CA, USA). The mobile phase consisted of 0.05 N sulfuric acid, and the flow rate was 0.5 mL/min. Total acids were detected at 210 nm with a UV detector, and they were quantified as the sum of oxalic acid, citric acid, malic acid, succinic acid, lactic acid, and acetic acid. All organic acid standards were purchased from Sigma-Aldrich Co. (St. Louis, MO, USA). The percentages of total acid, acetic acid, and fruit extract in fruit vinegars are presented in Table 1.
Cell culture
Human hepatocytes (HepG2; ATCC No. HB-8065) were obtained from American Type Culture Collection (Manassas, VA, USA). Cells were grown in high glucose Dulbecco's Modified Eagles Medium (DMEM; Gibco, Grand Island, NY, USA), 10% fetal bovine serum (Gibco), 100,000 U/L penicillin (Gibco), and 100 mg/L streptomycin (Gibco) at 37℃ in a humidified atmosphere with 5% CO2.
For experiment, HepG2 cells were culture in a 6-well plate and serum-starved for 24 h and subsequently cultured in serum-free DMEM containing fruit vinegars for an additional 3 h. Sterile filtered fruit vinegars were added to each well at concentrations from 0.25 to 5 mM as acetic acid, and their viability was measured by the tetrazolium dye (MTT) based assay. While cell viability was reduced to 82 and 60% at 2.5 mM and 5 mM, respectively, no significant toxic effect as well as no changes in pH were observed at concentration less than 1 mM (data not shown) regardless of the kinds of fruit vinegars treated; hence, all studies were performed at acetic acid concentrations less than 1 mM. Acetic acid-free DMEM was used as the control.
RNA preparation
RNA was then extracted using TRIzol (Invitrogen, Carlsbad, CA, USA) as directed by the manufacturer's instructions. RNA was treated with DNase I (Quagen, Crawley, UK) to avoid DNA contamination. The quality and purity of total total RNA was measured by a BioSpec-nano (Shimadzu Corp., Kyoto, Japan). cDNA was constructed using high capacity RNA with a cDNA kit (Applied Biosystems, Foster City, CA, USA).
Quantitative Taqman Reverse Transcription-Polymerase Reaction (RT-PCR)
PCR was performed with a Step-One-Plus RT-PCR System (Applied Biosystems) in 96-well microtiter plates using a final volume of 20 µL. Optimum reaction conditions were obtained with 10 µL of Universal Master Mix (Applied Biosystems) containing dNTPs, MgCl2, reaction buffer, AmpliTaq Gold, and fluorescence-labeled Taqman probe. Template cDNA (2 µg) was added to the reaction mixture. Amplifications were performed starting with a 10 min template denaturation step at 95℃, followed by 40 cycles at 95℃ for 15 s and holding at 60℃ hold for 1 min. The primer sets used targeted the following human genes: PPARα [PPARα;Hs00231882_m1], ACO [ACOX1; Hs00244515_m1], CPT-1 [CPT1A; Hs00157079_m1], UCP-2 [UCP2; Hs00163349_m1], and β-actin [ACTB; Hs99999903_m1]. The relative amounts of the target mRNAs were normalized to the amount of β-actin, and the relative amounts of all RNAs were calculated using the comparative CT method. All data were expressed relative to each control value.
HPLC-MS analysis
An Agilent 1200 Series HPLC system with a photo diode array (PDA) detector was coupled with an Agilent 6530 quadrupole time-of flight (Q-TOF) mass spectrometer (MS) (Agilent Technologies, Santa Clara, CA, USA). The chromatographic separation was carried out on a reversed-phase C18 Halo column (2.1 mm × 100 mm, 2.7 µm; HiChrom, Berkshire, UK). The mobile phase consisted of 0.1% formic acid in water (solvent A) and 0.1% formic acid in acetonitrile (solvent B) using a gradient program of 0-30% solvent B from 0 to 8 min, 30-85% solvent B from 8 to 16 min, 85-100% solvent B from 16 to 20 min, and then holding at 100% solvent B for 5 min. The flow rate was 0.6 mL/min, the column temperature was set to 40℃. The retention times were compared to each other to identify the unique components in each vinegar beverage. MS parameters were as follows: positive and negative electrospray-ionization (ESI); desolvation temperature, 350℃; nitrogen gas nebulizer pressure, 45 psi; scan range from 50 to 200 m/z.
For the chemical comparison, samples were filtered through a syringe filter (0.20 µm) (Whatman, Kent, UK) prior to LC-MS analysis. Aliquots (5 µL) of sample solutions were analyzed, and the data were acquired using MassHunter Acquisition B.03.01 with Service Pack 3 for Agilent TOF and QTOF and MassHunter Qualitative Analysis B.03.01. Peak identities were obtained by matching their molecular ions (M+) obtained by ES/MS with the expected theoretical molecular weight from literature data at m/z total/aglycon.
Statistical analysis
All in vitro results represent mean values ± SD of three replicates. Statistical analyses were conducted using SAS 9.2 (SAS Institute, Cary, NY, USA). The differences among treated groups were analyzed by one-way analysis of variance (ANOVA) followed by Dunnett's multiple-comparison test (α = 0.05).
Results
Comparison of fruit vinegars on the expression of PPARα, CPT-1, ACO, and UCP-2 in HepG2 cells
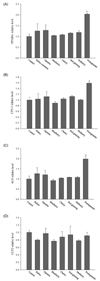
Seven fruit vinegars (Rubuscoreanus, Opuntia, blueberry, cherry, red ginseng, mulberry, and pomegranate) were compared for their fat oxidation activities in terms of the expression levels of PPARα and its downstream genes in HepG2 cells. RT-PCR analysis demonstrated that mRNA levels increased for PPARα, CPT-1 and ACO with the addition of 1 mM Robuscoreanus, cactus and pomegranate vinegar. However, there were no differences in UCP-2 mRNA levels. Among different fruit vinegars, pomegranate vinegar (PV) treatment caused a significantly higher level of expression in PPARα, CPT-1 and ACO than the others (Fig. 1).
Combined effects of acetic acid and phytochemicals in PV on changes of mRNA levels related to fatty acid oxidation in HepG2 cells
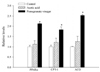
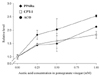
The upregulation of PPARα, CPT-1, and ACO expression caused by PV was further investigated to evaluate if there was an additive effect between PV phytochemicals and acetic acid. As shown in Fig. 2, the mRNA levels of PPARα, CPT-1, and ACO were increased significantly when HepG2 cells were treated with PV, compared with acetic acid alone and control group (P = 0.001, 0.028, and 0.001, respectively), indicating the possibility of additive effects. Furthermore, we observed dose-dependent changes for PPARα, CPT-1, and ACO mRNA expression levels with treatment of PV containing 0.25 to 1 mM acetic acid. At the maximum concentration tested, mRNA levels were increased by 1.7-2.5-fold compared to the control (Fig. 3).
Comparison of the chemical profiles by LC-qTOF MS
For identification purposes, phytochemicals from seven fruit vinegars were separated by reversed-phase HPLC, followed by high-resolution mass spectrometry (qTOF-MS). The best separation was observed with a reversed-phase C18 Halo column using gradient elution over 25 min at a flow rate of 0.6 mL/min. The optimum column temperature was determined to be 40℃. Acetonitrile was preferred over methanol as the mobile phase, and formic acid was added to the mobile phase for improved separation. Peak resolution and peak purity were continuously monitored by MS detector.
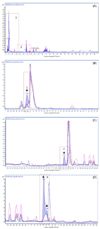
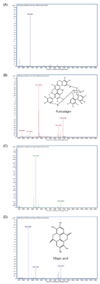
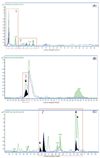
Fig. 4 (A) shows the overall phytochemical profiles from seven fruit vinegars by overlaying their representative HPLC chromatograms. The chromatogram of PV was first compared with the others based on retention time; it detected four exclusive peaks at retention times of 0.869, 5.527, 7.509, and 7.608 min in the chromatogram of PV (indicated by arrow, Fig. 4 (B)-(D)). Then, the accurate m/z measurements of the QTOF-MS allowed us to predict the molecular formulas of the detected phytochemicals; the corresponding masses (m/z) were 353, 1,083, 475, and 301, respectively. Furthermore, a search of these molecular weights in a database of known phytochemicals revealed that punicalagin B corresponded to the masses 1,083 m/z for M-H and 541 m/z for 2M-H, and ellagic acid corresponded to the mass 301 m/z for M-H. However, the other two components with masses of 353 m/z for M-H and 475 m/z for M-H could not be identified, due to the limited database (Fig. 5). Next, to confirm if these four peaks in PV were from the pomegranate extract, we compared the HPLC chromatograms of PV (blue) and pomegranate extract (green) (Fig. 6 (A)). Four peaks, including punicalagin B and ellagic acid, were identified both in PV and in pomegranate extract (indicated by arrow in Fig. 6 (B) and (C)).
Discussion
In this study, we investigated whether the combination of phytochemicals and acetic acid in the form of fruit vinegar provides an additive effect on the stimulation mRNA levels related to fatty acid oxidation in human hepatocyte (HepG2). PPARα is mainly expressed in the liver and regulates the utilization of fat as an energy source, and its genes are involved in the control of lipid metabolism [9]. CPT-1 and ACO are PPAR α-induced enzymes that are involved in free fatty acid oxidation in the mitochondria and peroxisome, respectively, and play important roles in hepatic lipid metabolism [10-11]. UCP-2 is a mitochondrial carrier that regulates thermogenesis and energy expenditure [12]. The effect of acetic acid on fatty acid oxidation in HepG2 cells was previously reported by Kondo et al. [3]. They found that PPARα, ACO, CPT-1, and UCP-2 mRNA levels significantly increased 3 h after the addition of 0.5 mM acetic acid to HepG2 cells. In this study, we also observed a significant increase in mRNA levels for PPARα, CPT-1, and ACO with the addition of PV to HepG2 cells compared to controls (P = 0.002, 0.049, and 0.013, respectively), although no difference in UCP-2 mRNA levels was observed. Taken together, these results suggested that there might be interactive effects between acetic acid and pomegranate phytochemicals on the activation of changes of mRNA levels related to fatty acid oxidation via different molecular mechanisms.
In order to identify possible active compounds in PV, we analyzed phytochemical profiles using HPLC followed by qTOF-MS. We searched four possible active compounds contained in PV only and confirmed that these compounds were originated from pomegranate extract (Fig. 4 and 6). We identified two of four compounds were as punicalagin B and ellagic acid, respectively (Fig. 5). Pomegranate (Punicagranatum L.) fruits are widely consumed fresh and in beverage forms [13]. Accumulating evidence has suggested that commercial pomegranate juice shows potent antioxidant and anti-atherosclerotic activities, which are attributed to its polyphenols including punicalagin and ellagic acid [14]. Herbal plant extracts containing ellagic acid alleviated obesity [15-16]. Particularly, pomegranate extract as well as ellagic acid suppressed resistin secretion in white adipose tissue and murine 3T3-L1 cell line [17]. However, there is little information regarding the effect of these phytochemicals on fatty acid oxidation in the liver. Punicalagin is an ellagitannin in which gallagic and ellagic acids are linked to a glucose molecule, giving a molecular weight greater than 1,000 (Fig. 5 (B)), and it is the most abundant polyphenol in pomegranate [18-19]. Ingested punicalagin is absorbed and detected in plasma as the full molecule or as its metabolites [20]. Ellagic acid is a dimeric derivative of gallic acid (Fig. 5 (D)) and occurs in fruits in either its free form or bound as an ellagitannin [21]. Following oral administration of ellagic acid in rats, free ellagic acid was found in plasma, although the concentration was low [14]. This information implied that phytochemicals from pomegranate fruit in combination with vinegar exert additive effects for fatty acid oxidation in the liver. Although, we could not figure out exact active compounds profiles, these chemicals including punicalagin B and ellagic acid might be the active compounds only in PV.
This is the first report, to the best of our knowledge, to demonstrate that the combination of acetic acid and pomegranate phytochemicals in the form of a vinegar beverage may have additive effects on the changes of mRNA levels related to fatty acid oxidation in HepG2 cells. Furthermore, by comparing the chemical profiles of PV with other fruit vinegars and pomegranate fruit extract, we also identified punicalagin B and ellagic acid as potentialactive compounds. Our in vitro findings provide important experimental evidence to understand the mechanism by which acetic acid and the phytochemicals in PV beverage may have potentiating effects on body fat reduction in vivo in an additive manner via upregulating PPARα, CPT-1 and ACO. Despite important implications of this study, it has some limitations worth noting. First, it is a preliminary assay to select the most potent vinegar beverage for fatty acid oxidation through the related gene expressions rather than the direct fatty acid oxidation. Second, the direct effects of punicalagin B and/or ellagic acid on the altered gene expression of PPARα, CPT-1, and ACO in HepG2 cells were not investigated. Further study is warranted to investigate the application of PV beverage for improving obesity in animals and human subjects.

 XML Download