

 PDF
PDF ePub
ePub Citation
 Print
Print


Introduction
Angelica keiskei Koidz (AK) was introduced from Japan in the 1970s as "sinsuncho" and has been widely cultivated as a green vegetable juice ingredient [1,2]. AK reduces the risk of developing chronic diseases such as hypertension [3]. In fact, the American Cancer Society and the American Heart Association recommend increased intake of plant-derived foods to prevent such diseases [4]. Although it is unclear which plant food ingredients contribute to the prevention of chronic diseases, flavonoids have been suggested to perform this role. In particular, AK contains flavonoid-type biologically active substances such as luteolin-7-glucoside, isoquercitrin, and chalcone derivatives such as furocoumarines and angelicin [1,2,5]. Flavonoids are polyphenol compounds with a characteristic diphenylpropane structure and include various plant secondary metabolites that are commonly found in fruits and vegetables [6,7]. Such flavonoids have anti-oxidation, anti-inflammation, and anti-cancer roles and act as immunity enhancers [8,9].
Luteolin is one of most abundant flavonoids in edible plants [10]. Luteolin is present in most plant foods not only as a free form but also as a glycoside. Luteolin is found in more than 300 plant species at present. Among them are vegetables such as carrots, peppers, celery, perilla leaves, and cucumber [10].
Luteolin has various biological activities for the prevention and treatment of chronic diseases [11-13]. Luteolin has antioxidant, anti-inflammatory, antimicrobial, cancer chemopreventive, cancer chemotherapeutic, and cardioprotective activities [4,6,7,9,11-15]. Some studies have focused on other factors (mineral or fatty acid) rather than luteolin for the effects of luteolin-containing foods. However, studies on the physiological activities of AK by several processing methods including juice and squeezed remnants have not been performed. Additionally, studies on the content or health improvement effects of luteolin in AK have been insufficient. This study was performed to investigate the physiological activities of AK, AK juice, AK squeeze (remnants of AK after squeezing the juice), and fermented juice in rats fed a high fat diet (EXP 1). The health improvement effects of the AK processed products have been poorly investigated. Thus, experiment (EXP) 2 was performed to compare the effects of whole AK with those of mixing a sample of AK juice and squeeze with the same portion of whole AK, because it is unclear whether mixing the sample has synergistic effects or not.
Materials and Methods
Experiments were conducted twice to investigate the biological effects of consuming AK and AK juice in rats fed a high fat diet. In EXP 1, the intake effects of AK whole leaves (AK), juice (ES), fermented juice (FS), and squeezed AK (SA) were examined, whereas the intake effect of AK and the combined effect of FS + SA were examined in EXP 2.
Animals and experimental diets
Seven-week-old male Sprague-Dawley rats (average weight, 250 g) were used. Rats were housed individually in acrylic cages (Daejong Co., Seoul, Korea) and cared for regularly every day. Lights in the animal room were artificially controlled (12 hours/day), and the temperature was maintained at 22 ± 2℃. The animals had free access to water and feed.
AK and the processed products used in the experiments were provided by Pulmuone. AK was obtained from a local cultivator in Gyeonggido, Korea and then moved to the Pulmuone Juice Factory for juice production. All samples were vacuum freeze dried and ground with a pin mill down to 100 mesh size and then stored at -70℃ until use. The moisture of the samples was maintained by air drying for 6-9 hours to prevent moisture changes in the raw ingredients before mixing.
After a 7-day adaptation period, the rats were divided into six groups of control diet, high fat (HF) diet and HF + AK additives (4 groups) in EXP 1 and the HF, HF + AK whole leaves, and HF + FS + SA groups in EXP 2. Eight rats were assigned per group, and the experimental period was 6 weeks. The compositions of the experimental diets are listed in Table 1. All experimental diets were prepared with identical calorie and protein contents. Body weight and food intake were measured every week. All animal experiments observed the NIH guidelines described in "Principles of Laboratory Animal Care" [16] and the protocols for animal care were approved by the Institutional Animal Care and Use Committee of Korea Food Research Institute, Gyeonggido, Korea.
Sampling procedures
At the end of each experiment, rats were fasted for 12 hours and anesthetized with diethyl ether. Blood samples were collected by cardiac puncture and the liver, kidney, testes, and spleen were dissected and rinsed with saline, blotted on filter paper, and weighed, respectively. A part of the liver was cut (3 × 3 × 3 mm) and immediately frozen in liquid nitrogen for use in the gene expression analysis. Epididymal fat and the rear fat pad were weighed in the same manner. All tissues were stored at -70℃ in a freezer until analysis.
Serum analysis procedures
Serum total cholesterol (TC), high density lipoprotein-cholesterol (HDL-C), and free fatty acids were analyzed with a Kobas Mira (Roche Co., Indianapolis, IN, USA) automatic chemistry analyzer. Low density lipoprotein-cholesterol (LDL-C) was calculated by a formula, LDL-C = TC-[(HDL-C-TG)/2] [17].
Blood luteolin content was analyzed using high performance liquid chromatography (HPLC) [18-20]. Briefly, 200 µL of plasma was placed in a 2 mL micro tube and 390 µL of 0.17 M ammonium acetate buffer solution (pH 4.6) and 10 µL of β-glucuronidase (Sigma Co., St. Louis, MO, USA) were added, and the mixture was placed in a water bath at 37℃ for 12 hours to react. Then, it was diluted with buffer solution and was vortexed after adding 1 mL of ethyl acetate followed by centrifugation at 12,000 rpm for 10 minutes, and the supernatant was collected. This step was repeated three times and the collected solution was evaporated with N2 gas, dissolved in 200 µL mobile phase, and analyzed by HPLC equipped with an electrochemical detector (Waters 460, Milford, MA, USA). The solvent was a mixture of MeOH/0.1 M ammonium acetate (pH 2.5)/5 mM EDTA (= 50/50/10) and the flow rate was 1 mL/min.
Liver lipid analysis
Liver lipids were extracted using chloroform and methanol (= 2:1; v/v) [21]. A part of the extract was used for measuring total lipid content and the remaining part was used for cholesterol analysis. Cholesterol was analyzed using an enzymatic kit (Wako Chemical Co., Osaka, Japan).
Quantitative real time reverse transcription polymerase chain reaction (RT-PCR)
The gene expression levels of antioxidant enzymes in the liver, such as superoxide dismutase (SOD), glutathione reductase (GsR), glutathione peroxidase (GPx), glutathione transferase (GT) and catalase were analyzed using real time RT-PCR. Total RNA was separated with TRIzol reagent (Invitrogen Co., Carlsbad, CA, USA) and the quantity of RNA was measured with a spectrophotometer. cDNA was obtained using 5 µg total RNA, random primer (Invitrogen) and RT-premix (Bioneer, Seoul, Korea). The ABI 7700 System (Applied Biosystems, Foster City, CA, USA) was used with the SYBR Green PCR Master Mix, Applied Biosystems) including SYBR green (Molecular Probes, Eugene, OR, USA). The primer sequences were 5'-CTCGTCTCCTTG CTTTTTGC-3' and 5'-AAAATGAGGTCCTGCAGTGG-3' for SOD (Z24721), 5'-CAACATCCCTACCGTGGTCT-3' and 5'-CATTTCGTCTTCCTCGTGGT-3' for glutathione reductase (NM 053906), 5'-GCTGCTCATTGAGAATGTCG-3' and 5'-GCCT TCTCACCATTCACCTC-3' for glutathione peroxidase (NM 030826), 5'-CCACATTTTTGAGCCCAAGT-3' and 5'-TGAGT GCCAGTGTAGCAAGG-3' for glutathione transferase (M28241), and 5'-ACATGGTCTGGGACTTCTGG-3' and 5'-CAAGTTTTT GATGCCCTGGT-3' for catalase (NM012520) left and right sequences, respectively. A melting curve analysis and gel electrophoresis was performed to prevent the generation of nonspecific amplicons. No mispriming was found. The 2-ΔΔCt formula was used to determine differences in gene expression [22].
Results
Nutrient content analysis of AK and its processed products
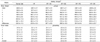
The general composition, minerals, and luteolin content of AK and its processed products are shown in Table 2. Crude fiber content was significantly different among the samples. Crude fiber content was the highest in SA, whereas that of AK juice, ES, and FS were very low at about 0.5% (Table 2). The raw AK material and the mixed sample of ES + SA showed similar results. The Ca level (1.19-2.14%) was higher than the P level (0.21-0.42%), in all samples, suggesting that AK and its processed products are alkaline foods. Ge content was 12-26 mg/kg and the luteolin content of AK and its processed products was 211-257 µg/g.
The amino acid composition of AK showed a typical plant protein amino acid composition. Unlike animal proteins, it had low glutamic acid content but high arginine, alanine, valine, isoleucine, and leucine content.
Effects of AK and its processed products in rats fed a high fat diet (EXP 1 and 2)
The results for AK and its processed products added to the HF diet are shown in Tables 3 and 4 (EXP 1). Additionally, the results for the mixed group of juice and AK squeeze debris added to HF (ES + SA) are listed in Tables 5 and 6 (EXP 2).
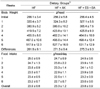
Weekly body weight and the food intake were not different among the experimental groups in EXP 1 (Table 3). The weight of organs at the end of experiment is shown in Table 4. Liver and kidney weights were highest in the HF group (P < 0.05). The weights of the epididymal fat and the rear fat pad were significantly higher in the HF group (P < 0.05) and epididymal fat was the lowest in the SA group with added AK squeeze, whereas the rear fat pad was the lowest in the FS group (P < 0.05, Table 4).
Body weight and the food intake in the HF group were not different even after providing AK and ES + SA (EXP 2, Table 5). The weights of the liver, kidneys, epididymal fat, and rear fat pad decreased in the AK and ES + SA groups compared to those in the HF group (P < 0.05, Table 6).
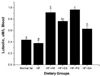
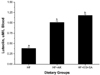
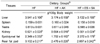
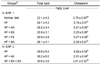
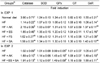
The analysis of blood lipids in EXP 1 and 2 is shown in Table 7. Fat content in the diet greatly affected the blood lipid profiles in EXP 1. Serum LDL-cholesterol and free fatty acids were higher in the HF group compared to those in the normal diet group (P < 0.05). The AK group and the processed products groups were not different from the HF group. These results were similar to those of EXP 2. Serum luteolin content in EXPs 1 and 2 is shown in Figs. 1 and 2. The AK and its processed products groups showed significantly higher luteolin content by 55-120% compared to that in the HF group (Figs. 1 and 2, P < 0.05).
Total lipids and cholesterol content in the liver of rats fed AK and its processed products in EXP 1 and 2 are shown in Table 8. Total lipids were not different among treatments, but cholesterol content was lower in the AK and processed products groups compared to those in the HF group in both experiments (P < 0.05).
Antioxidant enzyme gene expression in the liver of rats fed AK and its processed products
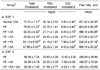
The results of real time RT-PCR for measuring enzyme gene expression such as catalase, SOD, GPx, GT, and GsR are shown in Table 9. Gene expression levels in the HF group were used as a reference for the control group. In EXP 1, catalase had 37-90% higher mRNA content in the AK and processed products groups compared to that in the HF group (P < 0.05). GsR had 35% higher mRNA content in the HF + SA group compared to that in the HF group. Catalase, GPx, and GsR genes showed higher mRNA content in the HF + AK and the HF + ES + SA groups in EXP 2 compared to that in the HF group (P < 0.05).
Discussion
This study was performed to examine the effects consuming AK and its processed products on serum, liver, and body fat contents, serum luteolin content, and the expression of antioxidant genes in rats fed a HF diet. Flavonoids, such as luteolin, are polyphenol compounds with a characteristic diphenylpropane structure and are known as various plant secondary metabolites commonly found in fruits and vegetables [6,7].
The high fat diet was composed of 20% fat in this study, but all experimental diets were designed to have identical protein and energy contents. Thus, the diet intakes in the experimental animals were similar in all experimental groups (Tables 3 and 5). The changes in body weight in the rats were not different among the groups in EXP 1. Body weights did not change among the groups in EXP 2. These results indicate that dried AK, ES, FS, and SA are foods without anti-nutritional effects even with excessive intake > 20 times the normal amount.
Liver and kidney weights in EXP 1 tended to be lower in the AK and processed products groups compared to those in the HF and normal diet group (P > 0.05, Table 4). Lower liver weight is considered better under a fat accumulating environment. These results indicate that these compounds prevented lipid accumulation in the liver. Kidney weight was lower in the AK and processed products treatments than that in the HF group. AK intake reduced the increased kidney weight due to fat accumulation by the HF diet. Organ weights in EXP 2 were similar to those in EXP 1 (Table 6).
Epididymal fat is very important as a value representing body fat content in rats. Epididymal fat content was not different among the AK, ES, FS, and HF groups but was very low in the SA group compared to that in the HF group (Table 4). The intraperitoneal rear fat pad was smaller in both the FS and SA groups than that in the HF group (P < 0.05). Thus, FS and SA had effects on reducing body fat content. In particular, FS showed that a higher functional effect of green juice is possible by fermentation. It was assumed that such a result was observed because a substance that inhibits fat accumulation was activated during the fermentation process of green juice. These results can be used as a reference to establish the direction for developing products using AK juice and AK squeeze in the future. Epididymal fat was slightly lower in the AK group in EXP 2 than that in the other groups. The intraperitoneal rear fat pad was also slightly smaller in the AK group compared to that in the other treatment groups (P < 0.05, Table 6).
The results of serum lipids in the EXP 1 and 2 treatment groups are shown in Table 7. Serum cholesterol was slightly improved by AK intake, and free fatty acid content showed a similar pattern.
Serum luteolin concentration in EXP 1 and 2 are shown in Figs. 1 and 2, respectively. Serum luteolin was generally higher in the AK and its processed products groups than that in the control and HF groups (P > 0.05). The highest content was found in the FS and AK groups and then in the order of the ES and SA groups. Thus, continuous intake of AK caused increased absorption of luteolin and increased serum concentrations. Additionally, serum luteolin was significantly higher in the AK groups than that in the HF group in EXP 2 (P < 0.05, Fig. 2). This result was the same as that in EXP 1.
Total lipid and cholesterol contents in livers of the experimental groups are shown in Table 8. Liver lipid content was not different among the experimental groups. However, liver cholesterol content in rats fed AK and its processed products was lower than that in the HF group (P < 0.05). The liver cholesterol content in the HF group was 13% higher compared to that in the normal diet group. Cholesterol content in the livers of the AK group was similar to that in the normal diet group. Thus, AK and its processed products suppressed cholesterol accumulation in the liver following the intake of a HF diet. But, it was assumed that the effect of suppressing cholesterol accumulation in the liver is similar among AK products regardless of processing method because there was no difference in hepatic cholesterol content by processed products. These results suggest that the most important direction for AK juice related studies in the future is to identify the inhibitory effect of cholesterol accumulation in the liver. It is not possible to assume based on the results of this study whether cholesterol in the liver was suppressed by inhibited cholesterol biosynthesis or by inhibited hepatic cholesterol transport in the blood, but these two possibilities resulted in a reduction of cholesterol.
Rats are under oxidative stress by lipid peroxidation when fats accumulate in the liver. Thus, we measured the gene expression and activity of enzymes involved in the antioxidant system to confirm the antioxidant effect of the AK products. mRNA content of SOD, catalase, GPx, GT, and GsR was measured, and the results are shown in Table 9. The HF group was the reference (1.00). Gene expression of catalase, GPx, and GsR increased by 15-100% in the livers of the AK, ES, FS, and SA groups. Similar results were observed in EXP 2, and antioxidant enzyme gene expression was significantly higher in the AK and ES + SA groups compared to that in the HF group (P < 0.05) but ES + SA did not show a synergistic effect compared to that in the AK groups.
These results show that the intake of AK and related products actively induced the expression of antioxidant enzymes to eliminate reactive oxygen species in the liver. There may be slightly different views in the interpretation of gene expression, but it is considered beneficial if there is increased gene expression. The increase in antioxidant enzyme gene expression increases antioxidant enzyme activity. It was confirmed that the intake of AK juice increased both catalase and GPx, which are important antioxidative enzymes. In particular, considering that catalase is an important extracellular antioxidant enzyme and that GPx is an important intracellular antioxidant enzyme, increase in these enzymes can improve antioxidant effects both inside and outside of the liver. GsR is an important enzyme that reduces oxidized glutathione and regulates the glutathione peroxidase enzyme system in the cell. Increased gene expression of this enzyme increases the general metabolic rate of the enzyme system. GsR is an enzyme that regulates the overall rate of the glutathione peroxidase enzyme system.
In conclusion, our results suggest that consuming AK and its processed products increased the expression of antioxidant enzymes in animals fed a HF diet, reduced hepatic cholesterol content, and increased absorption of luteolin.

 XML Download