

 PDF
PDF ePub
ePub Citation
 Print
Print


Introduction
The health benefits of resistant starch (RS) are currently gaining attention. A recent study reported that high intake of RS increases fatty acid oxidation in the liver and, thus, prevents high fat induced obesity [1]. RS also provides fewer calories (3 kcal/gram) than most digestible carbohydrates (4 kcal/gram), which is important to individuals who are dieting [2]. In addition, RS provides other physiological functions such as lowered cholesterol levels, decreased blood glucose level, and positive colonic effects [2,3].
Many studies regarding RS and its physiological functions have been conducted with corn starch [1-3], but only a limited number of studies have evaluated the physiological functions of RS from rice. A previous study showed that rice RS produces similar improved bowel function and plasma lipid profiles as those of corn starch [4]. It is believed that more RS3 is produced as the degree of retrogradation increases. An increase in food RS content can be achieved by modifying the processing conditions such as pH, heating temperature and time, number of heating and cooling cycles, freezing, and drying [5]. Methods that enhance starch retrogadation such as cooking and cooling cycles have been used to obtain higher RS levels [6,7].
Rice contains many essential nutrients such as carbohydrates, protein, vitamin B complex, and minerals [8], but rice has small percentage of RS, 0-12% with high percentage of digestible starch; thus, rice is known as a relatively high glycemic index food compared with other cereals [9]. Rice with a higher content of RS is desirable for people who consume rice 2-3 times a day, and for people who are diabetic- or weight-problems. Therefore, the purpose of this study was to determine the amount of RS in retrograded rice after three cycles of heating and cooling and to determine the physiological functions of retrograded rice in rats.
Materials and Methods
Preparation of retrograded rice
Retrograded rice was processed as described previously with some modifications [7]. Ten cups of rice were rinsed with water three times and left for 30 min at room temperature. The same amount of water was added to the prewashed rice and placed in a preheated steam convection oven (6×1/1GN, Richonal, Korea) at 160℃ for 41 min. (cooking conditions: temperature, 140℃; humidity, 80%). Immediately after the rice was cooked, the mixture was quickly cooled to 4℃ in a blast chiller (Irinox, Conegliano, Italy) and stored at 4℃ for 24 h in an incubator (Hanbak Science, Seoul, Korea). After three heating and cooling cycles, the sample was dried for 24 h in a steam convection oven (conditions: temperature, 40℃; humidity, 0%), and the rice was ground into fine particles using a mixer (NFM-8860, NUC, Korea). The ground rice was filtered with 50 mesh filter paper and used as samples.
Determination of RS content
The concentration of RS was determined by AOAC methods [10,11]. Sample (1 g) was mixed with 40 ml of 0.2% Mes-Tris buffer (pH 8.0) and stirred on a vortex mixer. The sample was incubated in a boiling water bath for 15 min with thermostable-amylase (stirred the tube vigorously after 2, 4, and 6 min). The mixture was then cooled to room temperature. Protease was added to the mixture and incubated for 30 min. The pH was then adjusted to 4.3 with 0.561 N HCl. After the appropriate pH was obtained, amyloglucosidase was added and incubated at 60℃ for 30 min. Then, 80% ethanol was added to precipitate the starch, and the sample was left at room temperature to allow complete precipitation. Ethyl alcohol was then added, followed by acetone. The sample was centrifuged at 1,500 rpm for 5 min, the supernatant was discarded, and the residue was air dried at room temperature and weighed.
As a result, the percentage of RS in the retrograded rice was significantly higher (13.9 ± 0.98%) than that in the common rice powder (9.1 ± 1.02%) (P < 0.05).
Animals and diets
Four week old male Sprague-Dawley (Central Lab. Animal Inc., Korea) rats were maintained on a conventional diet for 1 week and then divided into two groups of 10 rats per group using a randomized block design according to weight. Rats were maintained individually in cages with wire-mesh bottoms in conditioned rooms (temperature, 23℃; relative humidity, 55%). All animal studies were conducted in accordance with the Dankook University ethics committee guidelines for the care and use of laboratory animals.
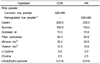
All rats were provided with food and water ad libitum and maintained on each diet for 5 weeks. The diet was a modified AIN-93G diet [12] (Table 1). The experimental group was fed retrograded rice powder (RR), which contained a higher RS content when compared to that of common rice powder. Both the control (CON) and experimental groups (RR) were fed the same diet except for the carbohydrate composition.
Plasma collection and organ preparation
Rats were anesthetized with ethyl ether and dissected. Blood was collected from the heart with a heparinized syringe. Blood plasma was collected by centrifugation at 4,000 × g for 30 min after allowing the blood to settle for 30 min at 4℃. The plasma was stored at -70℃. The liver, kidneys, thymus, spleen, and epididymal fat pads were removed, and their wet weights were measured. The lengths of the small and large intestines were measured. The cecum was removed from the large intestine, washed with saline, and weighed with or without contents. Livers were stored at -70℃ for lipid analysis.
Fecal weights, moisture contents, transit time, and pH in colon contents
Stool samples were individually collected twice over 24 h, weighed as wet weight, and stored at -20℃ within 8 h of defecation. Collected stools were completely dried by heating at 105℃, and the moisture content was calculated by subtracting wet weight from dry weight. The intestinal transit time measurement was carried out 2 weeks after the rats were first fed the experimental diets. The rats were fasted for 15 h, and then fed 10 g of an Indigo Carmine containing diet (0.5% in an equal mixture of diet and sugar) for 4 h. Then, the rats were fed a regular diet. The feces were checked every 20 min for appearance of the dye. The interval between the beginning of diet consumption and the first appearance of colored feces was determined as intestinal transit time [13]. Colon contents were diluted by a factor of 10 with distilled water, and the pH was measuring using a pH meter.
Lipid measurements in plasma, liver, feces, and adipose tissue
Plasma total lipids were determined as described by Frings and Dunn [14], with slight modifications. Plasma total cholesterol and triacylglycerol were measured enzymatically using a commercial kit (Asan Pharmaceutical Co., Seoul, Korea). Adipose tissue was collected from various sites such as epididymal fat, kidney fat, and abdominal fat. Total lipids in the liver, feces, and adipose tissue were extracted with chloroform: methanol (2:1, v/v) using a modified method described by Folch et al. [15]. After extraction, total lipid, triaclyglycerols, and cholesterol were measured with the same methods used to determine plasma lipids.
Statistical analysis
The statistical analysis was performed using Statistical Analysis System (SAS Institute, Cary, NC, USA. Data are expressed as mean with standard error, and statistically significant differences between group means were evaluated using Student's t-test. A P-value < 0.05 was considered significant.
Results
Body weight gain, food intake, and organ weights
Initial body weight in both groups was similar, but the final body weight of the retrograded rice group (350.6 ± 9.1 g) was significantly lower than that of the common rice group (382.8 ± 6.5 g) (P < 0.05, Table 2). Mean food intake in both groups was similar. The food efficiency ratio (FER) was significantly lower in the retrograded rice group (0.469 ± 0.005) than that in the common rice group (0.504 ± 0.004, P < 0.05).
Liver weights in the retrograded rice group (14.5 ± 0.5 g) were significantly lower than those in the common rice group (17.1 ± 0.3 g, P < 0.05, Table 3). However, no significant differences in the weights of other organs, such as the kidneys, spleen, thymus, or epididymal fat were observed between the two groups.
Gut functions, intestine length, transit time, and fecal weight
The retrograded rice diet tended to decrease intestinal transit time relative to that of the common rice diet, but the difference was not significant (731 ± 20.0 min vs. 777.5 ± 52.9 min, Table 4). The length of the small and large intestines was not affected by either the common rice diet or the retrograded rice diet. The retrograded rice diet significantly increased stool output when compared to that of the common rice diet (4.9 ± 0.2 g vs. 4.2 ± 0.1 g, P < 0.05, Table 5). Fecal moisture content was significantly higher in the retrograded rice group than that in the common rice group (23.3 ± 1.2% vs. 19.1 ± 1.2%, P < 0.05). The pH of the cecal contents in the retrograded rice group tended to be lower than that in the common rice group, but the difference was not significant.
Lipid concentrations in plasma, liver, feces, and adipose tissue
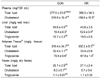
The effects of retrograded rice on lipid concentrations in plasma and various organs are shown in Table 6. The retrograded rice diet significantly decreased plasma cholesterol content when compared to that of the common rice powder diet (216.6 ± 11.3 mg/100 mL vs. 169.6 ± 10.5 mg/100 mL, P < 0.05), and the same trend was observed for cholesterol content in the liver (216.6 ± 11.3 mg/g vs. 169.6 ± 10.5 mg/g P < 0.05). Additionally, no significant decrease in triaclyglycerol concentrations in adipose tissue (79.5 ± 5.6 mg/g) was observed for rats fed the retrograded rice diet (67.8 ± 1.4 mg/g, P < 0.05)
Discussion
Rice is the main staple food particularly in Asia countries. However, the high intake of rice is becoming more of a concern for people with obesity and diabetes due to its higher percentage of digestible starch and lower RS, causing a relatively higher glycemic response [9,16]. The content of RS in cooked rice varies depending on the sample preparation and method used for the analysis [17]. RS content in rice cooked in the southern U.S. is 9-10% [18], whereas another study that used a traditional cooking method reported RS content < 3% [16].
RS formation is dependent on the amylose content in starch; thus, RS3 is called retrograded amylose [17]. RS content in foods can be increased by modifying the processing conditions such as temperature, number of heating and cooling cycles, and water content [19]. When the effect of multiple heating/cooling treatments on RS content of cereals was studied, the mean RS content of freshly cooked cereals increased from 1.86% to 3.25% after three heating/cooling cycles (P < 0.05) [20]. In this study, three heating and cooling cycles were used to increase the amount of RS in rice. Using this approach, the amount of RS increased significantly when compared to the control (13.9 ± 0.98% for retrograded rice vs. 9.1 ± 1.02% for common rice (P < 0.05).
One of the interesting findings of this study was that rats fed retrograded rice had a significantly lower body weight gain throughout the experimental period and showed a lower FER when compared to those in rats fed the common rice powder. These results are in agreement with other studies suggesting that high RS intake has a positive impact on obesity [21-23]. In this study, weight reduction with retrograded rice seemed to be related with increased stool output and fecal moisture content (Table 4) as well as decreased triglycerides in adipose tissue (Table 6). The increase of RS in retrograded rice makes indigestible products in the small intestine to excrete as feces [24]. An increase in fecal bulk is important to prevent constipation and to lower body weight [25].
If insufficient carbohydrate is available to the body, the liver will use fat as energy fuel, which will decrease the chances of fat being stored as body fat and thus decrease body weight. It has also been proposed that eating high amounts of RS may increase the mobilization and use of fat-stores by increasing fat oxidation in the liver due to the insulin reaction [26,27]. In a rat study, Higgins [27] hypothesized that a high RS diet may reduce the initial increase in glucose and lipogenesis; thus, decreasing weight gain during the initial experimental period.
Another mechanism for the weight loss observed after high RS intake is the satiety action of RS [28,29]; however, the relationship between high RS intake and satiety is still controversial. In this study, no difference in mean food intake between the two groups was observed, but weight gain was much lower in rats fed the retrograded rice, which suggests that the satiety-related weight control mechanism of RS may not be appropriate.
Increased RS in the retrograded rice starch significantly decreased liver weights (Table 3) and liver cholesterol concentrations (Table 6). The liver is the major organ for cholesterol synthesis and energy production; thus, the decrease in liver size in rats, fed the retrograded rice diet, may also have caused a decrease in cholesterol synthesis, compared to common rice powder. Many earlier studies have reported that feeding animals fiber such as lignin or cellulose results in a small decrease in liver size [30,31], which was similar to our results. Furthermore, dietary fiber such as pectin, lignin, bran, and alfalfa decrease serum cholesterol concentration [25,32]. Thus, based on these results, it can be said that RS acts similarly with dietary fiber in lowering liver weight and ultimately cholesterol concentration.
Our results showed that repetitive heating and cooling cycles significantly increased RS levels in rice, called retrograded rice, and that rats fed retrograded rice had lower weight gain, better lipid profiles, and improved bowel health. Based on these results, complications associated with hyperlipidemia may improve with the use of RS, particularly through the increased consumption of retrograded rice.


 XML Download