

 PDF
PDF ePub
ePub Citation
 Print
Print


Introduction
The number of female immigrants moving to Korea because of an international marriage to Korean men has been rapidly increasing since the early 1990s. The number of marriages between Korean men and immigrant women increased by 386% from 7,304 cases in 2000 to 28,163 cases in 2008. Among them, the proportion of Vietnamese female immigrants was 29.4% in 2008, which accounted for the second highest rate after Chinese women (46.9%) [1].
Many studies of immigrants have shown that immigration to a new environment has been associated with changes in dietary habits, lifestyle, and disease patterns [2-8]. It is important to identify their dietary status after immigration for providing appropriate diet counseling and performing effective interventions.
In a previous study, the nutritional status of Vietnamese female immigrants were poor according to one-day 24-hour dietary recall (24 HR), and their health status varied in relation to their length of residence in Korea [8]. Their average energy intake (1,490 kcal) was lower than the recommended nutrient intake for Vietnamese (2,200 kcal) and Korean women (2,100 kcal), and more than 50% of subjects did not meet the Korean Estimated Average Requirements for calcium, iron, vitamin A, vitamin B2, vitamin C, and folate. Prevalence of obesity and central obesity increased with the length of residence in Korea. However, due to the large intra-individual variability in food and nutrient intakes, one-day 24 HR is not sufficient to estimate the typical intake.
In many studies of immigrants, 24 HR and food-frequency questionnaire (FFQ) were used as the methods to assess dietary intake [9-12]. To overcome the limitations of one-day 24 HR, multiple day 24 HR has been used to estimate usual intake, however it is difficult to apply it in large epidemiologic studies due to its high cost and inconvenience of administration. Thus, the FFQ is the most frequently used instrument in epidemiological studies of immigrants because of its low cost and convenience of administration [9-12]. Since dietary intake varies according to the ethnic and cultural backgrounds of participants, the FFQ must be tailored to the study population [13]. However, there was no FFQ to assess nutrient intake of Vietnamese female immigrants in Korea. Therefore, a FFQ for Vietnamese female immigrants was developed and validated using the 24 HR as a reference method. In this study, we report the development and evaluation of the FFQ for Vietnamese female immigrants in Korea.
Subjects and Methods
Study samples
The subjects were Vietnamese female immigrants who participated in the Cohort of Intermarried Women in Korea, an ongoing, prospective study that began in November 2006. This study is one of the Korean Genome Epidemiology study (KoGES), established since May 2001 in Korea [14]. The aim of the KoGES is to examine genetic and environmental factors associated with chronic diseases with high morbidity and mortality in Korea. Participants eligible for this study were Vietnamese female marriage immigrants who were regularly contacted by local government health officials whose job was to support families of intermarried couples who had lived in Korea for more than six months. This study was conducted according to the guidelines laid down in the Declaration of Helsinki and all procedures involving human subjects were approved by the Institutional Review Board of Ewha Womans University School of Medicine. Written informed consent was obtained from all subjects.
Sample 1
A total of 1,014 Vietnamese female immigrants participated in the Cohort of Intermarried Women in Korea between November 2006 and November 2007. The participants were invited to attend a comprehensive health screening at local clinical centers in the Korean cities of Seoul, Busan, Daegu, Danyang, Gimhae, Gwangju, Gyeongju, Gongju, Jinju, Sangju, Masan, Okcheon, and Pohang. Food consumption was assessed using the one-day 24 HR method, and subjects who did not participate in the dietary assessment (n = 96) were excluded from data analysis. Dietary data from 918 immigrants was used to develop the FFQ.
Sample 2
Subjects for the validation study were recruited between November 2008 and August 2009. A total of 590 participants attended a comprehensive health screening at the above mentioned local clinical centers in the Korean cities. Among 590 participants, 165 subjects who did not complete the FFQ were excluded from the data analysis. Therefore, the final number of subjects for the validation of the FFQ was 425.
Development of a food frequency questionnaire
Selection of food items
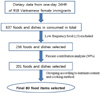
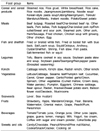
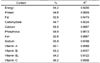
Food items for the FFQ were selected from the results of the one-day 24 HR data obtained from Sample 1. Fig. 1 describes the selection process of food items for developing the FFQ. The total number of food items identified from the one-day 24 HR was 637. Among 637 food items, 401 low frequency food items (≤5) were excluded. Among the remaining 236 food items, 201 food items were selected based on the cumulative percent contribution (cPC). The numbers of food items with 90% coverage of total nutrient intake were as follows: 77 for energy, 95 for protein, 84 for fat, 43 for carbohydrate, 103 for fiber, 99 for calcium, 109 for phosphorus, 107 for iron, 92 for sodium, 117 for potassium, 86 for vitamin A, 87 for vitamin B1, 104 for vitamin B2, and 84 for vitamin C. The remaining food items were listed in the order of their contribution of nutrients, and were grouped into 80 food items according to similarity of nutrient contents and cooking methods, as follows: cereal and cereal products (10), meats (12), fish and shellfish (10), legumes (4), kimchi (4), vegetables (16), seaweeds (2), fruits (10), beverages (8), and sweets and oils (4) (Fig. 2). For food items with different seasonal availability such as fruits, the participants were asked to mark the seasons in which they were frequently consumed. To review whether food items were selected appropriately, cPC and cumulative multiple regression coefficients (cMRC) of 80 food items were applied to 12 nutrients (energy, protein, fat, carbohydrate, calcium, phosphorus, iron, sodium, vitamin A, vitamin B1, vitamin B2, vitamin C) in Sample 1. As shown in Table 1, 80 food items covered more than 90% of the cPC and 0.90 of the cMRC for all nutrients except for iron.
Frequency and portion size
The FFQ included nine frequency responses: never, once per month, 2-3 times per month, 1-2 times per week, 3-4 times per week, 5-6 times per week, once per day, two times per day, and three times per day. Reference period was the past one year. Portion sizes were categorized into three groups: small (about half of the medium size), medium, and large (1.5 times the medium size). The medium portion sizes were determined by the most frequent portion sizes in the 24 HR data and from reference portion sizes of Dietary Reference Intakes for Koreans [15] and the Korean Nutrition Society [16]. Booklets with photographs of medium-sized portions of all food items were created and used for the FFQ interview in order to improve the accuracy of portion size estimation.
Validation study
For the validation study, 425 female immigrants (Sample 2) were asked to complete a one-day 24 HR and the FFQ at the same time. The order of administration of the FFQ and 24 HR was randomly assigned. The 24 HR and FFQ were administered by graduate students from the nutrition field and by trained interviewers. Vietnamese translators helped in the process whenever needed.
Statistical analysis
The daily nutrient intake for each food item on the FFQ was calculated by multiplying the nutrients per gram, the portion size in grams, and the weighted consumption frequency per day. Food intake data obtained from the 24 HR and the FFQ were analyzed using the Computer Aided Nutritional Analysis version 3.0 (CAN-pro 3.0, Nutritional Assessment Program, 2006, The Korean Nutrition Society, Seoul, Korea) [16].
The validity of the FFQ was assessed by comparing the mean nutrient intakes and calculating the crude intake, per 1,000 kcal, and energy-adjusted Pearson's correlation coefficients between the 24 HR and the FFQ. Log-transformation or square root-transformation was applied to improve the normality of the distribution of nutrient intake. Nutrient intake was adjusted for total energy intake using the residual method. The agreement between the 24 HR and the FFQ was compared by cross-classification analysis as in many previous studies [13,17]. We divided the daily intake from the 24 HR into quartiles and compared it with quartiles calculated from the FFQ, expressing the results as agreement, adjacent agreement and complete disagreement percentages. All analyses were performed using SAS 9.1 software (SAS Inc., Cary, NC, USA). Significance was defined as P < 0.05.
Results
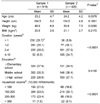
The mean ages in the Sample 1 and Sample 2 were 23.2 ± 4.7 years and 24.2 ± 4.2 years, respectively. Average body mass index (BMI) was 20.8 ± 2.6 kg/m2 for Sample 1 and was 21.1 ± 2.7 kg/m2 for Sample 2. About 64% of the Sample 1 and 27% of the Sample 2 resided in Korea for less than 2 years. The length of residence in Korea was longer in Sample 2 than in Sample 1 (P < 0.0001). Approximately 27% of both the Sample 1 and Sample 2 had an education level of high school graduate or higher. About 75% of the Sample 1 and 78% of the Sample 2 had a household income of less than two million KRW/month. Subjects in Sample 1 were slightly younger (P = 0.0378) and had a higher income level (P < 0.0001) than those in Sample 2 (Table 2).
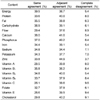
Table 3 presents the mean daily nutrient intake estimated by the one-day 24 HR and the FFQ. The total energy intake was 1,436.0 ± 444.1 kcal for the 24 HR and 1,750.3 ± 775.5 kcal for the FFQ, respectively. Except for dietary fiber, the nutrient intakes estimated from the FFQ were higher than those from the 24 HR.
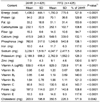
Table 4 shows the Pearson's correlation coefficients of nutrient intakes between the 24 HR and FFQ, which ranged from 0.10 (vitamin C) - 0.36 (energy) for crude, 0.05 (vitamin E) - 0.32 (calcium) for per 1,000 kcal, and 0.08 (zinc) - 0.34 (calcium) for energy-adjusted, respectively. The correlation coefficients of crude intake tended to be higher than those of per 1,000 kcal and energy-adjusted correlation coefficients.
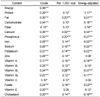
Proportions of agreement, adjacent agreement, and complete disagreement in the nutrient intakes between the 24 HR and FFQ are shown in Table 5. The percentages in the agreement groups ranged from 26.1% for vitamin C to 39.5% for energy. More than 70% of subjects were classified into the same or adjacent agreement groups for nutrients other than fiber, sodium, vitamin A, vitamin C, and vitamin E, while less than 10% of subjects were classified into complete disagreement groups.
Discussion
In the present study, we developed a FFQ for Vietnamese female immigrants in Korea and evaluated its validity by comparing it with the one-day 24 HR. All the mean nutrient intakes except for dietary fiber were higher in the FFQ than in the 24 HR. Pearson's correlation coefficients of nutrient intakes between the FFQ and 24 HR ranged from 0.10 (vitamin C) - 0.36 (energy) for crude intake, 0.05 (vitamin E) - 0.32 (calcium) for per 1,000 kcal, and 0.08 (zinc) - 0.34 (calcium) for energy-adjusted, respectively, and the cross-classification analysis showed 33% average proportion of agreement and less than 10% disagreement. Therefore, the FFQ was considered to be reasonably acceptable as a dietary assessment tool for Vietnamese female immigrants.
Sample 1 provided dietary data that was used to develop the FFQ, and Sample 2 was used for the validation study. Although, subjects in Sample 1 were slightly younger and had a higher income level than those in Sample 2, the differences were small. In the final FFQ, despite a large sample size, the number of selected food items (80 items) was small compared with other studies [17-19]. In addition, the 80 food items in the FFQ covered more than 90% of the cPC and 0.90 of the cMRC for 11 nutrients (energy, protein, fat, carbohydrate, calcium, phosphorus, sodium, vitamin A, vitamin B1, vitamin B2, vitamin C). The major reason for this may be the relatively simple dietary pattern of Vietnamese female immigrants in Korea. According to the previous study, our subjects had little opportunity to eat Vietnamese food and more than 80% of Vietnamese female immigrants consumed Korean dishes at every meal. Limited accessibility of favorite Vietnamese foods, low socioeconomic status, and the circumstances requiring consumption of unfamiliar Korean foods may have contributed to the simple diet of Vietnamese female immigrants [20]. Since it is relatively easy to adapt to fruits and instant noodles, their intakes were higher than the intakes of other foods.
The absolute nutrient intakes calculated from the FFQ were significantly higher than those calculated from the 24 HR for most nutrients, which is consistent with previous studies [13,17, 19,21,22]. With respect to the FFQ, study subjects may respond more than once for the foods in mixed dishes. In addition, 24 HR relatively sensitizes participants to dietary intake and, therefore, the FFQ may overestimate dietary intake compared with the 24 HR.
In our study, the correlation coefficients of nutrient intakes between the FFQ and one-day 24 HR ranged from 0.10 (vitamin C) - 0.36 (energy) for crude, 0.05 (vitamin E) - 0.32 (calcium) for per 1,000 kcal, and 0.08 (zinc) - 0.34 (calcium) for energy-adjusted, respectively. Correlation coefficients for crude intake were higher than those of per 1,000 kcal and energy-adjusted correlation coefficients, which is similar to other validation studies [6,19,23]. The summarized review noted that correlation coefficients of validation studies between the FFQ and 24 HR ranged from 0.10 to 0.89. The correlation coefficients in a Vietnamese validation study ranged from 0.16 to 0.45, which is similar to the results of our study [19]. However, in other Asian validation studies, the average correlation coefficients ranged from 0.3 to 0.5, which were higher than those of our study [17,23-25]. One-day 24 HR was used as a reference in our study, which may explain the relatively low correlation coefficients with the FFQ.
A cross-classification method demonstrated better results than did the use of correlation coefficients between the FFQ and 24 HR. The average proportion of agreement was 33%, and approximately 70% of participants were classified into the same or adjacent agreement groups. In our study, the degree of agreement in the same quartile is consistent with those in other studies [17,26], but a Chinese study reported a higher agreement rate for same quartile ranging from 37% to 50%, with adjacent proportions between 75% and 88% [14].
This study has several limitations. First, it used the one-day 24 HR as a reference method. A single-day 24 HR is a poor descriptor of an individual's usual dietary intake because of day-to-day variability in the food and nutrient intakes of most people [27]. Most validation studies have used repeated 24 HR or multiple days of dietary record as a standard to estimate usual dietary intake [13,19]. Although, we could not obtain repeated recall data, our study used one-day 24 HR of 425 subjects, which is a relatively larger sample size than that of other validation studies [13,17,19]. A sufficiently large number of 24 HR responses may provide a reasonable estimate of the mean nutrient intake of a group. Secondly, there were some communication problems, particularly with the Vietnamese subjects who had lived for a relatively short time period in Korea. However, Vietnamese translators who spoke fluent Korean and Vietnamese assisted whenever needed, and photographs of all food items in the FFQ were used to give a clear understanding of Korean foods and their accurate portion sizes.
On the other hand, this study also has several strengths. First, this is the first FFQ developed and validated for Vietnamese female immigrants in Korea. Secondly, the results of this study may be helpful for estimating the usual nutrient intake of Vietnamese female immigrants and will provide valuable information for assessing dietary patterns after immigration.
The FFQ for Vietnamese female immigrants in Korea was developed, and the validity of the FFQ was evaluated. The FFQ had reasonably acceptable levels of correlation and agreement. Therefore, this FFQ may be a useful tool for estimating nutrient intakes and the dietary patterns of Vietnamese female immigrants in Korea. Future studies are needed to validate the FFQ using various biomarkers or other dietary assessment methods such as multiple day food records. This FFQ will be helpful in the epidemiologic studies investigating dietary factors associated with disease patterns in Vietnamese female immigrants in Korea.
 XML Download