

 PDF
PDF ePub
ePub Citation
 Print
Print


Introduction
The quantification of body composition into its fat and fat-free mass (FFM) components is an essential key to the evaluation of its impact on health outcomes. An adequate amount of body fat and FFM are linked with physical fitness, good health and longevity, whereas an excess of body fat, namely obesity, causes or exacerbates chronic diseases including cardiovascular disease, diabetes and cancer [1-4]. Significant overall prevalence of obesity has been reported in the last decade in both developed and developing countries, and the epidemic of obesity poses a major challenge to the prevention of chronic disease worldwide [4,5]. Epidemiological studies of body composition seek to determine the relationships between chronic diseases and body composition, health outcomes, prevalence and prevention. Clinical settings also routinely need to assess body composition for diagnosis, treatment of disease and intervention strategy. Large-scale, easy-to-obtain, and accurate estimations of body composition are becoming a priority in clinical settings and epidemiological studies [6-8]. Such estimations frequently rely on the use of anthropometry in the form of the body mass index (BMI) and skinfold thickness.
As an indicator of body fatness, BMI is well correlated with body fatness and is practical when using body mass and standing height. However, an important limitation of the BMI is that it does not take into account the distinction between fat and FFM. Skinfold thickness measurements estimate fat and FFM but, although easy to perform, require skilled technicians, which limits their accuracy and reproducibility [9].
Given the limitations of anthropometry, alternative methods have been introduced. Among them, bioelectrical impedance analysis (BIA) is suitable for use in large-scale epidemiological studies and clinical settings. BIA allows operator-independent measurement and accurate determination of FFM and fat mass as well as practical features including safety, readiness, and easiness of use. Studies reported that the BIA models were valid against acceptable reference methods. BIA is more practical and accurate than anthropometry [10-12]. Some national surveys and clinical practices have begun to estimate body composition by BIA models [13-16].
However, BIA models for body composition are applicable only in populations that were validated for use in BIA, because the BIA model is dependent upon a statistical regression model derived in a specific population. A number of studies have shown that the inter-population difference in body composition characteristics produced different validity of various prediction equations across populations, according to sex, age, and ethnicity. Therefore, the validity must be confirmed based on the population using the BIA model [8,16-19].
The Korean population in Asia is suffering from obesity and obesity-related diseases with high morbidity and mortality [20,21]. Therefore, simple and valid measurement of body composition has become more important for epidemiologic studies in the Korean population. Recently an eight-electrode BIA model was developed in Korea for assessment of body composition and was even granted patents and approval for use from several countries including Korea, Japan, the United States, and in Europe [22,23]. This eight-electrode BIA model uses a recently developed segmental multi-frequency BIA device with 8-point electrodes that estimates body composition in the standing position, and provides both whole-body and segmental estimates of fatness. Thus, it is an attractive and convenient device [24-25]. This device can overcome the shortcomings of the 4-electrode foot-to-foot single frequency BIA device and the 4-electrode hand-to-foot single frequency BIA device with high reproducibility and sensitivity. The segmental multi-frequency BIA was reportedly more accurate and less biased than single frequency BIA and bioelectrical spectroscopy (BIS), resulting in better prediction of body composition [24-26]. Furthermore this eight-electrode BIA does not require standardization of the subject's posture before BIA, giving easy and rapid measurement. However, this BIA model has not been validated on independent samples from these nations. Therefore, the predictive accuracy and applicability in the Korean population are unknown. The eight-electrode BIA can be validated against dual-energy x-ray absorptiometry (DEXA), hydrodensitometry, and total body potassium. DEXA is one reference method that has been validated against independent methods such as in vivo neutron activation, total body potassium, and hydrodensitometry [27,28].
The purpose of this study was to compare the eight-electrode BIA with DEXA as a reference method in the assessment of body composition in the Korean adult population and to investigate the predictive accuracy and applicability of the eight-electrode BIA model.
Subjects and Methods
Subjects
This study was conducted from 2002 to 2003. A sample of healthy individuals was studied in the validation study of body composition. The inclusion criteria for selection were that the subjects were apparently healthy and distributed over the whole range of age and BMI. 174 healthy adults, 80 men and 94 women, were recruited through advertisements in the local media. All subjects underwent a preliminary assessment in a health check-up. None of the subjects had any known major systemic disease that would change the body composition abruptly. Each subject provided written informed consent and all protocols were approved by the Institutional Review Boards of the Konkuk University Medical Center (ID: KUH1090009).
Anthropometric measurements
All measurements were conducted on the same day after the subjects had fasted for at least four hours. During all measurements, subjects were instructed to put on only standardized light clothes and to remove all metal items, accessories and shoes. Height was determined to within 0.1cm by a wall-mounted stadiometer, and body weight was measured to the nearest 0.1 kg on an electronic scale. BMI was calculated as body weight in kilograms divided by height in meters squared.
Dual-energy X-ray absorptiometry
Total body composition, including fat mass, soft lean body mass, body mineral content (BMC) and fat-free mass (FFM), were measured by DEXA (DPX-L, Lunar Radiation, Madison, WI) as the reference method. Percent body fat (%fat) was computed by the manufacturer's software (version 1.3z). The measurements were performed in medium scan mode with the subject lying in a supine position, and the scanning time was about 20min. Calibration was performed daily against the standard block to control the possible baseline drift. A single expert analyzed all DEXA scans.
Bioelectrical impedance analysis
Body composition was assessed by a bioelectrical impedance analysis system (InBody 4.0, Biospace Co., Seoul, Korea) that was developed for the Korean population. After wiping the subject's palm and sole with an electrolyte tissue, the subject stood with soles in contact with the foot electrodes and grabbed the hand electrodes. Other data, including sex, height, weight, and age, were input into the instrument. The eight-electrode BIA system measured multiple segmental impedances (right arm, left arm, trunk, right leg, left leg) with multi-frequency (5, 50, 250, 500 kHz) from eight-polar tactile electrodes.
Statistical methods
The impedance values of the total body were calculated by summing the segmental impedance values, and the eight-electrode BIA system automatically displayed measurements of fat mass, %fat, and FFM. Residual scores of %fat (BIA_%fat minus DEXA_%fat) and residual scores of FFM (BIA_FFM minus DEXA_FFM) were calculated for each subject and plotted against mean of the eight-electrode BIA and DEXA. In order to evaluate prediction errors, we categorized the residual scores of %fat into three groups in men and women: i) under -3.5%fat, ii) between -3.5%fat and + 3.5%fat, iii) over + 3.5%fat. Similarly, we categorized the residual scores of FFM into three groups for men: i) under -3.5 kg FFM, ii) between -3.5 kg FFM and + 3.5 kg FFM, iii) over 3.5 kg FFM. For residual scores of FFM in women, we also categorized the individuals into three groups, but ± 2.8 kg FFM was used as the criterion [29]. The statistical significance of the average difference between DEXA and BIA was analyzed by the paired t-test. The Pearson's correlation coefficient was tested for the relationship between the eight-electrode BIA and DEXA. We performed linear regression analysis with the eight-electrode BIA as the independent variable and DEXA as the dependent variable. The limits of agreement on %fat and FFM were analyzed by Bland-Altman analysis. To check the association between the level of %fat and the number of individuals in upper/lower limit, we used Fisher's exact test and we used Bonferroni correction for multiple comparisons. The SPSS statistical software (version 11.0) was used for the statistical analysis. A two-tailed significance level of 5% was chosen as a type I error.
Results
Subject characteristics
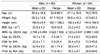
The characteristics of the population in this validation study are shown in Table 1. The ages of the participants ranged from 18 to 88yr, and the men were 3.3 years younger than the women on average with no significant difference (P = 0.243). The height, weight, adiposity (FM, %fat and BMI) and FFM in both men and women varied from high to low status. The adult men had significantly higher values of BMC and FFM. The BMI was comparable to the nationally representative data from the Korean National Health and Nutrition Examination Survey in 2005 [30] by age and sexes (23.7 ± 3.1 vs. 23.8 ± 4.2 in adult men and 23.1 ± 3.2 vs. 23.2 ± 4.3 in adult women from KNHNES and this study, respectively), showing that the population of this study was representative for body composition of Korean adults.
Comparison of BIA_%fat with DEXA_%fat
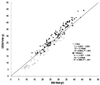
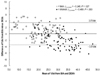
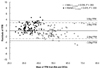
Plots of %fat as derived from BIA versus DEXA for men and women are displayed in Fig. 1. There was high correlation between %fat estimated by BIA (BIA_%fat) and %fat measured by DEXA (DEXA_%fat) in men and women with a total error of 2.1%fat in men and 2.3%fat in women, rated as 'excellent (≤ 2.5%fat)' by Lohman's criteria [29]. The mean of the difference between BIA_%fat and DEXA_%fat was small but significant (both men and women: P < 0.05, Table 1), which resulted in an overestimation of 1.2 ± 2.2%fat in men and an underestimation of -2.0 ± 2.4%fat in women. The Bland-Altman plots for residual scores (the individual differences of %fat from BIA minus DEXA) against the individual means of the two methods are shown in Fig. 2. The cases out of limit of agreement of differences were 11 men (13.8%, > 3.5%fat) and 31 women (33.0, < -3.5%fat) (Fig. 2, Table 2). The correlation coefficient (ry'-y,mean) between the individual means of the two methods and the residual scores of %fat was significant and negative for both men (r = -0.248) and women (r = -0.469). The %fat was overestimated at lower extremes in men and underestimated at upper extremes in women in the %fat distribution (Fig. 2).
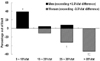
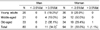
In Table 2, we compared the distribution among residual score groups across sex groups. There was a significant difference in the number of people in three residual scores between the sexes (P < 0.0001, by Fisher's Exact Test), indicating that sex was a factor of total error. In Fig. 3, which stratified the subjects into %fat groups (5-15%fat, 15-25%fat, 25-35%fat, > 35%fat), there were significant differences in the rates of out of limit among %fat groups in men and women (P < 0.05). The lean group (5-15%fat) had a higher rate of out of limit (> 3.5%fat) than the normal (15-25%fat, P < 0.01) or obesity groups (25-35%fat, P = 0.075) in men, while the more fatty group had a higher rate of out of limit (< -3.5%fat) in women (Fig. 3).
Comparison of BIA-FFM with DEXA-FFM
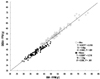
Plots of FFM as derived by BIA versus DEXA for men and women are shown in Fig. 4. The correlation coefficient (ry,y') between FFM by BIA (BIA_FFM) and FFM by DEXA (DEXA_FFM) was very high in both men (r = 0.982, P < 0.001) and women (r = 0.956, P < 0.001) and the total error was 1.6 kg in men and 1.2 kg in women, rated as 'ideal (men: < 2.5 kg, women: < 1.5 kg)' by Lohman's criteria [29]. With high correlation and ideally low total error, the predictions of FFM by BIA in men and women were accurate. However, the mean of the difference between BIA and DEXA was small but significant (both men and women: P < 0.05), which resulted in an underestimation of 0.8 ± 1.6 kg FFM in men and an overestimation of 1.2 ± 1.4 kg FFM in women. The Bland-Altman plots for the residual scores of FFM are shown in Fig. 5. In men, negative differences were found in 55 individuals (68.8% of men), and 3 individuals (3.8% of men) were out of the lower limit of agreement (-3.5 kg FFM) with no one out of the upper limit (+ 3.5 kg FFM). In women, positive differences were found in 71 individuals (75.5% of women), and 16 individuals (17.0% of women) were out of the upper limit of agreement (+ 2.8 kg FFM) with no one out of the lower limit of agreement (-2.8 kg FFM). The correlation between the means of the two methods and the residual scores in women was significantly positive (r = 0.415, P = 0.000), indicating gradually increasing overestimation of FFM.
Discussion
The present study examined the validation of the eight-electrode BIA model (Inbody 4.0) developed in Korea against the DEXA as a reference method in the representative population sample; this validation is necessary before BIA can be accepted as accurate and applicable for Korean adults. The BIA model provided a highly accurate estimation of %fat and FFM for the Korean adult population.
Even though the DEXA is a well-known reference method for measuring body composition due to its precision, accuracy, non-invasiveness, and safety [31], it has some disadvantages. The values of body composition estimates for the same subject can differ with different manufacturers' instruments [32]. This equipment is expensive, and the method is time-consuming and must be conducted in a lab or office. Furthermore, this method requires trained personnel to operate and often involves radiation. For these reasons, it is not easy to perform epidemiologic studies with DEXA in terms of time and cost. Therefore, more convenient and relatively accurate methods for body composition are required in epidemiologic studies.
The eight-electrode BIA model uses a segmental BIA device that estimates body composition in the standing position, and provides both whole-body and segmental estimates of fatness. This eight-electrode BIA device is an electronic lead switching multiplexer that can resolve resistance and reactance values from each arm and leg including the torso from right and left whole body electrode placements. These segments better define the human body as five individual electrical cylinders to allow the assessment of local body volume and improve whole body composition assessment [24-26]. In addition, detecting electrodes can be symmetrically (right and left side) re-positioned to compare local muscle groups. This device can overcome the shortcomings of the 4-electrode foot-to-foot single frequency BIA device and the 4-electrode hand-to-foot single frequency BIA device with high reproducibility and sensitivity. The segmental multi-frequency BIA was reportedly more accurate and less biased than single frequency BIA and bioelectrical spectroscopy (BIS), resulting in better prediction of body composition [24-26]. Furthermore, this eight-electrode BIA does not require standardization of the subject's posture, giving easy and rapid measurement in the absence of inter-individual technical error.
The eight-electrode BIA model showed outstanding correlation with the DEXA method in %fat and FFM of both men and women, ranging from 0.98-0.96 (P < 0.001) compared with other validation studies. From the literature by Kyle et al. [24], the correlations in the eight BIA models ranged from 0.98 to 0.81. The Xitron among the BIA models had a correlation of 0.98 in the 18-65yr-old healthy population. The correlations for RJL-101, RJL-103, SEAC, Human-IM scanner, IMP BO-1, Analycor3, and Valhalla were 0.96, 0.95, 0.97, 0.97, 0.96, 0.89, and 0.87, respectively. The eight-electrode BIA model had low total error (%fat: 2.1-2.3%fat; FFM: 1.2 kg-1.6 kg) and the accuracy was rated as excellent to ideal by Lohman's validation criteria [29]. These findings indicate that the eight-electrode BIA model had good agreement for the prediction of FFM and %fat in the Korean population.
However, there were small, but significant, differences between the estimates from BIA and DEXA in FFM and %fat with mean differences of -0.7 ± 3.1 kg FFM and 1.2 ± 4.4%fat in men and 1.2 ± 2.9 kg FFM and -2.0% ± 4.7%fat in women. Even though these differences were statically significant, they were in the range (0.0 ± 1.8 kg-3.12 ± 4.20 FFM) reported in the literature [29,33] and were not large enough to be clinically significant.
When the visualized Bland-Altman plots and the correlations between residual score and individual mean of FFM or %fat in Fig. 2 and Fig. 5 were considered, adiposity had effects on individual differences in men and women. The Residual scores suggested that total errors in prediction of individuals led to overestimation of %fat in lean individuals among men and underestimation of %fat in obese individuals among women. However, even though these total errors existed in the individual estimation of %fat, the BIA model provided an accurate estimation of %fat for individuals. When we evaluated the rate of residual scores, the %fat of more than four (86.3%) of every five in men was accurately estimated and %fat of approximately two (66.0%) of every three in women was accurately estimated to within 3.5%fat. These rates were higher than those in other studies. Stolarczyk et al. [33] reported that the rate of residual scores within 3.5%fat in their BIA model were 67% in men and 74% in women. The rates of residual scores for other BIA models ranged from 34-59% [33-35]. Given the results of this and other studies, the BIA model has a good predictive accuracy in the individual estimation of %fat with some total errors by adiposity. These total errors can be corrected by linear regression model. The results are shown in Table 3. This procedure provided the following: For men, DEXA-equivalent %fat = (1.03 × BIA %fat) - 1.83 where r2 = 0.914 and SEE = 2.25 %fat, P < 0.001. For women, DEXA-equivalent %fat = (1.11 × BIA %fat) - 1.34 where r2 = 0.921 and SEE = 2.26%fat, P < 0.001.
In summary, the eight-electrode BIA model had good agreement for the prediction of FFM and %fat in Korean adults. However, the eight-electrode BIA model had small, but systemic, errors in %fat and FFM in terms of the predictive accuracy for individual estimation. The total errors led to an overestimation of %fat in lean individuals among men and an underestimation of %fat among obese women. We therefore recommend equations for the correction of these total errors when the present eight-electrode BIA model is applied to a Korean adult population.

 XML Download