

 PDF
PDF ePub
ePub Citation
 Print
Print


Introduction
Balanced nutrition is very important during childhood, which is a period of vigorous growth, increased activity, and development of body functions and social cognitive ability. With rapid economic growth and increased personal income, and especially advances in food processing and manufacturing industries, the proportion of processed foods (e.g. snacks and cakes) in children's dietary life has noticeably increased [1-2]. It has also led to larger physiques of pre-adolescent children.
Recently, the interest in attention-deficit hyperactivity disorder (ADHD) during childhood has increased. ADHD is defined as a neurobehavioral developmental disorder characterized by continuous inattention, hyperactivity, and impulsiveness and is especially prevalent in childhood [3-4]. Unlike those showing simple hyperactivity features, children with ADHD have three subtype symptoms: predominantly hyperactive-impulsive, predominantly inattentive, and combined hyperactive-impulsive and inattentive [5-7]. The Conner Abbreviated Teacher Rating Scale (CATRS) is widely used to specifically measure the mental pathology behavior of children with ADHD [8]. The etiology of ADHD involves genetic, dietary, and environmental factors. Especially, dietary factors such as color agents or simple sugar have been determined to increase the risk of ADHD [6,9].
Simple sugar consumption may cause hyperactivity, given that snacks containing high sugar content cause massive secretion of insulin from the pancreas, resulting in hypoglycemia [9]. This stimulates an increase in epinephrine, leading to activation of nervous reactions and hyperactivity disorder behaviors [9]. In other words, elevated intake of snacks might increase the potential of nutritional imbalance, lower emotional intelligence [10-11], and ADHD [12-14]. A recent study on sugar consumption suggested that higher consumption of sugar is positively correlated with a higher level of hyperactivity and attention deficiency similar to ADHD [1,9,11,15]. However, it is still controversial whether or not there is an association between ADHD and sugar consumption. A study by Wolraich et al. found that diets high in sucrose had no significant effects on behavior and cognitive performance in children [16]. Moreover, in Korea, there are little data on how much simple sugar children obtain from snacks or if higher consumption of simple sugar is associated with ADHD risk.
Snacks play a critical role in the diets of school-age children, given that they supply additional nutrients as well as refreshment, mental relaxation, and emotional stability [2]. However, in Korea as well as other developed countries, sugar consumption has steadily increased with economic growth [17]. Over-consumption of saturated fat and simple sugar from fast foods, instant foods, and carbonated drinks is considered a potential risk factor for obesity, decayed teeth, and diabetes [18]. Due to these problems, the World Health Organization (WHO) has proposed that the proportion of daily calories obtained from simple sugar be 10% or less.
Therefore, this study was designed to investigate the consumption of simple sugar from snacks, the relationship between ADHD and sugar consumption, and the quality of diet and dietary behaviors of fifth graders at primary schools in Seoul. For this, we investigated sugar consumption from meals and snacks over 1 day and examined ADHD development based on teachers' ratings.
Subjects and Methods
Participants
A total of 112 students, 58 boys and 54 girls, enrolled in the fifth grade at two elementary schools in Seoul participated in this study. Data collection was conducted from December 17, 2008 to April 10, 2009 using a questionnaire that was administrated to subjects and completed individually with the help of trained researchers. Questionnaires were collected from 112 subjects and five were excluded due to incompleteness. The data of 107 subjects were used in the final analysis, representing a response rate of 95.5%.
Measurements and procedure
Two types of questionnaires, one for teachers and one for students, were used for data collection. The questionnaire for teachers was based on the Conner Abbreviated Teacher Rating Scale (CATRS-10) [3,4,19], which is a widely accepted measurement tool for ADHD symptoms, and a revised 'hyperactivity rating scale' developed by Goyette, Conners, and Ulrich [20] with 10 question items. A total score was obtained for the 10 items (0 = not at all, 1 = just a little, 2 = pretty much, and 3 = very much hyperactive), which characterized subjects based on deficit-attention, hyperactivity, and impulsiveness. The homeroom teachers completed the questionnaire by considering students' behaviors displayed over the previous 10 months. Possible scores ranged from 0 to 30 points, with higher scores indicating higher severity of the listed behavioral issues.
The second questionnaire for students was separated into three sections: dietary assessment, 10 items about dietary behaviors, and demographic variables. Demographic information included 12 items, such as gender, height, weight, and parents' information, including education, age, job, drinking, and smoking habits. Dietary habits consisted of six items, including breakfast intake frequency, regularity of meals, sweetness preference, reasons for eating high-sugar containing foods, allowance, and degree of unbalanced diets.
All data were collected by self-reporting with the help of a researcher for accurate data collection. BMI was calculated on the basis of self-reported data from the students. Dietary assessment was carried out based on 1-day food record in conjunction the 24-hour recalled method and specifically focused on eating place, food items, and quantity of each meal (breakfast, lunch, and dinner). The survey researcher helped students to complete the food record questionnaire, which included the amounts and types of foods consumed. CAN-Pro 3.0 [21] was used to analyze the nutrient contents and amounts of food consumed by children.
Snack consumption was surveyed using a structured questionnaire consisting of nine categories, including cookies and chips, dairy products, beverages (carbonated beverage, ion beverage, juice, children beverage, etc), bread and sandwiches, flour-based convenience foods (Ramyeon, Mandu, Odeng, hotdog etc), fast food, sweets and chocolate, rice cakes, and fruits. The subjects answered by writing the names of the foods and the quantity, such as units, slice, can, etc. To help children's answers, leaflets displaying the quantity and volume of a single serving of various foods were provided. Sugar contents were calculated based on the product label information regarding sugar content per one serving size or 100 g. In addition, USDA Nutritional Nutrient Database [22] and simple sugar contents of selected snacks published by the KFDA [23] were used to analyze sugar consumption.
Statistical analysis
Data were analyzed using Statistical Package for Social Science (SPSS) software for windows, version 14.0. Two groups were made according to the ADHD ratings provided by the teachers. The recommended cutoff score was a total score of 16 points, even though there is controversy that this cutoff score could classify more children as having ADHD [4,5,9]. Thus, we named the group of students scoring 16 points and less as the normal group and the group of students scoring 16 points higher as the risk group. Frequency analysis and a non-parametric independent test were used to identify the distribution and compare means between the two groups. To determine whether or not the risk factors were associated with ADHD, odd ratios were calculated using the Manel-Haenszel-Cochran test.
Results
Profiles of the respondents
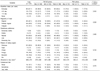
Among the 107 children that participated in this study, 54 were boys and 53 were girls. As presented in Table 1, parents' age was 43.1 years for the father and 40.6 years for the mother. The majority of fathers (80.0%) and mothers (66.7%) had at least a university level education. Exactly 50.5% of the respondents answered white-collar employee as their father's job, whereas 40.0% described their mother's job as housekeeper. The paternal smoking rate was 43.9% (n = 47 persons) while that of the mother was 0.9% (n = 1). Regarding drinking, most answered 'sometimes' for father and 'little' for mother.
ADHD evaluation score
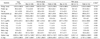
The abbreviated ADHD rating scale was used to measure children's behaviors. The average ADHD score was 7.41 for boys and 2.91 for girls (Table 2). The mean difference of 4.42 between the boy and girl groups was significant (P < 0.01). Among the 10 items, the 'excitable, impulsive' item received the highest score of 0.68, whereas the 'cries often and easily' item received the lowest score of 0.37, resulting in a total mean score of 5.18. The items 'disturbs other children (t = 3.607)', 'restless or overactive (t = 3.589)', 'excitable, impulsive (t = 3.357)', 'constant fidgeting (t = 3.366)', 'easily frustrated (t = 3.091)', and 'temper outbursts (t = 3.177)', were significantly higher scores in boys than girls.
Demographical profiles and dietary habits of the normal and risk groups
According to the ADHD scores, 46 boys and 52 girls who got a score of 16 points or less were categorized into the normal group, accounting for 91.6% of the total 107 students surveyed, whereas the remaining 8 boys and 1 girl were categorized into the risk group, accounting for 8.4% of the total subjects.
According to the demographic characteristics presented in Table 1, the mean age of parents of the two groups ranged from 40.5 to 43.2 years among mothers and fathers (P > 0.05). There were no statistically significant differences in education level or smoking habit of the parents as well as drinking frequency of the mother between the two groups. However, job type and drinking frequency of the father were significantly different between the two groups (P < 0.05).
In the anthropometric results, as shown in Table 3, the height and weight of the normal group was approximately 6 cm higher and 1.7 kg more than those of the risk group. Although the risk group had a higher BMI than the normal group, there was no significant difference between the two groups (P > 0.05) as both fell within the normal range of 18.5 to 23.5 kg/m2 for Korean children [24]. Specifically, BMI was measured to be 18.7 kg/m2 for boys and 18.4 kg/m2 for girls in the normal group and 19.8 kg/m2 for boys and 18.8 kg/m2 for girls in the risk group.
Dietary behaviors between the normal and risk groups, in terms of frequencies of breakfast intake per week, regularity of meals, preference of sweetness, reasons for eating sugar, and levels of unbalanced diet, were similar and no significant differences were observed the between groups (Table 4). Exactly 61.7% of the respondents answered that they ate breakfast every day, only 12.1% of respondents ate meals irregularly, and 58.9% answered their main reason for eating sugar was delicious taste. Four children out of nine (44.4%) belonging to the risk group answered that their main reason for eating sugar was due to hunger, as compared to 14.3% in the normal group.
Daily nutrient intake of the ADHD normal and risk groups
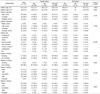
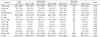
Daily nutrient intakes of the two groups are presented in Table 5. Energy intake of all of the subjects was measured as 1,813.2 kcal, comprised of 292.5 g of carbohydrates, 65.4 g of protein, and 54.1 g of fat. The ratio of carbohydrate : protein : fat was 71.0:15.9:13.1. These results were similar between the normal group and risk group. For the risk group, the energy intake was 1,810.2 kcal, comprised of 289.8 g of carbohydrates, 67.0 g of protein, and 52.0 g of fat in a ratio of 70.9:16.4:12.7. Therefore, no significant differences existed in terms of nutrient intake between the two groups. Comparing the consumption of other minerals and vitamins between the two groups, only the level of vitamin C was significantly different (P < 0.05), constituting 100.7 mg for the normal group and 45.9 mg for the risk group.
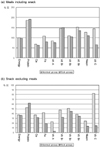
Fig. 1 presents the intake rate of nutrients based on the recommended levels of intake for Korean children [21]. Intakes of energy and vitamin B2 by the two groups were within the optimal range from 96.7 to 110.2%. However, the subjects consumed higher levels of protein (170.6~228.9%), vitamin B1 (112.6~155.6%), and vitamin B6 (127.3~200.0%) than the daily recommended intake levels for Korean children. On the contrary, intakes of calcium (33.0~72.5%) and vitamin A (28.8~87.6%) did not reach the daily recommended levels. Especially, the risk group showed a tendency of consuming less calcium (63.6 vs 68.1%), iron (79.7 vs 108.6%), and vitamin C (63.6 vs 143.9%) compared to the normal group, although only the level of vitamin C consumption was significantly different (P < 0.05).
Nutrient intake from snacks between the ADHD normal and risk groups
Daily nutrient intakes from snacks excluding meals of the ADHD normal and risk groups are presented in Table 6, and their rates are compared with the daily recommended intake levels shown in Fig. 1. The average intake of energy from snacks ranged from 672.2 to 689.7 kcal/day, which is equivalent to 36.2 to 37.3% of the estimated energy requirement for children aged 10 to 12. On the other hand, intakes of calcium (31.7 to 37.0%), protein (52.2-62.2%), vitamin B1 (32.4 to 47.4%), vitamin B2 (45.4 to 50.9%), and vitamin B6 (34.3 to 38.3%) from snacks were also higher, showing similar tendency between the normal and risk groups.
In the normal group, the intakes of iron (42.1% of RI) and vitamin C (82.5% of RI) from snacks were much higher compared to those of the risk group, which were 18.7 and 14.5% of the DRI, respectively. Only the intake level of vitamin C was significantly different between the normal and risk group (P < 0.05). Another interesting point is that the intakes of vitamin A and niacin by the risk group were fairly lower compared to other nutrients and those of the normal group (3.2% and 13.4%, respectively), although the differences were not significant.
Sources of simple sugar consumption between the two groups
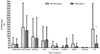
The levels of sugar intake from various snacks are presented in Fig. 2. We categorized the snacks consumed by students into nine types. Cookies and chips, dairy products, beverages, bread, flour-based meal, fast food, sweets, and rice cakes were the processed food types, all of which contain high content of simple sugar, preservatives, or coloring agents. Fruits were the sole natural food type.
The total daily intake of simple sugar from the nine categories of snacks consumed by all the subjects was 57.2 g, specifically 57.7 g for the normal group and 51.1 g for the risk group (P > 0.05). Excluding fruits, the students in the normal group consumed 41.7 g of total sugar, whereas those in the risk group consumed 47.6 g, which was not significantly different (P > 0.05). However, these levels almost reach the level of sugar intake per day as recommended by the WHO. According to WHO guidelines, the proper consumption level of simple sugar is 10% of one's total calorie intake per day, which translates to 47.5 g for boys and 42.5 g for girls aged 7 to 12 in Korea. Put together, there was no observed association between the total volume of sugar intake obtained from snacks and ADHD development.
Among the nine types of snacks, dairy snacks were the top source of simple sugar for both groups, constituting 17.5 g in the normal group and 14.9 g in the risk group. Meanwhile, the lowest priority sugar source was rice cakes, constituting only 0.1 g of sugar in both groups. There were no significant differences according to snack type (P > 0.05). Regarding individual snack types, there was a significant difference between the two groups with respect to sugar intake from fruits, liquefied yoghurt (normal group 2.8 g, risk group 5.0 g) among milk products, and pizza (normal group 0.1 g, risk group 2.0 g) among fast food. Regarding sugar intake from fruits, the normal group consumed 16.0 g while the risk group consumed 3.5 g, constituting a significant difference (P < 0.05).
Relationship between sugar consumption and children with/without ADHD risk
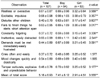
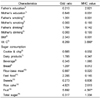
Odd ratios, which calculated from the data such as parents education levels, smoking habit, drinking frequency, students BMI, vitamin C intake, and consumption of simple sugar from snacks, are presented in Table 7. Only vitamin C from meals including snacks and simple sugar from fruits had significant effects on ADHD risk in children. The ADHD risk group consumed less than 3.5 g of simple sugar from fruits, while normal group consumed more sugar from fruits (P < 0.05). In addition, the group that consumed less than the daily RI of vitamin C from meals and snacks was also significantly associated with ADHD risk in child (P < 0.05). Unlike our expectations, a consumption level of simple sugar higher than that of the WHO recommended level was not related to ADHD risk.
Discussion
ADHD is characterized by symptoms of inattention, hyperactivity, and impulsivity in children [5-6]. ADHD is diagnosed in approximately 2% to 16% of school children [7] and is 6 to 9 times more common in boys than girls [6]. In this study, the prevalence rate of ADHD was 8.4% of the total subjects and was 8 times more common in boys than girls. This result is similar with a previous study that determined the prevalence rate of ADHD in elementary school age children to be 9.6% [25].
Based on previous studies, the causes of ADHD have been determined to be food additives [26], environmental factors [25,27], and sugar [6]. Artificial color agents and sodium benzonate preservative have been linked with increased hyperactivity in 3 year olds and 8-9 year olds [26]. Cigarette smoking and alcohol consumption also are strongly associated with ADHD [28]. In our study, relationships between smoking or alcohol consumption and ADHD were only partially observed. Only alcohol drinking by the father was linked with ADHD in a comparison of the normal and risk groups, and no relationship was found regarding smoking. However, the findings do suggest that the job type of the father might be associated with ADHD in the child. Therefore, future study is needed to further investigate this correlation.
This study did not observe any link between dietary behaviors and ADHD in school age students. The first reason for consuming sugar in both the risk and normal groups was taste, whereas the second reason was hunger for the ADHD group (44.4%) and boredom for the normal group. As a result, dietary behaviors involving regular eating of meals that can eliminate hunger should be recommended to prevent overconsumption of sugary snacks by children.
In a previous study, factors affecting snack intake during childhood were determined to be amount of allowance and TV viewing; a higher allowance and higher amount of TV viewing result in higher snack intake [18]. Another reason for consuming snacks is hunger [3], and eating less regular meals is associated with higher intake of high carbohydrate processed snacks [11]. In the snacking consumption part of this study, energy intake from snacks by school-aged children was too high. Children obtained about 37% percent of their total energy requirement and approximately 50% of protein DRI through snacks. In general, the rate of nutrient intake from snacks is recommended to be between 10 to 20% of the RDA (Recommended Daily Allowance), according to child nutrition guidelines suggested by the Ministry of Health and Welfare [29]. Based on this, we concluded that the subjects of this study were provided excessive nutrients from snacks as opposed to meals. Thus, dietary education is needed to help children choose healthy beverages/snacks [27]. From study identified needs for nutrition education on snack intake of child, the dietary education issues that parents gave their children at home were balanced diet (83.9%) and eating a healthful food (53.7%). Moreover, 18.2% of parents answered that their kids consumed the snacks much more than needed. Snack items frequently provided to kids were fruits (62.8%), followed by milk (55.5%), bread (47.1%), and yogurt (21.1%), whereas cola and cider constituted only 1.2% [30].
On the other hand, when comparing students' nutrition intake status with the DRI for Korean children aged 10-12, the students consumed 186.3 to 191.6% of the DRI of protein but less calcium (33.0~72.5% of DRI) and vitamin A (28.8~87.6% of DRI). Surprisingly, the ADHD group consumed less calcium (63.6% of DRI), iron (79.76%), and vitamin C (63.6%) compared to the normal group (P < 0.05) in terms of nutrition. Moreover, the risk group consumed less natural fruit (P < 0.05) (risk group: 45.9 mg; control group 100.7 mg) as well as less milk compared to the normal group. These results suggest that ADHD is linked with vitamin C consumption from vegetables and fruits. It also suggested that, consistent with previous study, less milk intake link with less calcium intake [27]. More study for investigating the relationship between fruit consumption and ADHD should be conducted.
Several recent studies suggested that ADHD development is related with consumption of coloring agents and preservatives in processed food [6,26]. ADHD could also be connected with intake of simple sugar [26]. Based on this, we compared the levels of sugar consumption between the normal and risk groups. Unexpectedly, the risk group consumed less fruits than the normal group and obtained almost the same amounts of sugar from the other types of snacks as compared to the normal group. Therefore, we concluded that the total consumption of simple sugar from snacks is not associated with ADHD (odd ratio = 0.317, P > 0.05). This result does not support a previous study in which a large amount of sugar consumption caused hyperactivity [6]. Similar to our results, a study by Wolraich et al. [16] that investigated the effects of sugar on behavior and learning competence in 32 hyperactive boys aged 7 to 12 suggested that sugar intake (1.75 g/kg of body weight) has no influence on attention and learning competency.
A study investigating the relationship between beverage intake and health in adolescent girls pointed that public health efforts should be actively employed to promote healthy beverage choices and decrease soda consumption [27]. Among all beverages, soda consumption is a major positive predictor of increased BMI as well as a negative predictor of calcium intake. In our study, we failed to confirm that sugar consumption from snacks is positively related with BMI, and overweight (BMI over 23.5) was not associated with ADHD (odd ratio 2.343, P > 0.05).
Lastly, simple sugar consumption from snacks alone was 41.7 g in the normal group and 47.6 g in the risk group, both of which are already near the 10% of total energy intake per day limit as recommended by the WHO. Including regular meals, the consumption of simple sugar intake by students reached 57.2 g (58.4 g for the normal group; 50.2 g for the risk group), which is approximately 12.5% of the required level for boy students. The Idaho State Department of Education has restricted simple sugar consumption in school foodservice. The school food authorities suggested that school meals have less than 10 grams of sugar per ounce [31]. In addition, when the amount of added sugar or simple sugar constitutes higher than 25% of the total energy intake per day, it adulterates the quality of the diet [32]. In this respect, school aged children need to consume less simple sugar-containing foods.
In conclusion, this study sought to determine the relationship between consumption of sugar by fifth graders at primary schools in Seoul and development of ADHD. We also tried to determine the relationship between ADHD and quality of diet and dietary behavior. This study did not find any evidence that ADHD development is related with consumption of sugar from snacks. However, we found that low intake of vitamin C or low consumption of fruits as snacks is associated with higher ADHD risk (P < 0.05). The intakes of simple sugar from snacks alone were 58.4 g and 50.2 g by the normal group and risk group, respectively, whereas a total of 57.2 g of simple sugar from regular meals was consumed. Therefore, continuing education on the right selection of snacks and on proper nutritional intake is needed for students to prevent unintended overindulgence of simple sugar.
This study had three limitations. The number of subjects was restricted to only fifth grade elementary students in Seoul who voluntarily participated. The second limitation was that the survey was carried out only one-day diets consumption survey. Lastly, this study was a cross-sectional study rather than a randomly assigned blind case and control study. Therefore, interpretation of the results should be done carefully. For the generalization of these results, future study should be designed with the methodology of a double-blind randomized clinical trial.

 XML Download