Journal List > Nutr Res Pract > v.5(3) > 1051141

Kim, Choi, and Han: High fat diet-induced obesity leads to proinflammatory response associated with higher expression of NOD2 protein

Abstract

Obesity has been reported to be associated with low grade inflammatory status. In this study, we investigated the inflammatory response as well as associated signaling molecules in immune cells from diet-induced obese mice. Four-week-old C57BL mice were fed diets containing 5% fat (control) or 20% fat and 1% cholesterol (HFD) for 24 weeks. Splenocytes (1 × 10⁷ cells) were stimulated with 10 µg/mL of lipopolysaccharide (LPS) for 6 or 24 hrs. Production of interleukin (IL)-1β, IL-6, and TNF-α as well as protein expression levels of nucleotide-binding oligomerization domain (NOD)2, signal transducer and activator of transcription (STAT)3, and pSTAT3 were determined. Mice fed HFD gained significantly more body weight compared to mice fed control diet (28.2 ± 0.6 g in HFD and 15.4 ± 0.8 g in control). After stimulation with LPS for 6 hrs, production of IL-1β was significantly higher (P = 0.001) and production of tumor necrosis factor (TNF)-α tended to be higher (P < 0.064) in the HFD group. After 24 hrs of LPS stimulation, splenocytes from the HFD group produced significantly higher levels of IL-6 (10.02 ± 0.66 ng/mL in HFD and 7.33 ± 0.56 ng/mL in control, P = 0.005) and IL-1β (121.34 ± 12.72 pg/mL in HFD and 49.74 ± 6.58 pg/mL in control, P < 0.001). There were no significant differences in the expression levels of STAT3 and pSTAT3 between the HFD and the control groups. However, the expression level of NOD2 protein as determined by Western blot analysis was 60% higher in the HFD group compared with the control group. NOD2 contributes to the induction of inflammation by activation of nuclear factor κB. These findings suggest that diet-induced obesity is associated with increased inflammatory response of immune cells, and higher expression of NOD2 may contribute to these changes.

Introduction

Obesity leads to chronic low-grade inflammation. Infiltration of macrophages into adipose tissue, increased production of proinflammatory mediators by adipocytes, and systemic increase of inflammatory cytokines are all associated with obesity [1-3]. This increase in inflammation has been suggested to play a role in the pathogenesis of insulin resistance, cardiovascular disease, asthma, and arthritis. The prevalence of these diseases has been shown to increase with obesity. Some suggested mechanisms linking obesity to inflammation are increased activities of Jun N-terminal kinase (JNK) and IκB kinase β (IKKβ) [4]. Activation of IKKβ results in activation of nuclear factor κB (NF-κB).
Sepsis is a systemic hyperinflammatory response to infection that results in high mortality. In a previous study, mice fed high-fat diet (HFD) for 8 weeks showed higher mortality after intravenous inoculation of Staphylococcus aureus (S. aureus), a Gram-positive bacterium. Higher serum levels of proinflammatory interleukin (IL)-1β and anti-inflammatory IL-10 were also observed in S. aureus-infected, HFD-fed mice as compared with infected mice on low-fat diet [5]. Further, exogenous administration of leptin to normal mice was shown to increase mortality in a lipopolysaccharide (LPS)-administered endotoxemia model [6]. Leptin is an adipose tissue-derived molecule, and its circulatory level has been shown to increase with obesity [7]. On the other hand, Amar et al. [8] reported that HFD-induced obesity causes a blunted inflammatory response with lower serum levels of tumor necrosis factor (TNF)-α, IL-6, and serum amyloid A (SAA) in response to systemic inoculation with Porphyromonas gingivalis (P. gingivalis), a Gram-negative bacterium. Therefore, the influence of obesity on the inflammatory response to bacteria or bacterial components is not yet conclusive.
Nucleotide-binding oligomerization domain (NOD)2 is a protein mainly expressed in the cytosol and is involved in the responsiveness to bacterial components [9]. Stimulation with bacterial LPS and TNF-α results in up-regulation of NOD2, which then induces activation of NF-κB [10,11].
Signal transducer and activator of transcription (STAT)3 is involved in signaling through the leptin receptor, T cell differentiation, and the inflammatory response [12-14]. One of the key activators of STAT3 is interleukin (IL)-6. STAT3 also interacts with NF-κB. Obesity seems to have a differential effect on the activation of STAT3, depending on the tissues and the signaling pathways involved. In the hypothalamus, decreased STAT3 phosphorylation in response to leptin treatment has been observed [12]. In the liver, obesity causes activation of STAT3 and hepatic inflammation, which contributes to the development of hepatocellular carcinoma [15].
In this study, we investigated the influence of diet-induced obesity on the inflammatory response of immune cells in response to bacterial components as well as changes in the expression of signaling molecules involved in the regulation of the inflammatory response.

Materials and Methods

Animals

Four-week-old male C57BL/6J mice were purchased from Jackson Laboratory (Bar Harbor, ME, USA). Mice were fed AIN-76 semi-purified diet over a 1-week acclimation period, then randomly divided into two groups and fed either control diet or high-fat diet (HFD) for 24 weeks. Control diet contained 5% fat (by weight as corn oil) while HFD contained 20% fat (by weight as corn oil and lard) and 1% cholesterol. Compositions of both control and HFD diets were based on AIN-76 semi-purified diet (Table 1). At the end of the 24-week experimental period, mice were sacrificed, and spleens were removed and processed for preparation of single cell suspensions. Mice were maintained in a controlled environment at 25℃ and 55% relative humidity with a 12 hr light/12 hr dark cycle. All conditions and handling of the animals were approved by the Animal Care and Use Committee at Kyungpook National University. Animals were weighed once a week.

Splenocyte isolation

Spleens were aseptically removed and placed in sterile RPMI 1640 (Lonza, Walkersville, MD) supplemented with 100,000 U/L of penicillin (Gibco, Carlsbad, CA), 100 mg/L of streptomycin (Gibco, Carlsbad, CA), 2 mmol/L of L-glutamine (Gibco, Carlsbad, CA), and 25 mmol/L of HEPES (Sigma, St.Louis, MO) (complete RPMI). Single cell suspensions were prepared by gently disrupting spleens between two sterile frosted glass slides. Splenocytes were isolated via centrifugation (400 × g), and red blood cells were lysed using Gey's solution. Splenocytes were washed twice with complete RPMI, and viability was determined by Trypan blue exclusion. Splenocytes were then suspended in complete RPMI containing 10% heat-inactivated fetal bovine serum (Gibco, Carlsbad, CA) at appropriate concentrations for cultures.

Inflammatory cytokine production

Splenocytes were cultured at 1 × 10⁷ cells/well in the presence of 10 µg/mL of lipopolysaccharide (LPS, Sigma, St. Louis) in 24-well culture plates for 6 or 24 hrs. Cell-free supernatants were collected and stored at -80℃ for later analysis. Levels of IL-1β, IL-6, and TNF-α produced were measured using ELISA (BD OptEIA set for mouse IL-1β, IL-6, or TNF-α, BD Pharmingen™, San Diego, CA) according to the manufacturer's instructions.

Determination of STAT3, pSTAT3, and NOD2 expression levels

Protein expression levels of STAT3, pSTAT3, and NOD2 were determined from splenocytes stimulated with LPS for 24 hrs. After splenocytes (1 × 10⁷ cells) were stimulated with 10 µg/mL of LPS for 24 hrs, cells were collected and washed twice with PBS. Cells were then lysed with WCE buffer containing 50 mM Tris, 1% Igepal CA-630, 0.1% SDS, 5 mM EDTA, and protease inhibitors (Complete Mini protease inhibitor cocktail, Roche Diagnostics GmbH, Mannheim, Germany), pH 7.5. Cell lysate was centrifuged at 10,000 g for 30 min at 4℃. Protein concentration was determined by the Bradford method (Bio-Rad, Hercules, CA, USA). Forty micrograms of protein was separated by electrophoresis on a 10% SDS-polyacrylamide gel, followed by transfer to PVDF membranes (Bio-Rad, Hercules, CA, USA). The membrane was then blocked with 5% nonfat dry milk in Tris-buffered saline solution containing 0.1% Tween-20, pH 7.6 (TBST) for at least 1 hr. Membranes were incubated with rat anti-mouse NOD2 (eBioscience, San Diego, CA, USA, 1:500), rabbit anti-STAT3 (Cell Signaling Technology, Danvers, MA, USA, 1:2000), or rabbit anti-phospho-STAT3 (Tyr 705) (Cell Signaling Technology, Danvers, MA, USA, 1:1000) in TBST containing 5% BSA for overnight at 4℃. Membranes were next washed with TBST and incubated with secondary anti-rabbit IgG HRP-linked antibody (Cell Signaling Technology, Danvers, MA, USA) or goat anti-rat IgG-HRP (Santa Cruz Biotechnology, Santa Cruz, CA, USA) in 5% skim milk/TBS-T for at least 1 hr at room temperature. Specific bands were visualized with an enhanced chemiluminescence system (Bionote, Korea). Intensities of the bands were quantified using a Gel Doc XR system (Bio-Rad, Hercules, CA, USA) equipped with Quantity One 1-D analysis software (Bio-Rad, USA).

Statistical analysis

Data were analyzed by Student's t test to test for differences. A P value of 0.05 or less was considered to be significant. Data are reported as means ± SEM. All analyses were performed using the SYSTAT 10 statistical package (SYSTAT, Evanston, IL).

Results

Body weight changes

Changes in the body weights of mice after 24 weeks on the experimental diets were significantly higher in the HFD group (28.2 ± 0.6 g, n = 13) compared with the control group (15.4 ± 0.8 g, n = 10) (P < 0.001) (Table 2).

Effects of high fat diet-induced obesity on IL-6, IL-1β, and TNF-α production by splenocytes

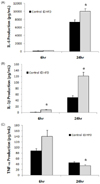
Levels of inflammatory cytokines, IL-6, IL-1β, and TNF-α, produced by LPS-stimulated splenocytes are shown in Fig. 1. IL-1β production was significantly higher in the HFD group compared to the control at both 6 and 24 hrs following stimulation with LPS. IL-6 production levels did not differ between the HFD and control groups after 6 hrs of stimulation; however, after 24 hrs of stimulation, splenocytes from the HFD group produced a significantly higher level of IL-6 (10.02 ± 0.66 ng/mL in HFD vs. 7.33 ± 0.56 ng/mL in control, P = 0.005). TNF-α production showed different patterns at 6 and 24 hrs. Whereas splenocytes from the HFD group tended to produce a higher level of TNF-α at 6 hrs compared with those from the control group (139.7 ± 22.8 pg/mL in HFD vs. 88.0 ± 8.8 pg/mL in control, P = 0.064), production of TNF-α after 24 hrs of stimulation was significantly higher in the control group (35.0 ± 3.0 pg/mL in HFD vs. 45.2 ± 3.6 in control, P = 0.044).

Effects of high fat diet-induced obesity on STAT3, pSTAT3, and NOD2 expression in splenocytes

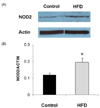
Expression level of NOD2 protein, as determined by Western blot analysis, in LPS-stimulated splenocytes was significantly higher in the HFD group (Fig. 2). The level of NOD2 expression corrected for actin was about 60% higher in the HFD group compared with the control group (P = 0.049). Expression levels of STAT3 and pSTAT3 in LPS-stimulated splenocytes did not differ between the HFD and control groups (Fig. 3).

Discussion

In this study, obesity induced by long term (6 months) feeding of HFD led to higher production of the inflammatory cytokines IL-1β and IL-6 by LPS-stimulated splenocytes. Significantly higher IL-1β production by HFD-fed obese mice as compared with control diet-fed mice was observed at 6 hrs after LPS stimulation. After 24 hrs of LPS stimulation, splenocytes from obese mice produced significantly higher levels of both IL-1β and IL-6 than those from control mice. These results clearly indicate that obesity contributed to the elevated proinflammatory response to LPS stimulation. On the other hand, TNF-α production was higher in the obese mice after 6 hrs of LPS stimulation but lower after 24 hrs compared with the control mice. The average level of TNF-α produced in the HFD group was 58% higher compared to that of the control after 6 hrs of stimulation with LPS. After 24 hrs of stimulation with LPS, average level of TNF-α produced in the HFD group was 22% lower compared with the control. Mito et al. [16] did not observe a significant difference in TNF-α production by splenocytes stimulated with LPS for 24 hrs between obese and control mice; however, they did not measure IL-1β and IL-6 production in their study.
We observed significantly higher expression of NOD2 protein in LPS-stimulated splenocytes from obese mice compared with those from control mice. NOD2 is a cytosolic protein that detects bacterial components and induces NF-κB activation. It also promotes the activation of caspases [11]. Activation of NF-κB leads to the transcription of inflammatory cytokines such as IL-6, IL-1β, and TNF-α [17]. Higher expression of NOD2 in obese mice might explain the mechanism of higher production of IL-6 and IL-1β in these animals. However, the differential expression pattern of TNF-α warrants further research. TNF-α production showed a more immediate response to LPS stimulation than either IL-1β or IL-6, as the levels of TNF-α production were higher at an earlier time point while IL-1β and IL-6 production showed a significant increase after 24 hrs of stimulation. Therefore, higher production of TNF-α at an earlier time point after stimulation in the HFD group is consistent with the increased inflammatory response observed in the obese group.
Evidence linking NOD2 activity with obesity-associated inflammation is still limited. Recently, Nod-like-receptor (NLR) protein3 (Nlrp3) was reported to contribute to obesity-induced inflammation and insulin resistance [18]. Nlrp3 is a protein with 1016 amino acids and is expressed in the cytosols of granulocytes, monocytes, dendritic cells, T and B cells, and epithelial cells. Nlrp3 contains an NOD motif and assembles a multi-protein complex called the Nlrp3 inflammasome [19]. The Nlrp3 inflammasome triggers caspase-1 activation in macrophages in response to a obesity-related increase in ceramides, leading to IL-1β secretion [18].
In this study, there was no significant difference in the expression levels of either STAT3 or pSTAT3 between the obese and control mice. The influence of obesity on STAT3 expression is complicated as STAT3 is involved in the signaling of various molecules associated with obesity. Leptin receptor signals through STAT3, and both inflammatory IL-6 and anti-inflammatory IL-10 utilize STAT3 [12,14,20]. In the liver, HFD-induced obesity has been shown to elevate mRNA expression of IL-6, TNF-α, and IL-1β as well as activate STAT3, as evidenced by higher expression of pSTAT3 [15]. In contrast to the liver, decreased pSTAT3 expression following leptin treatment has been observed in the hypothalami of diet-induced obese animals, which supports leptin resistance [12]. However, in this study, it was hard to discern the possible effects of higher IL-6 production and higher circulating leptin levels (data not shown) in obese mice on STAT3 activation.
In conclusion, our study demonstrated that obesity induced by long term feeding with HFD can produce a more pronounced inflammatory response by immune cells in response to LPS stimulation, as evidenced by higher production of IL-1β and IL-6. Higher NOD2 expression might be one of the mechanisms that can explain the elevated inflammatory response. This higher expression of NOD2 and stronger inflammatory response to LPS in obese mice might pose an increased risk for sepsis following bacterial challenge.

Figures and Tables

Fig. 1
Levels of inflammatory cytokines produced by splenocytes from animals in the control and HFD groups. Levels of (A) IL-6, (B) IL-1β, and TNF-α produced by splenocytes (1 × 10⁷ cells) stimulated with LPS (10 µg/mL) for 6 or 24 hrs. *Significantly different from the control group by Student's t-test at P < 0.05.
nrp-5-219-g001
Fig. 2
NOD2 expression levels in splenocytes from animals in the control and HFD groups stimulated with LPS (10 µg/mL). (A) Representative immunoblots. (B) Densitometric analyses of NOD2 protein expression corrected for Actin expression. Values are means ± SEM (n = 4). *Significantly different from the control group by Student's t-test at P < 0.05.
nrp-5-219-g002
Fig. 3
Expression levels of STAT3 and pSTAT3 in splenocytes from animals in the control and HFD groups stimulated with LPS (10 µg/mL). (A) Representative immunoblots of STAT3. (B) Densitometric analyses of STAT3 protein expression corrected for actin expression. (C) Representative immunoblots of pSTAT3. (D) Densitometric analyses of pSTAT3 protein expression corrected for actin expression. Values are means ± SEM (n = 4).
nrp-5-219-g003
Table 1
Composition of experimental diets
nrp-5-219-i001

1)AIN-76 mineral mixture (grams/kg); calcium phosphate 500, sodium chloride 74, potassium citrate 2,220, potassium sulfate 52, magnesium oxide 24, magnesium carbonate 3.5, ferric citrate 6, zinc carbonate 1.6, cupric carbonate 0.3, potassium iodate 0.01, sodium selenite 0.01, chromium potassium sulfate 0.55, sucrose 118.03

2)AIN-76 vitamin mixture (grams/kg); thiamin HCL 0.6, riboflavin 0.6, pyridoxine HCL 0.7, niacin 3, calcium pantothenate 1.6, folic acid 0.2, biotin 0.02, vitamin B12, vitamin A (500,000 U/gm) 0.8, vitamin D3 (400,000 U/gm) 0.25, vitamin E acetate (500 U/gm) 10, menadione sodium bisulfite 0.08, sucrose 981.15

Table 2
Body weights and body weight changes in control and HFD groups1)
nrp-5-219-i002

1)Data are presented as means ± SEM.

*Significantly different from control group by Student's t-test (P < 0.001).

Notes

This work was supported by Basic Science Research Program through the National Research Foundation of Korea(NRF) funded by the Ministry of Education, Science and Technology (MEST) (KRF-331-2008-1-C00305) and by Basic Science Research Program (Center for Food & Nutritional Genomics: grant number 2009-0063409) of the National Research Foundation of Korea (NRF) funded by the Ministry of Education, Science and Technology.

References

1. Ferrante AW Jr. Obesity-induced inflammation: a metabolic dialogue in the language of inflammation. J Intern Med. 2007. 262:408–414.
crossref
2. Xu H, Barnes GT, Yang Q, Tan G, Yang D, Chou CJ, Sole J, Nichols A, Ross JS, Tartaglia LA, Chen H. Chronic inflammation in fat plays a crucial role in the development of obesity-related insulin resistance. J Clin Invest. 2003. 112:1821–1830.
crossref
3. Shoelson SE, Herrero L, Naaz A. Obesity, inflammation, and insulin resistance. Gastroenterology. 2007. 132:2169–2180.
crossref
4. Karalis KP, Giannogonas P, Kodela E, Koutmani Y, Zoumakis M, Teli T. Mechanisms of obesity and related pathology: linking immune responses to metabolic stress. FEBS J. 2009. 276:5747–5754.
crossref
5. Strandberg L, Verdrengh M, Enge M, Andersson N, Amu S, Onnheim K, Benrick A, Brisslert M, Bylund J, Bokarewa M, Nilsson S, Jansson JO. Mice chronically fed high-fat diet have increased mortality and disturbed immune response in sepsis. PLoS One. 2009. 4:e7605.
crossref
6. Shapiro NI, Khankin EV, Van Meurs M, Shih SC, Lu S, Yano M, Castro PR, Maratos-Flier E, Parikh SM, Karumanchi SA, Yano K. Leptin exacerbates sepsis-mediated morbidity and mortality. J Immunol. 2010. 185:517–524.
crossref
7. Lago R, Gómez R, Lago F, Gómez-Reino J, Gualillo O. Leptin beyond body weight regulation-current concepts concerning its role in immune function and inflammation. Cell Immunol. 2008. 252:139–145.
crossref
8. Amar S, Zhou Q, Shaik-Dasthagirisaheb Y, Leeman S. Diet-induced obesity in mice causes changes in immune responses and bone loss manifested by bacterial challenge. Proc Natl Acad Sci U S A. 2007. 104:20466–20471.
crossref
9. Inohara N, Ogura Y, Nuñez G. Nods: a family of cytosolic proteins that regulate the host response to pathogens. Curr Opin Microbiol. 2002. 5:76–80.
crossref
10. Gutierrez O, Pipaon C, Inohara N, Fontalba A, Ogura Y, Prosper F, Nunez G, Fernandez-Luna JL. Induction of Nod2 in myelomonocytic and intestinal epithelial cells via nuclear factor-kappa B activation. J Biol Chem. 2002. 277:41701–41705.
crossref
11. Inohara N, Nuñez G. NODs: intracellular proteins involved in inflammation and apoptosis. Nat Rev Immunol. 2003. 3:371–382.
crossref
12. Myers MG, Cowley MA, Münzberg H. Mechanisms of leptin action and leptin resistance. Annu Rev Physiol. 2008. 70:537–556.
crossref
13. Stepkowski SM, Chen W, Ross JA, Nagy ZS, Kirken RA. STAT3: an important regulator of multiple cytokine functions. Transplantation. 2008. 85:1372–1377.
crossref
14. Greenhill CJ, Rose-John S, Lissilaa R, Ferlin W, Ernst M, Hertzog PJ, Mansell A, Jenkins BJ. IL-6 trans-signaling modulates TLR4-dependent inflammatory responses via STAT3. J Immunol. 2011. 186:1199–1208.
crossref
15. Park EJ, Lee JH, Yu GY, He G, Ali SR, Holzer RG, Osterreicher CH, Takahashi H, Karin M. Dietary and genetic obesity promote liver inflammation and tumorigenesis by enhancing IL-6 and TNF expression. Cell. 2010. 140:197–208.
crossref
16. Mito N, Hosoda T, Kato C, Sato K. Change of cytokine balance in diet-induced obese mice. Metabolism. 2000. 49:1295–1300.
crossref
17. Liu SF, Malik AB. NF-κB activation as a pathological mechanism of septic shock and inflammation. Am J Physiol Lung Cell Mol Physiol. 2006. 290:L622–L645.
crossref
18. Vandanmagsar B, Youm YH, Ravussin A, Galgani JE, Stadler K, Mynatt RL, Ravussin E, Stephens JM, Dixit VD. The NLRP3 inflammasome instigates obesity-induced inflammation and insulin resistance. Nat Med. 2011. 17:179–188.
crossref
19. Lamkanfi M, Kanneganti TD. Nlrp3: an immune sensor of cellular stress and infection. Int J Biochem Cell Biol. 2010. 42:792–795.
crossref
20. Hanada T, Yoshimura A. Regulation of cytokine signaling and inflammation. Cytokine Growth Factor Rev. 2002. 13:413–421.
crossref
TOOLS
Similar articles