

 PDF
PDF ePub
ePub Citation
 Print
Print


Introduction
The prevalence of diabetes in the world was estimated to be 2.8% in 2000 and 4.4% in 2030 [1]. In Korea, diabetes is a major chronic disease, and its incidence has risen dramatically. The mortality rate due to diabetes from 1995 to 2005 increased 2-fold in Korea [2]. The main cause can be attributed to obesity stemming from changes in Korean dietary patterns [3]. The intake of fat and animal foods has increased remarkably [4].
Dietary intake plays a role in both the origin and treatment of diabetes. Medical nutrition therapy (MNT) is a basic treatment for diabetes that aims to reduce body weight and help optimize metabolic control [5]. Fasting glucose levels fall rapidly within the first 3 to 14 days of diet therapy, and as little as a 5% reduction in body weight may be associated with significant improvements in glycemic control [6]. However, only 15% of patients can achieve and sustain a normal fasting glucose level with diet therapy alone [7]. When the target glycemic control level is not achieved after 2-3 months of MNT, pharmacotherapy is considered [8]. Even during pharmacotherapy or the insulin treatment period, MNT is important for controlling one's body weight and metabolism. Many studies have examined the relationship between diet and drug interactions in diabetes [9,10].
Much controversy exists about the relationship between the amount and types of dietary fat and carbohydrates and the risk for diabetes. There are no clear recommendations on the appropriate macronutrient composition for reducing risk for diabetes. Increased energy intake is most likely to blame for insulin resistance through the production of obesity. As such, energy restriction may be the best nutritional approach for the treatment of insulin resistance. Intake of dietary fat, particularly saturated fat, appears to be associated with insulin resistance and may predispose oneself to the development of diabetes [11,12]. Diets high in monounsaturated and polyunsaturated fatty acids were shown to have beneficial effects on glucose control and insulin sensitivity relative to low-fat, high-carbohydrate diets [13,14]. However, other studies suggested that there is no association between increased risk for type 2 diabetes and total dietary fat intake or intake of specific types of fatty acids [15]. The role of dietary carbohydrates in insulin resistance has been debated. Samaha et al. [16] reported that low-carbohydrate diets improved insulin sensitivity. But, there is no association between total carbohydrate intake and diabetes risk [17-19], and other studies reported that total carbohydrate intake is inversely related to HOMA-IR [20].
Current dietary guidelines are recommended for the general population, but emerging evidence suggests an individualized approach involving MNT in accordance with the specific conditions. MNT for Korean individuals with diabetes mellitus involves treatment using dietary choices that consider Korean dietary patterns, treatment, and duration.
In this study, we aimed to investigate the dietary intake of Korean patients with type 2 diabetes according to treatment type and duration and examine the effects of changing dietary intakes on the metabolic risk for diabetes.
Subjects and Methods
Protocol and subjects
The subjects were type 2 diabetes patients treated with medical nutrition therapy (MNT group) alone, oral hypoglycemic agents (OHA group), or insulin (combination therapy or single therapy; insulin group) in addition to MNT. The subjects with diabetes were treated at Kyung Hee Medical Center. We investigated each subject's family history of diabetes, disease duration, treatment method, and medication via interview with a questionnaire. Blood pressures were also measured. Subjects were excluded if they had abnormal renal or liver function or had gastrointestinal disease. The protocol and consent forms for the study were approved by the ethics review board of the Kyung Hee Medical Center, and each volunteer was informed about the study and agreed to participate by reading and signing the approved consent form.
Anthropometric measurements and dietary assessment
Body weight was measured to the nearest 0.1 kg and height to the nearest 0.1 cm using an appropriately calibrated scale and stadiometer. BMI and percent of ideal body weight (PIBW) were calculated. Subjects' dietary intakes were assessed by a well-trained registered dietitian using semi-quantitative food frequency questionnaire (SFFQ). The SFFQ was validated in a pilot study carried out with 20 men and women who visited the hospital for health screening. The SFFQ was compared with a 3-d diet record and was shown to provide a reasonable measure. Each subject was asked to report their usual frequency of consumption and usual portion size over the past year. The frequencies of consumption were measured on a 9-grade scale: never, 1 time/mo, 2 times/mo, 1 time/wk, 3 times/wk, 5 times/wk, 1 time/d, 2 times/d, and 3 times/d. During the interview, food models and reference utensils were shown to the subjects so that they could estimate portion size. Nutrient intake based on this information was calculated from food-composition tables in Korea [21]. Daily nutrient intake was calculated by multiplying the nutrient content of the specified portion of each food item by the frequency of its daily consumption and summing all the items.
Blood sampling and biochemical assessment
Blood samples were drawn in the morning after fasting overnight and were centrifuged to obtain plasma, which was stored at -70℃ until analyzed. Plasma concentrations of glucose, triglycerides (TG), and total cholesterol (T-Chol) were analyzed by a Reflotron System (Boehringer Mannheim, Germany). High density lipoprotein cholesterol (HDLC) was analyzed by an enzymatic method after precipitation with phosphotungstate and magnesium cation. Hemoglobin A1c (HgA1c) was measured using a Hematology Analyzer (IMX, USA) with micro-particle enzyme immunoassay kit (Astx-shield CO., Norway). Contents of low density lipoprotein cholesterol (VLDLC) and low density lipoprotein cholesterol (LDLC) were calculated by Fridewald calculation.
Statistical analysis
Group data are presented as means ± SD. Comparisons between treatment types were made by analyses of covariance. A P-value < 0.05 was chosen as the level of significance. General linear model (GLM) was used in the analyses to identify independent associations of dietary intake after covarying for age, treatment, sex, and duration, on metabolic risk factors. Independent effects of duration on dietary intake were identified after adjusting for age, sex, treatment, and 2-way interactions. Model coefficients were tested for significance. Residuals from the GLM were checked for normality. All analyses were performed with SAS 9.1 for Windows (SAS Institute Inc, Cary, NC).
Results
General characteristics of subjects
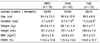
The subject characteristics are presented in Table 1. There were no differences between the treatment groups according to age, weight, height, body mass index (BMI), and percent of ideal body weight (PIBW). The percentage of BMI higher than 23, which is the cutoff for being overweight in Korea, was 68.5%, and the percentage of BMI higher than 25, which is the cutoff for obesity in Korea, was 40.5% in Korean individuals with diabetes. The duration of diabetes was the longest in the insulin group and shortest in the MNT group.
Daily dietary intake according to treatment type
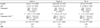
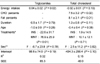
Daily energy and nutrient intakes are presented in Table 2. Energy intakes were almost identical among the three groups. For the men, there was an independent association between treatment type and carbohydrate and fat percentage of total energy intake. OHA group had a higher carbohydrate percentage of total energy intake, whereas the insulin group had a higher fat percentage of total energy intake. For the women, there was no significant difference between the groups.
Independent association of duration with carbohydrate, protein, and fat percentages of total energy intake
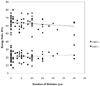
Using a general linear model, the relationship between duration and carbohydrate, protein, and fat percentages of the total calorie intake was assessed (Table 3), and the significance of each covariate (age, treatment, sex, and treatment-by-sex) was tested. Independent associations were observed for duration with carbohydrate and fat percentages of total energy intake. Carbohydrate percentage of the total energy intake decreased (-0.3% per 1 year of diabetes duration), whereas the fat percentage of total energy intake increased with duration of diabetes (0.3% per 1 year of diabetes duration; Fig. 1). No independent associations were found for duration with protein percentage of total energy intake.
Clinical characteristics according to treatment type and duration
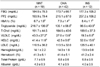
The mean values of clinical characteristics according to treatment type are presented in Table 4. There were no differences in fasting glucose, postprandial 2 hours glucose, T-Chol, LDLC, hemoglobin, hematocrit, total-protein, and albumin levels according to treatment type. The levels of HgA1c and HDLC were higher in the insulin group than the MNT and OHA groups. However, the level of HgA1c adjusted for duration, age, and sex was not higher in the insulin group compared to the other groups. TG and VLDLC levels were higher in the MNT group than the OHA and insulin groups. HgA1c and LDLC were independently associated with duration after covarying for age, sex, and treatment type.
Independent association of dietary intake with metabolic risk factors
The relationship between dietary intake and metabolic risk factors was assessed (Table 5). Independents associations were observed between calorie intake and TG level, and between carbohydrate and fat percentages of total energy intake with T-Chol level after adjusting for duration, age, treatment, and sex.
Discussion
It is recognized that dietary intake is important not only for the prevention but also the treatment of diabetes. In the current study on Korean type 2 diabetes patients, we found that the carbohydrate and fat to energy ratios were different according to the treatment type (MNT, OHA, and insulin) and duration of diabetes. In men, carbohydrate percentage of total energy intake was higher in the OHA group, whereas the fat percentage of energy intake was higher in the insulin group. Carbohydrate percentage of energy intake decreased, whereas fat percentage increased according to duration of diabetes. We also found an association between dietary intakes with metabolic risk factors in Korean individuals with diabetes. Energy intake was independently associated with the level of TG, and carbohydrate and fat percentages of total calorie intake was associated with the level of T-Chol. Dietary intake was also critical to metabolism and treatment of diabetes. Therefore, we speculate that more specific dietary intake recommendations according to treatment type and duration could be helpful for treating Korean individuals with diabetes.
The characteristics of Korean diabetes are different from Western diabetes. Insulin resistance in Westerners is complicated by the coexistence of obesity in 80% of patients with type 2 diabetes [22], but prevalence of obesity in type 2 diabetes was only 40% in Koreans [23]. In this study, the prevalence of obesity was 41% of diabetes patients and the total energy intakes were 2,392 kcal and 1,880 kcal in men and women, respectively. Reduction of energy intake is the most basic principle used in weight loss and diminishing insulin resistance. Further, reduced energy intake is associated with acute improvements in glycemic control, and it has the potential to benefit long-term metabolic control [24]. The mechanism of glycemic control can be explained by reduction of hepatic glucose output [5]. However, the contribution of insulin secretion to future weight loss and response to hypocaloric diets is controversial, and its effects are difficult to isolate from insulin resistance [25]. Reduced caloric intake positively affects dyslipidemia. Fifty percent of all diabetic patients have abnormal plasma lipid and lipoprotein levels, most commonly elevated triglyceride levels and reduced high density lipoprotein (HDL) cholesterol levels. TG levels typically fall maximally within 2 to 4 weeks of hypocaloric therapy, even in patients who do not show improved glycemic control [6]. In this study, energy intake was independently associated with the level of TG. There are needed to investigate the restriction of energy intake considering 60% of Korean patients with diabetes were not obese.
The association between dietary fat or carbohydrate content and insulin resistance is a topic of academic debate [26]. However, there are no clear recommendations on the appropriate macronutrient composition for reducing metabolic risk factors. Generally, carbohydrate intake represents 50~60% of the total caloric amount, and lipids no more than 35%, of Westerners with type 2 diabetes [27]. In the second edition of the Guidelines for Diet Therapy for Diabetes in Korea [28], the recommended intakes of carbohydrates, protein, and fat are 55~60%, 14~20%, and 20~25%, respectively. In our study, diabetes patients had 58~67% carbohydrate of total energy intake. Especially in the OHA group, the percentage of carbohydrate intake of the total energy intake was high.
The Korean traditional dietary pattern, characterized by high carbohydrate and low fat content, was previously compared with the Western diet. The average energy composition of the Korean diet was found to be 64.5% carbohydrates, 15.6% protein, and 20.5% total fat [29]. High carbohydrate intake in the Korean diet is mainly due to rice intake [30]. Otherwise, low fat intake can be explained by cooking methods and traditional dietary patterns, which typically comprise steamed rice, soup, kimchi, cooked or uncooked vegetables, and roasted or broiled meat or fish [31]. A higher carbohydrate ratio implies that Koreans with type 2 diabetes respond differently to acarbose compared to North Americans and Europeans [10]. The role of dietary carbohydrates in insulin resistance has been debated. High carbohydrate diets do not adversely affect insulin sensitivity [32,33]. McKeown et al. [34] found no association between total carbohydrate intake and HOMA-IR. Conversely, Lau et al. [20] reported that total carbohydrate intake is inversely related to HOMA-IR in Danish men and women. Several epidemiological studies [17-19] found that total carbohydrate intake is unrelated to fasting insulin and diabetes risk. In our study, there was no association between carbohydrates ratio of total energy intake and levels of fasting glucose, insulin, and HOMA-IR, although carbohydrate of total energy intake were associated with the level of T-Chol. Additional research is needed to clarify the long-term efficacy of carbohydrate restriction in Korean patients with diabetes.
A diet low in fat is commonly recommended for patients with type 2 diabetes to reduce the risk of atherosclerotic disease and to treat obesity. High intake of dietary fat, particularly saturated fat, was shown in some of studies to be associated with reduced insulin sensitivity [35,36]. In this study, fat percentages were higher than 25% in the MNT and insulin groups of men. Considering insulin therapy associated with weight gain [37], there is a need for additional fat restriction in insulin group. We also found that according to the duration of diabetes, the carbohydrate percentage of total energy intake diminished, whereas the fat percentage of total energy intake increased. And, fat percentages of total energy intake were associated with the level of T-Chol in this study. This means that Korean individuals with diabetes must carefully control their fat intake according to duration and treatment type.
This study was limited by inadequate dietary assessment, a small number of subjects, and incomplete control of confounding variables. Further, dietary intake was influenced by the physical activity and/or inactivity, for which no independent measures were acquired. The types of fat, such as saturated fat, polyunsaturated fat, monounsaturated fat, ingested as well as the glycemic index influenced metabolic risk factors. Additionally, the presence of unreported and undiagnosed conditions and dietary intakes that could affect metabolic risk of diabetes cannot be ruled out.
The independent association of dietary intake with treatment type and duration suggest that specific dietary recommendations may work better for identifiable groups of diabetes patients. Thus, a variety of strategies are needed for improvement of dietary intake recommendations.

 XML Download