

 PDF
PDF ePub
ePub Citation
 Print
Print


Introduction
Obesity has steadily increased world-wide [1], resulting in the emergence of various chronic diseases [2]. Consequently, the interest in weight control has become a matter of concern, as increased numbers of people attempt weight loss [3]. Weight control is desirable when it is for the maintenance of a healthy body; however, the supremacy of physical appearance in the modern era has caused more people to desire to become leaner and thinner [4]. Many people are dissatisfied with their looks in spite of having a normal body weight, as this misperception often leads to unnecessary attempts to lose weight [5]. Moreover, the overwhelming weight loss attempts by teenagers and those in their twenties have been identified as a major problem that can cause potential long-term health risks [6]. While some people try to maintain weight by adequate amounts of exercise and food intake, some choose inappropriate methods of weight loss due to personal financial conditions, social environment, and misperceptions. Incorrect usage of diet products, laxative medications, diuretics, appetite-suppressants, vomiting, and smoking are common examples [7]. This is becoming a social problem, particularly for teenage girls struggling financially, because many of them choose to fast and starve in order to lose weight.
Fasting has harmful influences on body metabolism [8], especially leading to gorging and weight gain. This yoyo phenomenon [9] is more apparent due to the misperception of weight loss and idle management after losing weight. Despite recent research on this yoyo phenomenon proving its harmful effects on health, many people still choose to fast in order to lose weight. Furthermore, people seem to disregard this yoyo phenomenon as being serious, and continue to fast after seeing the immediate effects.
Therefore, from a health point of view, there is an urgent need to identify the various effects of fasting and re-feeding on the body. However, with there being limitations to conducting repeated fasting-refeeding experiments in humans, animal experiments have been conducted to investigate effects on lipid and carnitine profiles. In this research, we used five groups of mice: one fed a normal diet while the others were subjected to fasting, and fasting-refeeding repeated once, twice, and three times, respectively. Food intake amount, body weight, serum and hepatic lipids, and serum and hepatic carnitine concentrations were compared and analyzed.
Materials and Methods
Animals
The animals used in this experiment consisted of thirty, 6-week old male ICR mice (Charles River orign: Jung-AngLab. Animal, Inc., Korea). The life span of a mouse depends upon many factors, as 1.5-3 years is considered their normal span of life with sexual maturity beginning after 50 days [10]. The indoor temperature during the experiment was maintained at 23 ± 1℃ with 53 ± 2% humidity, while light and darkness were turned on and off for 12 hours, respectively (08:00-20:00). This research followed the guidelines and regulations of the Jeonbuk National University (JBNU) Laboratory Animal Research Center, and was performed at the JBNU Nutritional Laboratory.
Experimental design and diets
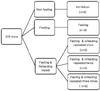
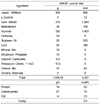
The experimental groups were each divided into five subgroups (Fig. 1): non-fasting (NF), 3 days fasting (F) experimental group, 3 days fasting followed by 4 days refeeding group (FRF1), 3 days fasting followed by 4 days refeeding repeated twice (FRF2), and 3 days fasting followed by 4 days refeeding repeated three times (FRF3). An AIN-93 control diet (NF; non-fasting, Table 1) was given with water without limitations.
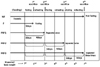
In order to calculate total feed-intake amount, the quantity of leftover feed in the non-fasting diet group was measured twice while the quantities for the fasting-refeeding groups (FRF1, FRF2, FRF3) were also measured twice before and after refeeding. After all the mice were maintained for a designated period of time as in Fig. 2, weights were measured in each group 7 times during the experiment, including the first day of fasting and on the day of refeeding, and then the mice were sacrificed. At the time of sacrifice, epididymal fat weights were measured followed by assessing the abdominal fat percentages of each group. After sacrifice, serum lipids and liver lipids were analyzed along with carnitine analysis.
Biochemical analysis
Total cholesterol along with TG in the blood and liver, were analyzed by an enzyme method (Asan Meds Kit). Blood HDL-cholesterol was measured using a Phosphotungstic acid-Mg enzyme precipitation method (Asan Pharm. Co., Seoul Korea), and blood LDL-cholesterol was analyzed by the Friedewald method (1972) [LDL-cholesterol = (total cholesterol)-(HDL-cholesterol)-( TG)/5] [11]. The analysis of blood and liver carnitine was performed by the method of Sachan (1984) [12], which is a modification of the radioisotpic method of Cederblad and Lindstedt (1972) [13].
Statistical analysis
SAS Ver.9.1 was used for the statistical management of all results from this research, and the outcomes are indicated as means ± standard deviations (SD). In order to identify the significance between each group, Student's t-test and one-way ANOVA were performed. Then, when a significant difference existed between groups, Duncan's Multiple Range test was used to separate differences at P < 0.05 and P < 0.001 levels.
Results
Dietary intakes and weight change
The mean daily food and energy intakes during the experiment period are shown in Table 2. Due to the peculiarity of the experimental design, significance verification was impossible, but it was clear that the FRF1, FRF2, and FRF3 groups showed tendencies of having higher intake on average than the NF group.
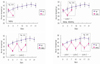
Weight changes in the mice during the entire experimental period are shown in Fig. 3 and Fig. 4. The trial groups, F, FRF1, FRF2, and FRF3, were compared with the control NF group, and are presented in Fig. 4 by comparing the fasting-refeeding groups based on their repetition terms. When the weights of the NF and F groups were measured before and after fasting (Fig. 4-a), the weight of the F group was similar to the NF group 3 days before fasting, but significantly decreased after fasting. When the weight of the NF group was compared with the FRF1 group, which repeated 3 days fasting followed by 4 days refeeding (Fig. 4-b), weight was significantly lower than in the NF group, although it showed an increase during fasting.
The weights of the NF group and FRF2, a twice repeated fasting-refeeding group, were separately compared, as FRF2 was divided again into a post 2nd-fasting group and a post refeeding group (Fig. 4-c). The FRF2 group showed a significant difference compared to the NF group, as weight dropped after fasting. On the other hand, weight increased after refeeding, but it was significantly lower than in the NF group. The weights of the NF group and FRF3, a three time repeated fasting-refeeding group, were also separately compared, as FRF3 was again divided into a post third time-fasting group and a post refeeding group (Fig. 4-d). FRF3 showed a decrease in weight after fasting, and indicated significant differences compared to the NF group. Weight increased again after refeeding; however, it continued to be significantly lower than in the NF group. The weights of all trial groups tended to decrease significantly when compared to the NF group. Although weight decreased during fasting, it showed a tendency to recover with refeeding, but was short of reaching the weight level of the non-fasting diet group.
Epididymal fat mass and liver size
The epididymal fat mass and liver weights of each group are shown in Table 3. The groups with repeated fasting and refeeding, F, FRF1, FRF2, and FRF3, all presented significantly low levels when body fat mass was compared with the non-fasting diet group. It also showed the same tendency when calculated with the fat mass per weight. Liver weight was significantly higher in the three groups that underwent repeated fasting and refeeding, while the lowest liver weight was found in the group that fasted for 3 days. Liver weight per body weight also showed a significant increase in the repeated fasting re-feeding groups compared to the group that only fasted. There were no differences between the non-fasting diet group and the fasting group.
Distribution of serum and liver lipid concentrations
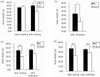
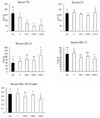
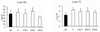
The serum lipid concentrations of each group are shown in Fig. 5. Although there were no notable differences in the total cholesterol of each group, triglyceride levels in FRF1, FRF2, and FRF3 were significantly lower than in the NF group. LDL-cholesterol was highest in the FRF3 group; while the level was relatively high when compared to the NF and F groups. HDL/TC values were significantly lower in the FRF3 group. Fig. 6 shows the results for the liver lipid concentrations of each group, in which differences in triglyceride and cholesterol were not significant.
Carnitine concentrations
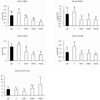
The results of serum carnitine concentrations for each group are shown in Fig. 7. NEC had a tendency to be significantly lower in FRF2 and FRF3 compared to the NF group. ASAC and AIAC also had a tendency to be significantly lower in FRF1, FRF2, and FRF3 when compared to the NF group; however, both the F group and total carnitine (TCNE) had a tendency not to show significant differences. When examining the carnitine concentration (ASAC+AIAC) containing an acyl-radical as well as the carnitine (NEC) ratio [(ASAC+AIAC)/NEC] by group, the FRF3 group proved to have significantly higher values than the NF, F, and FRF1 groups.
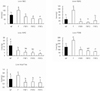
Hepatic carnitine concentrations are shown in Fig. 8. Hepatic carnitine levels in the F group were significantly higher than in the NF group, whereas the FRF1, FRF2, and FRF3 groups tended to have low values. FRF1 had significantly lower values than FRF2 and FRF3. The F group was also higher in ASAC than the NF group, while the numeric values for FRF1, FRF2, and FRF3 were significantly lower. No significant changes were noted between the three repeated fasting-refeeding diet groups.
AIAC was significantly lower in the F, FRF1, FRF2, and FRF3 groups when compared to the NF group, and FRF3 showed the lowest numeric value. The F group was significantly higher in total carnitine (TCNE) compared to NF, while the FRF1, FRF2, and FRF3 groups showed tendencies to be significantly lower. [(ASAC+AIAC)/NEC] percentages were highest in the F group, while NF, FRF1, FRF2, and FRF3 showed no significant differences between each other.
Discussion
Before the start of the experiment, there were no significant changes in amount of food intake or weight between each mouse group; however, a distinguishable change was noticed after repeating fasting-refeeding (Table 2 and Fig. 3). The overall weight of all trial groups tended to decrease significantly when compared to the non-fasting diet group. During fasting, weight decreased and then tended to increase again with refeeding, however, weight did not reach the level of the non-fasting diet group. This corresponds with the results of Lee and Kim [14] and Jen et al. [15] and Kochan et al. [16], who also performed experiments on fasting-refeeding. Epididymal fat showed a tendency to significantly decrease in all trial groups compared to the non-fasting diet group. Conversely, liver weight decreased significantly more in the fasting group compared to the non-fasting diet group; however, liver weight significantly increased when fasting-refeeding were repeated (Fig. 3 and 4). Kochan et al. (2001) reported that bodyfat and epididymal fat dropped remarkably in energy restricted rats compared to a non-fasting diet group without restrictions [17]. Horton et al. (1998) observed a decrease in liver weight during fasting, but reported that with refeeding, weight increased even more than the initial weight before fasting [18].
Epididymal fat weight did not show any significant changes even after refeeding, and its percentage of body weight also remained unchanged. This might be due to low levels of TG accumulation, and increased lipolysis induced by excessive fasting, which was necessary to produce energy being stored in the fat tissue during refeeding after fasting.
Björntorp et al. (1983) reported in his research that after fasting and refeeding, glucosidase inhibitors restrained the absorption of glucose which delayed the storing of TG within fat tissues [19]. Also, in Lee and Kim's research, they reported that fasting and refeeding had an affect on the consumption of leptin, adiponectin, and UCP1 more than it did on fat accumulation such as by LPL [14].
On the other hand, the increase in liver weight, which was higher than when a normal feeding protocol was used, is considered to have resulted from the tendency to store nutrients. The liver plays a role in glycogen synthesis and TG storage, and with fasting, excess nutritional loss occurs in the liver. Refeeding provokes active protein synthesis that helps with body component restoration [20] and adaptation, which allows the body to fight against future emergency situations. With the liver being the largest known nutritional storehouse in the body, an expansion in glycogen storage capacity would likely be responsible for the result.
In this research, repeated fasting-refeeding resulted in weight loss and decreased body fat, but also caused hypertrophy of the liver (Fig. 3, 4 and Table 3). An enlarged liver is usually caused by functional damage. The liver primarily stores glycogen, whereas TG is stored in only small portions, as it is regulated by choline, methionine, and lecithine, an anti-fatty liver element. There is a need to take this cautiously because when a functional problem exists in the liver, the balance breaks down and fat begins to accumulate, resulting in possible fatty liver formation.
Serum TG concentrations were significantly lower in all repeated (once, twice, three times) fasting-refeeding groups when compared to the normally fed group; the one time fasting group, although without significance, also showed a slight decreasing tendency (Fig. 5). As is well known, fatty acid and ketone bodies are used during fasting, which accompanies decreases in blood glucose, TG, leptin, and insulin [21]. Conversely, serum TG concentrations during refeeding not only decreased when compared to the non-fasting diet group, but also the fasting group. This result corresponds with Björntorp et al. (1982) [20], as it is considered that in order to expand the storage capacity of exhausted protein and energy, blood glucose and TG concentrations decrease.
In other research it has been reported that refeeding lead to a decrease in fatty acid concentrations and caused quick fat synthesis, resulting in increased blood glucose and TG concentrations [16,18,22,23]. Each of these studies varied in terms of fasting period, animals, and overall experimental design, which leads to many different interpretations. There are limits in accommodating all these factors; therefore, more diverse, detailed research is needed in order to compensate for previous problems.
Contrary to several reports on fasting-refeeding and its induction of liver fat synthesis [24-30], there were no significant changes in liver TG or TC content. However, serum LDL-cholesterol was highest in the three time repeated fasting-refeeding group, and its value was significantly higher when compared to the fasting group. Earlier studies also found the same type of relationship between fasting and increased ApoB gene expression and LDL production, which may be due to the inverse relationship between insulin deprivation and LDL production and LDL receptor-binding [31-33]. HDL-cholesterol showed contrasting results, as values were lowest in the three time repeated fasting-refeeding group. HDL/TC values, known to induce arteriosclerosis, were also lowest in the three time repeated fasting-refeeding group. Repeated fasting and refeeding did not affect TC content, however, it did increase LDL-cholesterol, which is a cardiovascular risk factor, and lowering HDL-cholesterol and HDL/TC percentage are believed to have adverse effects on the body.
In this research, NEC (free carnitine) concentrations did present significant changes when both the non-fasting diet group and fasting group were compared (Fig. 7). When compared to the non-fasting diet group, the fasting group had a tendency to have somewhat higher serum acyl-carnitine (ASAC, AIAC) concentration, but the results were insignificant. It was indicated that increases in acyl-carnitine (ASAC, AIAC) concentrations during fasting were highly related to increments in ketone bodies [34,35]. In the repeated (once, twice, three times) fasting-refeeding groups, NEC, ASAC, AIAC, and TCNE all had a significant lowering tendency in comparison with the non-fasting diet group and the fasting group, by having varying numbers of fasting-refeeding repetitions. For the liver, when the fasting group and non-fasting diet groups were compared, NEC, ASAC, and TCNE levels showed a significant increase in the fasting group, while AIAC decreased significantly (Fig. 8). As reported in the preceding research, during fasting, the oxidation of long-chain fatty acids increased while liver TG synthesis decreased. Following up on this research, we found that the carnitine transport system within the liver induces active fatty acid oxidation.
On the other hand, when fasting-refeeding were repeated once, twice, and three times, significant decreasing tendencies of NEC, ASAC, TCNE, and Acyl/Free were present in all groups. This shows that stored lipids decreased during fasting, which may have lowered the expression of beta-oxidation regulating genes.
In summary, our study shows that repeated fasting and refeeding in mice results in visible effects such as weight loss and body fat reduction. Repeated fasting increased hepatic hypertrophy conditions and decreased rates of fatty acid oxidation, which favored a recovery of body weight by energy conservation. It is also noted that LDL levels increased and HDL levels decreased, which may lead to cardiovascular disease risk. Further studies are required to assess cardiovascular disease markers during fasting and refeeding states. These findings support the yoyo dieting phenomenon's harmful effects on health. Therefore, we suggest further investigations and monitoring of the same parameters in clinically obese patients requiring treatment.


 XML Download