

 PDF
PDF ePub
ePub Citation
 Print
Print


Introduction
In Japan, the first school lunch was provided in Yamagata prefecture in 1889 [1]. During World War II, school lunch programs were discontinued and restarted again in 1946 after the war. The School Lunch Law was passed in 1954. One of the aims of school lunch programs is to improve nutritional status and to promote health. It is also expected to contribute to better eating habits of children [2]. Japanese school lunches consisted of staple foods (shushoku: rice, mixed rice, bread or noodles), main dishes and/or side dishes (okazu) and milk. One of the features of Japanese school lunch programs is that children serve the food by themselves. In 2007, 99.2% of elementary schools had school lunch programs (full meal: 97.9%, supplementary meal (offering main dish and/or side dish and milk without staple food): 0.5%, milk only: 0.8%) [3].
Ministry of Education, Culture, Sports, Science & Technology (MEXT) establishes guidelines for making school lunch menus [4]. Nutritional standards for energy, protein, total fat, salt (sodium), calcium, iron, magnesium, zinc, vitamin A, vitamin B1, vitamin B2, vitamin C and fiber are given according to four age groups (6-7 years, 8-9 years, 10-11 years and 12-14 years) without gender difference. The standards may be modified depending on the actual health and physical activity of children in different regions [4].
In Japan, plate waste is weighed for the evaluation of menus and to monitor levels of consumption, but most of the time it is weighed by the unit of class, grade, school or center of school lunch service [5]. Therefore, it is difficult to evaluate the amount consumed by each child. Few studies have tried to evaluate the school lunch consumption of each child [6,7]. However, studies on assessing amounts served and consumed of school lunch are limited. A study weighed plate waste, but average portion size was used for amount served [7]. The purpose of this study was to investigate the amounts served and consumed by children in school lunches at Japanese elementary schools where children directly participate in the serving process. In addition, gender differences in consumption were also studied.
Subjects and Methods
Participants and study design
A cross-sectional study was undertaken between October 2007 to February 2008. The convenience sample recruited was comprised of 267 fifth-grade children aged 10 to 11 years at one elementary school in Tokyo and three elementary schools in Okayama, Japan. Each school has one or two classes in the fifth-grade, and 11 to 40 children were in each class. Out of 197 children who participated in the study, five did not offer complete data for analysis; thus, 192 children were included for analysis.
The school lunch of the elementary school in Tokyo was prepared on the school's own premises, while school lunches at the three elementary schools in Okayama were prepared at a centrally-located school lunch service center. All school lunch menus were made following guidelines from MEXT [8]. Children ate their school lunches either in classrooms or lunch rooms, depending on the school. In all the schools, school lunch was served by the children themselves.
Data on eating and lifestyle habits were obtained by questionnaires. Questionnaires were distributed to children in their classrooms and collected by teachers. The questionnaires asked the children how much they consumed, with separate questions regarding staple foods and main dish and/or side dish consumption. Children chose among options such as "always eat all," "always take a second helping," "sometimes take a second helping," "sometimes leave food uneaten," and "always leave food uneaten". The children's heights and weights, as measured in April 2007 according to the School Health Law in Japan [9], were also obtained from each school.
We conducted the study using the weighed plate waste method, and observation of the school lunches for two non-consecutive days. All plates were weighed before and after eating using an electronic scale (No.1157. TANITA Corporation, Japan). Trained research staff (approximately ten children per researcher) observed the children while they were eating and noted estimated weight portions and which children were involved in food trades.
The weighed plate waste method was implemented as follows. After foods were served to children, research staff weighed each plate. If foods were served again (second helpings), plates were weighed again. Once children finished eating, they left the classrooms or lunchrooms, leaving the tray and tableware on the table with their number tags given before eating. Then research staff took pictures of the plates with number tags and weighed the plates. Pictures were used for confirming data.
Study protocol was fully explained to children and their parents by school teachers using pamphlets and letters in advance, and telephone numbers of researchers were given to the parents. The prior consent of children and their parents were obtained. The study was reviewed and approved by the Medical Ethics Committee of Kagawa Nutrition University.
Statistical analysis
The number of students who took second helpings before leaving their plates was counted from the weighed plate waste data. Body Mass Index (BMI) for each individual child was also calculated.
Standard serving portions decided by dietitians in each school were classified as the amount offered. The amount of food initially served to children was classified as the initial amount served. The total amount served was calculated by adding the size of second helpings to the initial amount served. The amount consumed was calculated by deducting plate waste from total amount served.
Nutrition analysis software called "Kokurakuchou version 2007" [10] was used to calculate energy and nutrients, using the 2005 Standard Tables of Food Composition in Japan [11]. The ratios of amount served to amount offered, and of amount consumed to amount offered, were calculated. The percentage of school lunches where the initial amount served and total amount consumed exceeded the amount offered were also calculated.
The data were analyzed with SPSS version 15.0. Gender differences in the number of students who took second helpings, or who left food uneaten, were examined for statistical significance using the chi-square test. Statistical significance of differences in anthropometric characteristics, initial amount served, total amount served, and amount consumed between genders were tested by independent t test. The correlation between anthropometric measurements and initial amount served, as well as amount consumed, were investigated by Pearson's correlation coefficient test. Cut-off of 0.05 was used as the level of statistical significance.
Results
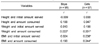
Table 1 summarizes the major characteristics, percentages of second helpings and plate waste, and anthropometric measurements data for the 192 children. The proportion of children who took second helpings of staple foods and of main dishes and/or side dishes for at least one day was higher in boys than in girls (respectively, staple foods: 42.1% vs. 9.3%, main dishes and/or side dishes: 68.4% vs. 44.3%, P < 0.001). However, there was no significant difference in plate waste by gender. No significant difference was found in anthropometric characteristics by gender.
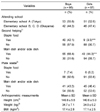
The correlation between anthropometric measurements and initial amount served and amount consumed is shown in Table 2. The initial amount served was positively related with BMI only in girls (0.238, P < 0.05). The amount consumed was positively correlated with weight in boys (0.222, P < 0.05) and girls (0.201, P < 0.05) and with BMI only in girls (0.244, P < 0.05).
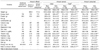
The nutrient content of school lunches offered, served and consumed is shown in Table 3. There were significant differences between genders in nutrient contents of the initial amount served, total amount served and amount consumed. All nutrient contents of the amount consumed except energy from fat were significantly higher in boys than girls. In addition, the ratios of initial amount served or amount consumed to amount offered were significantly higher for boys than for girls (the ratios of initial amount served to amount offered: 0.88 ± 0.11 vs. 0.84 ± 0.10, P < 0.05, the ratios of amount consumed to amount offered: 1.04 ± 0.19 vs. 0.88 ± 0.12, P < 0.001).
Details regarding consumption of main dishes and/or side dishes were asked by questionnaires. Of twenty children who answered "always take second helpings," all actually took second helpings during the study period. Of children who answered "sometimes take second helpings," 43 of 57 actually did so, while the rest did not. Among children who answered "sometimes leave food uneaten," 36 of 50 actually left some food uneaten. Finally, all four children who answered "always leave food uneaten" left some food uneaten during each meal in the study period.
The percentage of students served initially more than the amount offered was only 17.9% for boys and 10.3% for girls. After taking second helpings, however, the percentages changed to 50% for boys and 21.1% for girls.
Discussion
There were significant gender differences in the initial amount served, total amount served, and amount consumed in school lunches in this study. When comparing the nutrient content of the actual amount consumed with nutritional standards, for boys only fiber intake was lower than the nutritional standards, while for girls energy, protein, calcium, iron and fiber levels were all below standard.
Estimated energy requirement (EER) and references for some nutrients in dietary reference intakes for Japanese differs by gender [12]. However, in Japan there is no gender difference in the nutritional standards for school lunches [4,8]. In contrast, Korea breaks down nutritional standards in school lunch according to gender and grade [13], and the United Kingdom also recommends nutritional standards for single-sex secondary schools that are different from mixed-sex schools [14]. These findings suggest that nutritional standards for school lunch programs need to consider gender differences. Considering that elementary schools are generally mixed-sex and children directly participate in the serving process in Japan, further study is needed to examine the necessity and feasibility of incorporating gender differences in nutritional standards for Japanese school lunch programs, especially children aged ten to eleven years who are at an important developmental stage [15]. This study showed that more boys took second helpings than girls. It also demonstrated that the amount consumed was greater than the initial amount served as a result of second helpings. For boys, the setting of initial portion sizes need not be an important consideration since they feel little resistance to taking second helpings. However, for girls it is not realistic to assume that initial portion sizes can be easily adjusted by taking second helpings, due to their considerable reluctance to do so. One of the reasons why girls may be less likely to take additional helpings is that nutritional standard for energy intake is set by the mean of EER for boys and girls [8]; therefore, the initial serving may already be sufficient for some girls. Only 9.3% of girls took second helpings of staple food while 42.1% of boys took. It may be explained from the previous research suggesting that girls reported higher level of importance for avoiding weight gain on food choice [16]. Some studies demonstrated a high prevalence of weight-control behaviors among adolescents, particularly adolescent girls [17,18].
The results of this study suggest that it is essential to investigate second helpings when conducting this kind of dietary assessment. It is not sufficient to weigh plates only before and after eating.
In this study, the amount consumed was positively correlated with weight in boys and girls and with BMI only in girls. The positive relation between energy consumption and BMI was also reported in previous studies in Canada and Hong Kong [19,20].
Some studies conducted practice observations before data collection to familiarize children with an observer's presence [21,22]. In this study, practice observations didn't conduct, but daily consumption of school lunch were obtained by questionnaire. Questionnaire answers by children about their consumption of main dishes and/or side dishes were similar to their actual consumption patterns during the study period. This suggests that there is little risk that the presence of research staff had an undue influence on the children's consumption patterns.
The generalizability of our findings may be limited because the subjects of this study consisted of only four schools of Tokyo and Okayama. However, the average weight and height of children of this study were close enough to the same age and gender groups in the national survey [23].
 XML Download