

 PDF
PDF ePub
ePub Citation
 Print
Print


Introduction
Childhood, a fundamental period for physical development, is a stage in which intelligence and physical power are developing rapidly and active metabolism occurs [1]. Brich [2] reported that preferences for food during childhood affect food preferences and dietary habits during adulthood. Additionally, nutrient intake is critical for health and physical development; therefore, parents should be concerned with the dietary habits of their children [3].
Bad eating habits such as overeating, unbalanced diet, and frequent eating out can result in the intake of excessive amounts of salt and carbohydrates, which leads to childhood obesity, tooth decay, and iron-related anemia [4]. The induction of obesity in preschool children leads to adult obesity, which results in overweight, hypertension, diabetes, and hyperlipidemia [5-8]. Obese preschool children often suffer from growth disorders, mental disorders, and emotional disorders; all of which lead to other adverse effects such as the development of undesirable personality traits [9]. In previous studies [10-12], the energy intake of obese children was found to be higher than the average requirements, and the amounts of body lipids, triacylglycerol, serum LDL-cholesterol, and cholesterol have been found increased as the level of obesity increased, while the HDL-cholesterol levels were decreased with increasing levels of obesity. Robertson et al. [13] reported that a reduction in fat intake between the ages of three and seven led to the effective prevention of obesity.
In advanced countries, including the United States, obesity appears to be a large social problem and has already been thoroughly studied. Conversely, in the Republic of Korea, there was little interest in obesity until the mid 1990s. Nevertheless, many studies on obesity have been conducted, but few such studies have been conducted on preschool children [14-19]. Few detailed studies of obese and underweight individuals have been conducted [20-22], and these have only included partial concentrated areas.
Therefore, this study was conducted to generate basic and comparative data regarding the physical characteristics, dietary habits, nutrient intake, blood profiles, and mineral contents of preschool children to enable the prevention and cure of obesity. To accomplish this, preschool children (aged three to five years) were divided into underweight, normal, and overweight groups and the average values for the aforementioned parameters were then compared among groups.
Subjects and Methods
Subjects and study period
For this study, 921 children (age 3~5 y) were randomly selected from child education facilities such as kindergartens (10 sites) with consideration of their social economic level. The children were chosen in Seoul and Gyeonggi areas from September, 2001 to February, 2004. The experimental period was about 3 years long to get as many as subjects.
Anthropometric measurements
Height (Sam Hwa Co., Seoul, Korea) and weight (Model TBF-1, Tanita Co, Ltd, Tokyo, Japan) were evaluated by one well-trained person. Body fat was analyzed using a Tanita BIA UM018 (Bioelectrical impedance analysis). The triceps skinfold was measured using a caliper. Head, chest, hip circumference, and waist circumference were measured using a measuring tape. The head/chest ratio and waist/hip ratio were then calculated based on the measured values.
WLI (weight-length index) was used as the criterion of obesity and was determined based on the subjects' height and weight.
WLI (%) = A/B × 100
A : actual weight (kg)/actual height (cm)
B : 50th percentile expected weight (kg) for age/50th percentile expected height (cm)
Underweight : WLI < 90%, normal weight : WLI = 90-109.9%, overweight and obese : WLI ≥ 110%
Mini dietary assessment and types of snacks
Eating habits were assessed to judge the dietary habits using mini dietary assessments [23] composed of ten questionnaires. These questionnaires, which were filled out by parents, consisted of questions with a 3-point response scale (3: always agree~1: generally agree). The types of snacks consumed were also evaluated.
Dietary assessment and measurement
Dietary intake information was collected using food-frequency questionnaires [24]. Detailed descriptions of a total of 100 types of foods, including 14 types of grains and grain products, 10 types of meat products, 18 types of marine products, 13 types of fruits, 7 types of beverages, as well as information regarding snacks, dairy products, and others items, were collected.
Diet composition was analyzed according to each nutrient using the Computerized Nutrient Analysis Program 3.0 (CANPRO 3.0, 8th edition, 2005). The nutrient intake of each subject was assessed based on the estimated energy requirement (EER), estimated average requirement (EAR), and adequate intake (AI), which are commonly used to assess the standard intake of children aged 3~5 y in Korea [25].
Analysis of blood samples
The blood samples were collected and analyzed (ADVIA 120, Bayer, USA) for white blood cells (WBC), red blood cells (RBC), hematocrit levels, mean cell volume (MCV), mean cell hemoglobin level (MCH), mean corpuscular hemoglobin concentration (MCHC), and hemoglobin (Hb).
Serum samples were centrifuged at 3,000 rpm for 15min at 5℃ after being allowed to stand at 4℃ for 1 hour. For analysis of the ferritin, total iron binding capacity (TIBC), transferrin, transferrin Fe saturation, and iron, a 100 µl aliquot of the serum was placed into a microtube and stored at -70℃ until analysis. The level of ferritin was determined spectrophotometrically using a ferritin kit (Bayer, U.S.A) as previously described [26]. The total iron binding capacity (TIBC) was analyzed using a TIBC kit (RM 176-K, Elken, Japan) [27]. The transferrin level was determined using a transferrin kit (Behring, Germany), and the transferring level was analyzed using a Nephelometer (Behring Nephelometer, Germany). The iron concentration was determined using an automatic analyzer (HITACHI 7150, Tokyo, Japan) as previously described [28]. The serum transferrin Fe saturation (%) was determined as follows.
Transferrin Fe saturation (%) = (Serum iron/TIBC) × 100
The total protein levels were determined using a TP (Boehringer Mannheim, Germany) kit as previously described [29]. Serum samples were centrifuged at 2,500~3,000 rpm for 15~20 min and then analyzed using automatic analyzer (HITACHI 747, Tokyo, Japan). The IgA, IgG, and C3 levels were determined using IgA, IgG, and C3 kits (Behring, Germany) in conjunction with a nephelometer (Behring, Germany). The cholesterol level was analyzed using a cholesterol-R kit according to the manufacturers' recommendations (Youngdong Diagnostics, Korea). The level of triacylglycerol was determined using a TG kit (Bohringer Mannheim, Germany). The HDL-cholesterol level was analyzed using a HDL-C kit (Bohringer Mannheim, Germany) and an automatic analyzer (HITACHI 747, Tokyo, Japan). The atherogenic index (AI) was determined as follows.
AI (Atherogenic index) = {(total cholesterol-HDL-cholesterol)/HDL-cholesterol}
Mineral content in hair
The mineral content of the hair of 550 willing subjects who did not have hair dyeing was evaluated. Briefly, 2~5 g of hair were collected from each child and then analyzed for mineral contents using inductively coupled plasma mass spectrometry (ICP-MS).
Statistical analysis
Statistical analysis was performed using the SPSS by means of one-way ANOVA. Statistical significance among experimental groups was examined by Duncan's multiple range tests (version 13.0). Differences were considered significant at P < 0.05. Frequency, percentage, and differences among factors were analyzed by χ2-test (P < 0.05).
Results
Stratification of obesity based on WLI
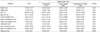
Child obesity was stratified into three groups based on WLI (Table 1). 64.9% of children were found to be in the normal range (WLI, 90~109.9%), while 13.5% had a WLI of less than 90% and 21.6% had a WLI of greater than 110%. Anthropometric characteristics of the subjects after stratification by WLI are shown in Table 2. The average height of the total subject population was 110.36 ± 7.01 cm, and the average weight was 19.49 ± 3.74 kg. The height of the underweight group, normal group, and overweight and obese group was 107.33 ± 6.24 cm, 109.47 ± 6.53 cm, and 114.93 ± 6.78 cm, respectively (P < 0.05). The weight of the underweight group, normal group, and overweight and obese group was 16.26 ± 1.86 kg, 18.64 ± 2.30 kg, and 24.08 ± 4.12 kg, respectively (P < 0.05). Overall, the height and weight of the subjects were 8.36 cm higher and 3.19 kg higher than the standard values (height 102 cm, weight 16.3 kg), respectively. Additionally, the average amount of body fat was 25.71 ± 16.02%, while this value was 30.54 ± 15.47% in the overweight and obese group, which was significantly higher than those of other groups (P < 0.05). The average values of the triceps skinfold, head circumference, chest circumference, hip circumference, and waist circumference were 24.61 ± 21.51 mm, 52.01 ± 3.77 cm, 57.84 ± 5.51 cm, 49.65 ± 19.83 cm, and 42.26 ± 16.37 cm, respectively.
Assessment of eating dietary pattern of children
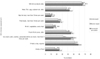
The serving of major food groups of the subjects are shown in Fig. 1. The intake of milk and dairy products by the underweight group, normal group, and overweight and obese group was 64.5%, 67.2%, and 65.8%, respectively, which did not differ significantly. In addition, the intake of kimchi, vegetables, fruits, and three daily meals did not differ significantly among the underweight, normal, and overweight and obese groups. Furthermore, there were no differences in the intake of ice cream, cake, cookies, and carbonated beverages more than two times weekly as snacks among the three groups. However, the intake of protein sources like meat, eggs, and beans for underweight children was 37.9%, while this value was 37.6% for normal weight children and 43.2% for overweight and obese children, which represented a significant difference between underweight and overweight and obese children (P < 0.05). Overweight and obese children also appeared to consume more fried and parched foods than underweight or normal weight children (P < 0.05). Moreover, only 16.9% of underweight children consumed three meals a day, while 24.6% of overweight and obese children ate three meals a day. Finally, overweight and obese children appeared to have the most evenly distributed meals among groups (P < 0.05).
As shown in Table 3, we graded the quality of the diets of the children as poor (= 17), fair (18~25), or good (26~30). The average score for the entire study group was 21.32 ± 2.55 point. Among the subjects, 5.1% of the children had a dietary score of excellent (above 26), while 3.1% had a score of poor (below 17). Children whose dietary quality was poor consumed less kimchi and vegetables and used less salt and soy sauce during meals (data not shown).
The children (51.2%~58.8%) had regular three meals, but 35.6% of children reported that their diets contained unbalanced foods.
Snacking by children
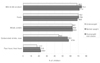
As shown in Fig. 2, the subjects primarily consumed milk, dairy products, and fruits as snacks. However, the overweight and obese children consumed more carbonated beverages, ice cream (57.8%), and fast and fried foods (22.6%) than the other groups (P < 0.05).
Assessment of nutritional intake
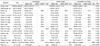
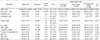
The nutrient intake of the three groups is shown in Table 4. The energy intake of the underweight group, normal group, and overweight and obese group was 1,563.10 ± 675.16 kcal (111.7%), 1,592.55 ± 720.79 kcal (113.8%), and 1,629.62 ± 556.22 kcal (116.4%), respectively. No differences in the intake of carbohydrates, protein, or lipids were observed among the three groups. The intake of vitamin A by all of the subjects was 734.70 ± 461.61 ugRE. The intake of vitamin B1, B2, B6, niacin, and vitamin C was slightly higher in the overweight group than the other two groups, but no significant difference in the intake of these compounds was observed among groups. Finally, no significant differences in Ca, Fe, Zn, P, and sodium intake were observed among groups.
Blood profiles
The WBC and RBC counts of 80~99% of the study participants were normal. However, 38.0% of children's Hb concentrations were under 12 g/dl. But only 7.6% of these children were anemic according to the standard level (11.1 g/dl) presented by the third National Health and Nutrition Examination Survey (NHANES III) [30]. Similarly, only 11.0% of children were found to be anemic based on the standard level of hematocrit (33%) specified in the NHANES III [30]. The average values of Hb in the underweight group, normal group, and overweight and obese group were 12.21 ± 0.77 g/dl, 12.23 ± 0.77 g/dl, and 12.43 ± 0.79 g/dl, respectively. The average Hb value of the overweight and obese group (12.43 ± 0.79 g/dl) was significantly higher than that of the other groups (P < 0.05). The hematocrit mean value of the underweight group, normal group, and overweight and obese group were 36.48 ± 3.09%, 36.86 ± 2.89%, and 37.43 ± 2.81%, respectively (P < 0.05). Moreover, 31.5% of children with serum ferritin values less than 20 ng/ml were found to be anemic. And 14.1% of children whose iron concentration was less than 60 ug/dl were anemic, as were 17.0% of children proved to be anemic compared to transferrin Fe saturation percent (15%). Although 7.6% to 17.0% of the children were anemic, a larger number of children (25%~32%) could easily become anemic due to a shortage of stored iron.
As shown in Table 6, 14.4% of children had serum protein concentrations below the recommended standard, and 5.6% of children had albumin serum concentrations below the normal level. However, all children had globulin levels that were within the normal range. Furthermore, the globulin serum concentration (2.75 ± 0.31 ml/dl) of the underweight group was greater than those of other groups (P < 0.05). 24.2% of children had below normal IgA concentrations, and children in the underweight and overweight and obese group had significantly higher IgA concentrations than children in the normal group. 3.8% of children had C3 in the shortage range, and this value was the highest in the overweight and obese group (123.93 ± 19.50 ml/dl) (P < 0.05).
As shown in Table 7, 89~99% of the children had normal cholesterol, triacylglycerol, and HDL-cholesterol levels. However, 10.7% of children had serum concentrations that were higher than normal. Nevertheless, the atherogenic index of all children was 2.37.
Mineral status in hair
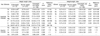
As shown in Table 8, the concentrations of Fe, Cu, Ca, Cr, Mn, Se, Na, K, Li, V, Co, and Mo in hair were all in the normal ranges. The concentrations of Zn in the underweight group, normal group, and overweight and obese group were 67.97 ± 28.51 ppm, 70.09 ± 30.81 ppm, and 73.99 ± 30.36 ppm, respectively. The Zn level of the overweight and obese group (73.99 ± 30.36 ppm) was below the normal level (180~220 ppm) (WHO Reference value). Additionally, the Mg level of all children was lower than the normal level (15~70 ppm), as was the P content (121.70 ppm~124.40 ppm) of all children (normal = 145~250 ppm).
The concentrations of the toxic elements Pb, Ba, Hg, Al, As, Cd, and U were all in the normal ranges. The Al contents of the underweight group, normal group, and overweight and obese group differed significantly, as indicated by values of 8.04 ± 3.43 ppm, 8.65 ± 4.15 ppm, and 9.50 ± 3.78 ppm, respectively (P < 0.05).
Discussion
Westernization of the dietary pattern, the simplicity of the everyday lifestyle, excessive nutrient intake, and the preference of foods have resulted in an increase in childhood obesity.
Additionally, the obese portion of the population is increasing. Indeed, recent reports of the nutritional management of obesity [9] have shown that, in 1984, the rate of obesity among male and female children was 9% and 7%, respectively, but that by 1994 this rate had reached 19% and 16% in male and female children, respectively. Furthermore, the rate of medium obesity has increased remarkably. In 1998 [31], the rate of obesity among male preschool children (2~6 y) in Seoul and its vicinity was 20.3%, while that of female preschool children was 12.0%. According to a survey of national health conducted in 2005 [32], 8.8% of children (5~9 y) were obese (male 8.3% and female 9.5%). A similar tendency of increasing obesity was reported in Japan, where, from 1973 to 1994, the rate of individuals with a weight higher than 120% of the normal weight has increased from 5% to 10% and the rate of individuals with a weight higher than 140% of the normal weight has increased from 1% to 2% [33]. Furthermore, according to a recent report in China [34,35], 14.1% of female children and 27.7% of male children were overweight or obese, which was double the number of overweight and obese children in China in 1989. Moreover, many recent studies have reported that morbid obesity is increasing in general. It has also been reported that it is necessary to observe the environments of children who are in their rapid growing period to prevent obesity [36]. Indeed, childhood obesity has become more serious than underweight among children because it leads to various diseases and can occasionally cause death [37,38].
The children participated in this study were from the families (monthly income 3 millions to 5 millions), which likely had an effect on the results of the study. Nevertheless, 64.9% of the subjects were found to have a normal weight (WLI = 90~109.9%), while 13.5% were underweight (WLI < 90%) and 21.6% were overweight and obese (WLI ≥ 110%) according to the WLI. These findings indicate that the physical development of children was delocalized into polarization.
The results of this study demonstrated that overweight and obese children consumed greater amounts of foods such as meat, fish, eggs, soy protein, fried foods, and deep friend foods than underweight or normal children (P < 0.05). The findings presented here also demonstrated that 24.6% of overweight and obese children have a better balanced diet than underweight or normal weight children (P < 0.05). Additionally, overweight and obese children were found to have a tendency to consume more carbonated soft drinks, ice cream, fast foods (57.8%), and fried foods as snacks (22.6%) than underweight or normal children (P < 0.05). Park et al. [39] reported that overweight children have a low preference for wild herbs, vegetables, and vegetable juice but have a high preference for bulgogi, ham, sausage, doughnuts, and cookies. In this study, average score of the dietary habit of the entire group of children was 21.32 ± 2.55 point, with 5.1% of children having excellent dietary habits and 3.1% having poor dietary habits. Evaluation of the questionnaires revealed that children with poor dietary habits had decreased intake of kimchi, vegetables, and meat. In general, children appeared to eat regular meals, but 35.6% of children reported that they had an unbalanced diet. Kerrey et al. [40] reported that the preferences and dietary habits of children were factors that decided their lifetime dietary habits and assessment. Additionally, according to Gibson et al. [41], the nutritional knowledge of the child's mother is associated with his or her fruit intake and dietary quality and the mother's vegetable intake has a positive effect on the dietary intake of her child [42,43]. Because current dietary habits of adults that have been formed during childhood are not easily changed, early dietary education is necessary to ensure that children develop balanced dietary habits.
In the present study, it was found that all nutrient (energy, protein, vitamin A, B1, B2, B6, niacin, vitamin C, E, folic acid, calcium, iron, zinc, phosphorus, and sodium) intake except fiber was excessive according to KDRI [25]. No differences were observed among groups, and the energy intake of the three groups was higher than the KDRIs values [25] for energy (1,400 kcal). The intake of vitamin A by all of the subjects was greater than that reported in the KDRIs (300 ugRE) [25]. Half of the subjects consumed more vitamin C than recommended by the standard (40 mg). Additionally, the intake of folic acid was greater than the required intake in all subjects (180 ug). The results of this study indicate that children need to consume more fiber because the intake of fiber of all three groups (23.6%~25.8%) was below the level of the KDRIs (3~5 y, AI : 17 g) [25] for fiber. To accomplish this, the intake of fruits and vegetables should be increased. No significant differences were observed in the overall nutrient intake among the three groups.
The plasma RBC, hematocrit, Hb, and transferrin levels of overweight and obese children were higher than those of underweight and normal weight children (P < 0.05). However, no differences in the plasma cholesterol, triacylglycerol, and HDL-cholesterol levels were observed among the three groups. The results of this study were different from those of a previous study [44], in which the plasma triacylglycerol, LDL-cholesterol, VLDL, and insulin levels were higher and the HDL-cholesterol was lower in overweight elementary school children than in underweight and normal weight children. In the present study, it is likely that no difference in plasma lipid profiles was observed because the subjects were aged 3~5 years, which is a basic period for physical development.
Among the total subjects, 7.6% were anemic according to the standard Hb level (Hb < 11.1 g/dl), 17.0% were anemic according to the standard %Sat level (%Sat < 15%), and 31.5% were anemic according to the standard ferritin level (ferritin < 20 ng/ml). In Canada, it was reported that 4~5% of children had a hemoglobin concentration of less than 100 g/L [45], while Winichagoon [46] reported that anemic rates were reduced from 41% to 25% in Thailand. In Cameroon, it was reported that 42% of children under the age of three were anemic and 21% of children aged 3~5 y were anemic [47]. In Zaire, 43% of children under the age of five were found to be anemic [48] ; meanwhile, 74% of children were reported to be anemic [49]. Although anemia occurs worldwide, it is concentrated in African countries and anemia among children is low in developed countries [50]. Additionally, intellectual instability has been found to affect the dietary habits and preference for foods and to result in physical and developmental retardation [51].
The mean values of Fe, Cu, Ca, Cr, Mn, Se, Na, K, Li, V, Co, and Mo in the hair of all children were within the reference values, but the mean concentration of Zn was much lower than the reference value. Additionally, the Zn concentrations of the hair of children in the present study were much lower than the Zn concentrations of hair in children aged 2~7 in the United States (100~210 ppm) and Poland (129.65 ppm) [52]. Senofonte et al. [53] reported that the concentration of Zn in the hair of children aged 3~15y in urban areas in Italy was under the reference value (150 ppm). Zn concentration of this study was in the range (30~13 ppm) of children in Korea which was leveled in the previous results by Park et al. [54] in 2006. Medically, a Zn deficiency is considered a hazard factor, and it has been found to be necessary to supply Zn to individuals with inadequate energy, to treat alcoholism and gastrointestinal disease, and to prevent the retardation of growth in children. For vegetarians, it is necessary to consume 50% more Zn than non-vegetarians because Zn absorption can be reduced by the components of vegetarian food [55]. Zn concentration in hair was varied according to species, age, gender, region, environmental factor, and individual character. Zn concentration was lower than standard values of other countries, but it will be serious problem in nutritional aspect.
New guidance and nutritional education are necessary to prevent the development of poor eating habits and unbalanced diets because they can lead the children to develop underweight, obesity, and anemia. Additionally, it is advisable to consult with a physician to determine if children are receiving adequate amounts of Zn and Fe. Taken together, the results of this study indicate that it is imperative for parents to ensure that their children develop good dietary habits and to manage the nutrition that their children receive.


 XML Download