

 PDF
PDF ePub
ePub Citation
 Print
Print


Introduction
The increasing prevalence of childhood obesity is a major health problem worldwide, because excessive bodyweight is a risk factor for future development of chronic diseases such as cardiovascular disease and type 2 diabetes mellitus [1]. The incidence of obesity in the 10-18 year old population has been increasing in Korea from 5.4% in 1998 to 11.3% in 2001 along with increased risks for cardiovascular disease (e.g. hypertension and hyperlipidemia) [2].
Epidemiological studies have shown that intrauterine growth pattern, weight at birth, early postnatal catch-up growth, and excess childhood weight gain are associated with an increased risk of adult cardiovascular disease and type 2 diabetes [3]. Higher birth weight is positively associated with subsequent greater body mass index, mostly lean mass in childhood and later life, while lower birth weight is associated with subsequent higher ratio of fat mass to lean mass [4,5].
Several studies have shown that birth weight is an important risk factor for insulin resistance which has multifactorial pathogenesis and is associated with cardiovascular risk, diabetes, hypertension, and a short lifespan [3,6,7]. Children born small or large for gestational age have an increased risk of insulin resistance, although the mechanisms underlying may be different between the cases [8,9]. Interestingly oxidative stress, a state of imbalance between the formation of oxygen free radicals and antioxidant defense system, is reported to be tightly linked to birth weight [10-12].
Recently, birth weight is reported to have a significant effect on the ghrelin level, a major orexigenic hormone [13]. Ghrelin, a 28 amino acid peptide, is predominantly produced in the gastric fundus which increases the sense of hunger and stimulates gastric emptying [14]. Ghrelin has a role in short-term regulation of energy homeostasis and also in long-term regulation of energy balance and body weight control [15]. Many studies have found that plasma ghrelin levels are lower in obese subjects than in normal weight subjects [16-18]. Darendeliler et al. [13] reported that non-obese prepubertal children born large for gestational age have lower ghrelin levels when compared with age and BMI matched appropriate for gestational age children.
However, there are no studies concerning the effect of birth weight on ghrelin levels in overweight/obese children who has altered metabolic state compared to the normal weight children. Therefore, I investigated primarily ghrelin levels according to birth weight and also the relationship between birth weight and insulin resistance as well as antioxidant status in overweight children.
Materials and Methods
Subjects
Thirty-four healthy overweight children aged 9-10 years (18 boys, 16 girls) participated in this study. Body weight and height were measured and body mass index (BMI) was calculated. Blood pressure was measured by a standard brachial cuff technique. Child overweight was defined more than 85th percentile of BMI according to appropriate BMI cutoff point for age and sex using Korean growth charts [19,20]. All children were born at term between 39th and 41th weeks of gestation. Their birth weight was answered by their parent and confirmed from their birth certificate card. No complication during pregnancy was reported. Venous blood samples were obtained from the forearm and collected into EDTA-treated and plain tubes during fasting. To further investigate the association between birth weight and insulin resistance, appetite related hormones, and antioxidant status, subjects were classified into three groups by tertiles of birth weight. Written informed consent was obtained from the children and their parents. The study was conducted in compliance with the "Ethical principles for medical research involving human subjects" of Helsinki Declaration [21].
Plasma lipid profiles, leptin, and ghrelin
Plasma total cholesterol and triglyceride were measured with commercially available kits (Choongwae, Seoul, Korea) by enzymatic methods. All determinants were done on a Hitachi 747 autoanalyzer (Hitachi, Tokyo, Japan). Radioimmunoassay was used to measure the plasma leptin concentrations using Packard Cobra II 5005 γ-Counter with Human Leptin RIA kit (Linco Research, St Charles, MO, USA). Total plasma ghrelin concentration was measured by radioimmunoassay (Phoenix Pharmaceutical, Belmont, CA, USA).
Serum glucose, insulin, C-peptide, and HOMA
Fasting serum concentrations of glucose was measured by a glucose oxidase method using a Beckman Glucose Analyzer (Beckman Instruments, Irvine, CA, USA). Insulin was measured by radioimmunoassay with commercial kits from Immuno Nucleo Corporation (Stillwater, MN, USA). C-peptide was measured by radioimmunoassay from Diagnostic Systems Laboratories (Diagnostic Systems Laboratories, Webster, TX, USA). I measured insulin resistance using the homeostasis model, in which insulin resistance (HOMA-IR) = fasting insulin (µU/ml) × glucose (mmol/L)/22.5 [22].
Plasma lipid-soluble vitamins
Plasma concentrations of retinol, carotenoids, tocopherols and coenzyme Q10 were determined simultaneously by reversed-phase high-pressure liquid chromatography (RP-HPLC) according to the method of Jakob and Elmadfa [23]. Briefly, plasma proteins were precipitated with ethanol and lipids were extracted with n-hexane. After evaporation, dry residue was redissolved with 150 µl of methanol-dichlormethane (85:15, v/v) and mixed and then 100 µl of this solution was injected into a guard column [Merck LiChrospher 100 RP18 (10 µm), 250 × 4 mm]. Samples were run at a flow rate of 1.0 ml/min on a Dionex HPLC system (Summit™ HPLC, USA). Absorption was monitored at 325 nm for retinol, at 295 nm for tocopherols, at 450 nm for carotenoids, and at 270 nm for coenzyme Q10. Concentrations were calculated from areas under the curve using an external calibration curve.
Erythrocyte antioxidant enzyme activities
GSH-Px was determined according to the method described by Beutler [24]. Erythrocytic hemolysate 10 µl preparation was added to 100 µl of 1 M Tris-HCI 5 mM EDTA buffer (pH 8.0), 20 µl of glutathione 0.1 M, 100 µl of glutathione reductase 10 U/ml, and 100 µl of NADPH 2 mM, and filled with H2O to a final volume of 1 ml. After 10 min of incubation at 37℃, the reaction was initiated by the addition of 10 µl of t-butyl hydroperoxide, and the absorbance was measured at 340 nm. The reaction was run for 90 s, and the loss of NADPH was monitored by the change in A340nm/min. Catalase activity was measured according to the method developed by Aebi [25]. Erythrocytic hemolysate 100 µl was dissolved in 50 mM phosphate buffer 50 ml (pH 7), and 2 ml of the mixture was added to a cuvette. The reaction was initiated by the addition of 1 ml of 30 mM H2O2 at 20℃. The H2O2 decomposition rate was measured at 240 nm for 30 s using a spectrophotometer. The SOD activity was assayed in erythrocyte-suspension by the procedure of Marklund and Marklund [26]. To 500 µl of the hemolysate were added 3.5 ml of water, 1 ml of ethanol and 0.6 ml chloroform. After the centrifugation at 3,000 IU/min for 2 min, various dilutions were prepared from the supernatant. 20 µl pyrogallol was added to each dilution after incubation at 37℃ for 10 min. The reaction was monitored spectrophotometrically at 320 nm for 2 min. The unit of the enzyme was defined as the amount which inhibits the autoxidation of pyrogallol by 50%. The hemoglobin contents of the erythrocytic hemolysates were determined using the kit assay (Boehringer Mannheim, Germany).
Statistical analysis
The SPSS 14.0 software package was used for statistical analysis. Data are presented as mean ± SD. All variables were examined for normal distribution as tested by Kolmogorov-Smirnov test and non-normally distributed variables were log-transformed. For descriptive purposes, mean values are presented on untransformed variables. I used normalized antioxidant vitamin values which were corrected for the sum of plasma cholesterol (mg/dl) and triglyceride (mg/dl) because of their interdependency in circulation as suggested by Thurnham et al. [27] and Horwitt et al. [28]. I used the Pearson correlation coefficient to evaluate the relationships of the variables. Differences in continuous variables among the tertiles of birth weight levels were evaluated by one-way ANOVA followed by the Bonferroni method. Values of P < 0.05 were considered to be significant.
Results
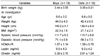
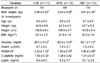
The clinical characteristics of the 34 overweight children (9-10 years) are summarized in Table 1. There was no significant difference in birth weight, anthropometric data, blood pressure, and hormone levels (HOMA-IR, leptin, and ghrelin) at investigation, according to sex.
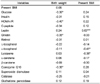
Table 2 shows the relationship of birth weight and BMI at investigation to the levels of insulin resistance parameters, appetite related hormones, and the levels of plasma antioxidant vitamins and erythrocytic antioxidant enzyme activities in overweight children. Birth weight was negatively correlated with insulin resistance parameters (fasting glucose, HOMA-IR) and also with ghrelin and coenzyme Q10 levels. There was a significant positive correlation between present BMI and leptin level, while a negative correlation was noted between BMI and α-tocopherol and lycopene levels. No significant relations were observed between plasma ghrelin and other analyzed parameters (data not shown).
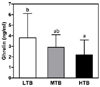
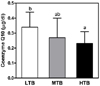
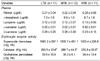
To further investigate the association between birth weight and present body size, insulin resistance, appetite related hormones, and antioxidant status, 34 overweight children were classified into three groups by tertiles of birth weight. There were no significant differences in body weight, height, or BMI at investigation (Table 3) among three groups. I found that the lowest tertile of birth weight (LTB) group showed higher levels of fasting glucose level and HOMA-IR than mid (MTB) or highest tertile of birth weight (HTB) groups. As shown in Fig. 1, LTB group showed higher level of plasma ghrelin than in the highest group. As for the effect of birth weight on the present antioxidant status, lipid corrected coenzyme Q10 level was significantly lower in the HTB group than in the LTB group (Fig. 2). In addition, the lowest catalase activity in erythrocytes was found in the HTB group compared to the mid or lowest groups (Table 4).
Discussion
The purpose of this study was to investigate the relationship between birth weight and appetite related hormones, insulin resistance, and antioxidant status in overweight children aged 9-10 years. It is well known that ghrelin level correlates inversely with adiposity at baseline [15], demonstrating that ghrelin level was increased in anorexia and cachexia [29], while decreased in obese subjects [16,17]. Interestingly, some studies reported that ghrelin is shown to correlate more significantly with body weight at birth than current body weight [30]. In accordance with these studies, the significant negative relationship could be found between plasma ghrelin and birth weight (BW) (r = -0.35, P < 0.05), but not between ghrelin and current BMI in overweight children in this study. Darendeliler et al. [13] demonstrated that plasma ghrelin level was significantly lower in appropriate for gestational age (AGA, BW: 3.12 ± 0.49 kg) than in large for gestational age (LGA, BW: 3.97 ± 0.52 kg) in non-obese children aged 4.4 ± 0.3 years. Most studies used percentile for gestational age of population-based birth weight (small for gestational age, SGA: < 10 percentile, AGA: between 10 and 90 percentile, LGA: > 90 percentile) as the cut off criteria of birth weight. When I applied that cut off criteria for Korean [31] in this study, however, only two or three children were allocated to SGA or LGA group which made hard to find any significance between the groups. Therefore, I classified the subjects into three groups by tertiles of birth weight. In accordance with Darendeliler et al. [13], I also found that overweight children with the LTB (2.98 ± 0.20 kg), which is similar to AGA BW in the above mentioned study, had significantly higher ghrelin levels than those with the HTB (3.81 ± 0.40 kg) at similar BMI levels. Ghrelin is known to be present in human fetal circulation from 20th weeks to term [32] and unchanged from birth to young adult [33]. From these findings including my results, it could be implied that the decreased levels of ghrelin in LGA born children either non-obese or overweight may play a physiological role in fetal adaptation to intrauterine milieu and also in the regulation of body weight in childhood. On the other hand, Iñiguez et al. [34] have reported that higher ghrelin levels were seen in SGA infants who showed greater infancy weight gain during the first year of life, suggesting that sustained orexigenic drive by increased ghrelin could contribute to postnatal catch-up growth. High ghrelin in the newborn SGA may be an important factor favoring accumulation of fat in later years [35]. In this study the accelerated growth rate and fat accumulation driven by higher ghrelin levels in the children with the LTB group compared to those with mid or the highest tertile BW among overweight subjects is thought to be one of main reasons for being overweight 9-10 years after birth.
Leptin, another orexigenic hormone, however, is found not to be correlated with birth weight, but to be strongly correlated with the current body weight, indicating that the plasma concentration of leptin is affected by body fat, the main secretory organ of letpin.
According to Eyzaguirre and Mericq [36], birth weight is one of the important risk factor for insulin resistance. In children and adolescents, several studies have reported a U-shaped relation between birth weight and insulin resistance or type 2 diabetes [37,38]. In other words, reduced fetal growth has been shown to be associated with the increased risk of insulin resistance, obesity, cardiovascular disease, and type 2 diabetes, especially when accompanied by weight gain during early life [39]. Being born large for gestational age has been also associated with an increased risk of insulin resistance [36]. In the present study, birth weight was also negatively correlated with plasma fasting glucose and HOMA-IR, a marker for insulin resistance, showing the significant increases in fasting glucose concentration and HOMA-IR in overweight children with the LTB than other groups. This finding is in agreement with previous data reported by Bouhours-Nouet et al. [40] who demonstrated that obese children with low birth weight (BW: 2.5 ± 0.4 kg) had higher HOMA-IR and lower muscle insulin sensitivity than those with high birth weight (BW: 4.3 ± 0.4 kg), and high weight gain after 4 years was associated with lower insulin sensitivity, suggesting that low birth weight and no early catch-up weight have been associated with increased risks of insulin resistance from childhood onward and later type 2 diabetes and cardiovascular disease. Brufani et al. [41] have also found that SGA obese children showed higher glucose area under curve (AUC) and lower insulinogenic and disposition indexes, suggesting that obese children with low BW resulted in an adverse metabolic outcome compared to obese children with normal and high birth weight.
A positive association between BMI and HOMA-IR in children and adolescents has been shown in several studies [42,43], while there was no correlation between current BMI and insulin resistance in the present study. The main reason for no correlation between two parameters might be due to the narrow BMI range, because the subjects in this study were limited to overweight.
Strauss [44] demonstrated that plasma levels of lipophilic antioxidants are significantly decreased in obese children. Increased expenditure and entrapment of lipophilic antioxidants in the adipose tissue have been reported in obesity [45]. It is also confirmed in this study that current BMI is negatively correlated with lipophilic antioxidant vitamin (α-tocopherol and lycopene) levels.
Regarding to the relationship between birth weight and oxidative stress, an increased hydroperoxide and carbonyl protein level, and decreased vitamin A and E have been recently reported in newborns with LGA (BW: 4.38 ± 0.07 kg) compared to those with AGA (BW: 3.29 ± 0.06 kg) [46]. Chiavaroli et al. [10] reported that LGA children regardless of their current weight showed higher levels of urinary isoprostane, a marker of oxidative stress, than AGA children. Similarly, I found here that overweight children with HTB had significantly decreased plasma coenzyme Q10, known as an effective inhibitor of oxidative damage in LDL, and erythrocyte catalase activity compared to those with LTB, indicating that the overweight children with higher BW showed increased oxidative stress. Based on these findings, it is speculated that overweight children born with higher birth weight might have altered metabolism of coenzyme Q 10 and catalase activity, which may contribute to the resulting risk of the complications (e.g. arteriosclerosis) related to obesity.
In summary, overweight children born full term with lower birth weight showed increased ghrelin levels and insulin resistance, while overweight children with higher birth weight experienced decreased coenzyme Q10 concentration and catalase activity. In addition, birth weight was negatively associated with ghrelin, insulin resistance, and coenzyme Q10 in overweight children. This study provides the evidences that birth weight might be an important factor for determination of treatment for obesity related complications in childhood obesity.
 XML Download