

 PDF
PDF ePub
ePub Citation
 Print
Print


Introduction
According to Korean nutrition and health surveys [1], prevalence of obesity gradually increases during adulthood for many Koreans, reaching peak values at 50-59 years of age in men (41.1%) and 60-69 years of age in women (46.7%). Above 60 years of age, the prevalence of metabolic syndrome is almost double in women compared to that observed in men (60.1% vs. 37.9%), which suggests that more attention is needed on the health status of elderly females [1].
The metabolic syndrome is characterized by improper blood lipid profiles, abdominal obesity, high blood glucose, and high blood pressure, and people with metabolic syndrome are at increased risks of coronary heart disease and diabetes [2,3]. Defay et al. [2] showed that among elderly individuals, abdominal fat accumulation in women was strongly related to the incidence of diabetes. The rate of mortality and disability is also positively associated with increased obesity up to the age of 75 years [3].
In spite of the importance of maintaining normal weight, obesity in the elderly was not considered a serious health problem in the past [4]. Therefore, our knowledge of the dietary habits and obesity-related behaviors of the elderly remains inadequately documented. In the case of older people, circumstances such as institutionalization, loneliness, or a sense of abandonment or uselessness, often lead to depression, which is a factor for elderly obesity [5,6]. Misperceptions about weight, especially in those who are overweight and obese, are also believed to be problematic when individuals fail to realize the health consequences linked to obesity and therefore do not make any effort to maintain a healthy weight [7]. Currently, there is limited information about obesity-related stress and misperceptions for elderly Koreans.
Obesity interventions in elderly should focus more on improving physical function and quality of life than on weight loss itself. Preventing the loss of muscle and bone mass that occurs during weight-loss should also be considered [2]. Therefore, physical activity recommendations in elderly should include the following factors: aerobic fitness, improving flexibility, balance [8].
Danhak exercise is characterized by strength and balance, and several studies have demonstrated the benefits of this exercise such as promoting ease of movement, minimizing risk of injury, greatly reliving stress [9-12]. However, most previous studies included young and middle-aged adults as study subjects.
Therefore, the purpose of this study was to determine obesity-related eating and behavior problems in elderly Koreans as a basis for future obesity intervention including behavior modification study, and to determine whether Danhak exercise is appropriate for improving health problems in elderly overweight/obese individuals.
Subjects and Methods
Subjects
For exercise intervention study, 42 overweight/obese elderly females who understood the objectives of the study and exercised less than once a month were selected through January-June, 2007. The subjects were residents of Changwon area and selected by the help of the Changwon branch of the National Health Insurance Corporation. These subjects had basic intellectual and activity abilities. Exclusions were made for all males and females who were taking vitamin supplements or any medications related to treating depression, diabetes, or high blood pressure. For the study regarding obesity related behaviors and eating habit in elderly subjects, 120 elderly individuals including all subjects who participated exercise intervention were surveyed by in-person interview or telephone through July - August, 2009. Obesity was classified by the BMI (Body Mass Index). BMIs were calculated using the measured heights and weights of the subjects and divided into one of three groups: normal weight (BMI ≦ 22.9), overweight (BMI = 23.0 - 24.9), or obese (BMI ≧ 25.0) [13].
Survey questionnaire
The questionnaire items for obesity-related eating behavior were developed and adapted from existing questionnaires [14-16]. The questionnaire included items in 3 areas: 1) the subjects' demographics, 2) their dietary habits and food preferences, and 3) the extent of obesity and obesity-related behaviors. The questionnaire for obesity-related behaviors: beliefs about obesity, food choices related to weight concerns, physiological eating behaviors, and obesity related-stress. The subjects were asked to provide answers using a five-point Likert scale ranging from not at all satisfied, scoring 1, to very satisfied, scoring 5.
Danhak exercise program
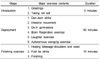
The Danhak exercise program commenced with 42 overweight/obese females, but only 35 of the female subjects completed the 6 month-exercise program. Exercise was performed 5 consecutive days per week, excluding Saturdays and Sundays, for 6 months from July 8 to December 10, 2007. The professional trainer conducted all exercises according to a designed program for one hour and twenty minutes each day. The program consisted of warm-up exercises for five minutes, main exercises for 60 minutes, and final stretching for 15 minutes (Table 1). The Do-In Gymnastics included some aerobic and muscle strength exercises such as shaking of the hands and arms, strengthening and tapping the abdominal area, stretching and pulling arms and legs [17]. During the test period, the subjects maintained their regular eating habit, but taking any vitamin or health food supplements was prohibited.
Physical and biochemical study
1) Anthropometric measurement
Body measurements were repeated at intervals of 4 weeks for a total of 6 times over the study period. Body composition, weight, height, and body fat were measured with a body composition analyzer (Inbody 3.0, Biospace Co., LTD). In addition to BMI, percent body fat (%) was calculated by body fat (kg) / weight (kg) × 100 and divided into 3 groups: < 27.9% normal, 28-32.9% overweight, ≧ 33% obese. Abdominal fat was estimated by measuring waist to hip (WHR) ratio using a measuring tape: the circumference of the waist at the height of the navel and the circumference of the hip at the most prominent area [18]. According to WHR, subjects were divided into 3 groups: WHR < 0.8 normal, 0.80-0.849 overweight, ≧ 0.85 obese.
2) Blood biochemical measurements
Blood samples were collected every 4 weeks for a total of 6 times over the study period. For each blood draw, the subjects were in a fasted state and 10 mL of blood was taken from the brachial vein using a disposable injector. The collected blood was immediately put into a glass tube coated with heparin, and centrifuged for five minutes, in which the upper layer liquid was separated and kept in a deep freezer at -70℃ until the time of analysis. Plasma triglycerides, total cholesterol, and HDL-cholesterol were measured with an automatic blood analyzer (Ekachem DTSC module, Johnson & Johnson, U.S.A), and LDL-cholesterol was obtained using the formula of Fridewald [19].
Statistical analysis
Data from 120 subjects who completed questionnaires and 35 female subjects who completed the exercise program were analyzed using the SPSS Pc+ Statistical Analysis System 12.0. The data from the elderly males were compared to those of the elderly females with each selected variable by using Student t-test for continuous variables and Chi-Square tests for categorized variables. Changes in anthropometric values and lipid profiles in 6 months were compared by using ANOVA test, and within group differences were determined by Duncan's post-hoc test. Spearman correlation coefficients were calculated between BMI and other related measures such as demographic variables and eating- and behavior-related variables.
Results
Results of the questionnaire regarding obesity related eating habits and behaviors in elderly people
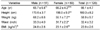
Table 2 shows the descriptive characteristics of the elderly subjects in this study. The study participants included 51 male and 69 female elderly individuals with a mean age of 66. Mean height, weight, and BMI were 160.3 cm, 58.9 kg, and 22.8 kg/m2, respectively. Mean BMI (kg/m2) was 24.8 for males and 23.1 for females. The mean waist circumference was 31.7 inch for females 33.3 inch for males and the difference was statistically significant (P < 0.05).
According to BMI classification, half of the elderly subjects (52.7%) were normal weight, 21.4% were overweight, and 25.9% were obese (Table 3). Two-thirds of the subjects (72.9%) having a normal BMI were accurate in their perceptions about weight. However, 66.7% of the overweight elderly subjects had incorrect weight perceptions by thinking they were normal weight, while 41.4% of the obese elderly subjects thought they were normal weight (P < 0.01). For the question "what do you wish for your weight", the obese (79.3%) and the overweight (58.3%) subjects answered that they wanted to lose weight (P < 0.001). Overall, 45.9% of total subjects answered that they want to lose weight.
In Table 4, a negative correlation between BMI and some variables, such as number of family, education level, and monthly income, was shown without statistical significance. The elderly subjects with higher monthly income also had higher degree of education (P < 0.01) and greater interests in health/nutrition information (P < 0.05). Those who lived alone were found to be more obese than those living with families.
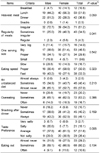
Dinner was the heaviest meal for the males (51.2%), while lunch was heaviest (56.3%) followed by dinner (28.2%) and breakfast (14.1%) for the females (Table 5, P < 0.05). Most of the males (72.7%) and 54.2% of females ate meals irregularly, which was significant (P < 0.05). More males reported liking salty foods compared to females (35.6% vs. 7.7%) (P < 0.05). More than half of the elderly subjects (63.2%) answered they sometimes overate, and 49.1% stated they always snacked after dinner.
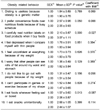
In Table 6, female subjects preferred convenience foods less than male subjects (P < 0.05) and females were more concerned with reading nutrition labels on food products (P < 0.001). Meanwhile, the females had more emotional eating habits than the males (P < 0.05). The heavier elderly subjects had more obesity-related stress, and stress-associated variables were positively correlated with BMI (P < 0.01). Those subjects with high BMIs responded to feeling more depressed (P < 0.01), lacking self-confidence (P < 0.01), having greater feelings of isolation (P < 0.01), and difficulties doing outdoor activities (P < 0.01).
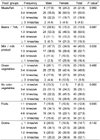
The elderly female subjects more frequently consumed beans/tofu, fruits, and vegetables on a daily basis while meat was more preferred by male subjects (Table 7). More females reported consuming servings of milk and dairy products daily compared to males (25.8% for females vs. 2.3% for males, P < 0.05). For total subjects, only 23.4% consumed green and yellow vegetables 1-2 time/day and 31.3% consumed fruit 1 or more times per day.
Results of 6 month Danhak- exercise intervention
For the exercise intervention study (Table 8), overweight and obese females, as determined by percent body fat (%), were recruited. The percentages of overweight and obese were 57.9% (20/35) and 41.1 % (15/35), respectively. According to BMI, 35% of the overweight subjects, determined by body fat (%), were within a normal range of BMI (20.7-22.9). All of the subjects had states of abdominal obesity (Mean WHR = 0.91, ranged from 0.86 to 0.99).
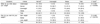
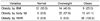
Table 9 shows the anthropometric changes after Danhak exercise. Weight was reduced from 58.2 kg to 56.9 kg after 6 months of exercise, but presented no statistically significant difference. BMI showed the same trend as the results of body weight, indicating a slight reduction without a statistically significant difference. In terms of body fat percentage (%), body fat was 32.4% prior to exercise and fell to 27.9 % after 6 month-exercise, showing a statistically significant difference (P < 0.05). WHR was also significantly decreased from 0.91 to 0.88 after 3 months of exercise and gradually decreased to 0.86 at the end of 6 months of exercise (P < 0.05).
The initial blood concentration of HDL was 45.6 mg/dl whereas TG was 179.1 mg/dl (Table 10). These values were within the health-risk range of metabolic syndrome, characterized by a TG level higher than 150 mg/dl and an HDL level lower than 50 mg/dl in females. Total cholesterol was significantly decreased from 207.1 mg/dl to 182.6 mg/dl after 24 weeks, showing a significant decrease (P < 0.05). No differences were found for blood TG or LDL cholesterol. In the case of HDL cholesterol, significant differences were found before and after exercise (45.6 vs. 50.6 mg/dl, P < 0.05).
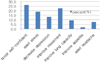
Additional effects of 6 month exercise besides improvements in blood lipids and weight reduction were shown in Fig. 1. The greatest benefits of Danhak exercise were boosted self-confidence (26.4%) and improved movement (22.6%) followed by stress-relief (18.9%) and decreased depression (13.2%). Some subjects also mentioned other benefits such as improved lung capacity, headache-relief, and enhanced appetite.
Discussion
The metabolic syndrome has become increasingly common and prevalent, especially in women over age 60, and abdominal obesity and dyslipidemia are major characteristics of the metabolic syndrome [1]. This study had two purposes. First, we wanted to determine the eating and behavior factors related to obesity in elderly individuals. Second, we wanted to examine whether long-term moderate exercise such as Danhak practice can reduce obesity and improve abnormal lipid profiles in elderly females. In this study, about 50-60% of the overweight and obese elderly had misperceptions about their body weight (Table 3). Misperception rates were found to be very high in older people compared to young and middle-aged adults [20,14]. High misperception rates in elderly subjects could be explained by the followings: First, older people may not understand what standard criteria for overweight or obesity are. Second, older people might feel less pressure for being overweight or obese due to cultural acceptance of higher body weights and heavier body shapes [21]. Third, the BMI cutoff points for Korean overweight (BMI 23-24.9) and obesity (BMI ≧ 25.0) of adult may not be appropriate for elderly people [2].
Since incorrect weight perceptions are associated with increased risk of obesity [14,22], it is very important for elderly individuals to recognize their weight correctly. Weight perception is also an important factor for effective weight management and a strong determinant of nutritional habits [22,23]. Although the use of self-reported anthropometric data in the questionnaire study is a weakness, this is the first study to address weight misperceptions in elderly people with statistical significance, and thus may provide valuable data for future research. Additional studies of large elderly populations are needed to clarify this association.
The female elderly subjects seemed to have better eating habits, more concerns for reading nutrition labels, and more frequency of fruits and vegetables on a daily basis than males (Table 5, 6). This is consistent with earlier studies showing that females were more likely than males to comply with dietary recommendations and preferred the taste of healthy foods [24-29]. Most of elderly subjects (70%) in this study appeared not to consume recommended daily servings of fruits and vegetables. In addition to low intake of fruits and vegetables, many of the elderly males had high preference for salty foods, which might increase the risk of hypertension [30,31]. To decrease health risk in elderly people, nutrition education especially targeted to elderly males is greatly needed and also effective methods for behavior modification to increase fruits and vegetable intakes and to decrease salt intake should be developed.
Although more subjects with higher BMIs had smaller numbers of family members, lower levels of education, and lower levels of monthly income, none of these was statistically associated with subject's BMI (Table 4). Among the eating habits and food preference, only two variables such as eating speed (P < 0.01) and snacking after dinner (P < 0.05) were found to be significantly and positively correlated with BMI (data not shown). The results of this study were not consistent with other previous studies [5-6,26-27]. Since this study only included 120 subjects, this could affect the results of the study. In regards to obesity related stress, similar to young and middle age-adults [23], the overweight and obese elderly individuals in this study were found to have feelings of stress for being obese and most wanted to lose weight (Table 3,6). It is believed that isolation from others and feelings of depression cause people to exercise less and consume more calories from sugars and fats, leading to poor health and nutrition [6].
The obesity intervention in this study focused only on 6-month exercise practices, not on the diet therapy for weight reduction. Some previous studies have shown that in older people, energy intake does not change or even declines with advancing age, and thus weight gain in elderly individuals is mainly caused by decreased physical activity [32,33]. Thus in our study, we asked the subjects to remain usual diet during the exercise intervention but to practice Danhak exercise regularly for 6 months, 5 times/week. As a result, body fat (%) and abdominal obesity (WHR) were significantly decreased after 3 months of exercise and gradually decreased until the end of 6 months of exercise (P < 0.05) (Table 9). Therefore, under the assumption of consistent calorie intake during the exercise intervention, we can conclude that the Danhak exercise regimen alone without calorie restriction was very effective at reducing body fat and WHR.
Such results are similar to findings that body fat was effectively decreased by long-term aerobic and resistance exercise programs [34,35], suggesting that Danhak exercise is as effective as either aerobic or resistance exercise to reduce body fat (%). The repeated abdominal breathing exercises in Danhak practice promote intestinal movement and improve digestion and constipation, and therefore enable to decrease percent body fat in the abdominal area. The abdominal movement exercise has an individual take in a maximum amount of air into the abdomen by breathing in, and thus causes the abdomen to swell. This is then followed by breathing out slowly and completely as if to attach the front of the abdomen to the back by pulling in at a maximum degree [17].
In terms of the effects of exercise on BMI, no significant reductions were found unlike those for body fat (%) and abdominal obesity. BMI is a measure of the relationship between height and weight, and studies demonstrated that the BMI values of older people were not well correlated with percent body fat (%) due to shortened height with aging, suggesting that body fat percentage (%) and abdominal fat (WHR) are better indices for estimating health risks and obesity in older people [36,37].
Dyslipidemia is common in the older population and its prevalence is much higher in females than in males due to hormonal changes after menopause [38]. The introduction of an exercise component early in obesity treatment, including aerobic and resistance training, has been found to be particularly beneficial for older individuals to improve abnormal blood lipid profiles [39]. Low blood HDL and high total cholesterol levels were significantly improved after 6 months of exercise in the study subjects (Table 10). Although several Korean studies have focused on the effects of aerobic exercise and weight training on improvements in blood lipid profiles [39-44], this is the first study showing the long term effects of Danhak exercise on blood lipid profiles, especially HDL and total cholesterol in elderly people.
Besides the effects of body fat (%) reduction and improvements in blood lipids, Danhak exercise also greatly improved self-confidence (26.4%) and feelings of depression (13.2%). Physical activity has been found to improve mental health, including depression and anxiety, as well as cognitive function in older adults [34]. Active lifestyles also often provide older persons with regular opportunities to create new friendships, maintain social networks, and interact with other people of all ages [45]. In this study, the subjects were 65 years old on average, and 70% of them were present during the 24-weeks of exercise. Based on this, the program appears to have good compliance by elderly subjects who may be seeking stability in their body and peace in the mind through exercise.
This study had several limitations. First, the subjects of this study consisted of only 120 elderly individuals for the questionnaire study and 35 for exercise intervention; therefore, the small sample size could have affected the results of the study. In addition, this study was conducted to specific elderly groups who do not have financial difficulty for living and get health check-up regularly. In the examination of food servings, we only asked the frequency about major food groups, not individual food items. Thus, interpretations of food frequency should be limited.
In conclusion, both male and female elderly Koreans with high BMIs had more obesity-related stress and highly incorrect perceptions of their weight. A 6-month Danhak exercise was beneficial to promote the health and living quality of old age by reducing body fat (%) and improving blood lipid profiles as well as improving mental health. For the health and well-being of older people, regular physical activity and behavior modifications focused particularly on dietary intakes of fruits and vegetables, weight misperceptions, self-confidence, and obesity-related stress could be beneficial.


 XML Download