

 PDF
PDF ePub
ePub Citation
 Print
Print


Introduction
Many developing countries face the dual challenge of addressing the coexistence of continuing under-nutrition and increasing rates of over-nutrition. The coexistence of underweight and overweight individuals poses a challenge to public health policies, since the strategies for reducing under-nutrition are obviously in conflict with those for preventing over-nutrition. In countries that have this double burden, detailed information on vulnerable populations for more targeted interventions at the household, community, and regional level are necessary.
One of the fundamental reasons for this dual problem is globalization. Globalization, such as trade liberalization, changes in global food market systems, and urbanization, has brought about a dietary transition. Global dietary trends have changed toward an increasing consumption of foods high in fats and added sugars due to the decreased prices of these food commodities. In addition, decreased physical activity due to industrialization and urbanization may also contribute to this dual problem of a coexistence of underweight and overweight individuals.
In Vietnam, obesity (BMI ≥ 25 kg/m2) increased from 2.0% to 5.2% whereas the prevalence of underweight individuals (BMI < 18.5 kg/m2) declined from 32.6% to 24.8% from 1992 to 2002 [1]. In 2004, the prevalence of underweight (BMI < 18.5 kg/m2), overweight (BMI 23-27.4 kg/m2), and obesity (BMI ≥ 27.5 kg/m2) for Vietnamese urban residents was 20.4%, 26.2%, and 6.4%, respectively [2], showing a clear indication of continuing under-nutrition and increasing rates of over-nutrition. Along with rapid economic development, Vietnamese have also experienced changes in their diet. According to a Vietnamese General Nutrition Survey [3], the proportion of energy derived from carbohydrates decreased but that from protein and fat increased from 1985 to 2000. In addition, based on a comparison of dietary data obtained from 1990 and 2000, the consumption of meat and total fat doubled, egg intake tripled, and fruit intake increased 10-fold.
There have been many studies on transitions in nutrition and the coexistence of under- and over-nutrition in developing countries such as China, India, Malaysia, Thailand and Vietnam [4-8]. However, to the best of our knowledge, few studies have investigated the relationship between dietary intake, eating behaviors and indicators of disease risks related to diet, and underweight and overweight. In addition, studies on dietary intake and disease pattern have been conducted in Vietnam but they have mainly focused on only urban residents [2,9-11]. Since people in urban and rural areas have different dietary patterns and eating practices, results from urban areas may not be fully applicable for designing programs and strategies to address the dual burden of overweight and underweight people in the rural areas. Therefore, the aim of the present study was to examine dietary factors related to underweight and overweight adult Vietnamese living in the rural areas of Haiphong, Vietnam.
Subjects and Methods
Study subjects
The participants were Vietnamese aged 19 to 60 years living in rural areas of Haiphong, the 3rd largest city in northern Vietnam. More than one third of subjects were skilled agricultural and fishery workers with low socioeconomic status. The subjects were family members and neighbors of Vietnamese female marriage immigrants to Korea participated in Cohort of Intermarried Women in Korea.
This study is one of the Korean Genome Epidemiologic study (KoGES), established since May 2001 in Korea. The aim of the KoGES is to examine genetic and environmental factors associated with chronic diseases with high morbidity and mortality such as diabetes, cardiovascular disease, and hypertension in Korea. For the baseline investigation, subjects received a telephone call or a mailed letter inviting them to attend a comprehensive health screening at three local clinical centers (Viet Tiep Hospital, Kien Thuy District Hospital, and Thuy Nguyen District Hospital) between August 13-17 in 2008. From the initial 551 subjects, 30 subjects without anthropometric (n = 13) and dietary (n = 17) data were excluded and an additional 24 subjects aged < 19 years (n = 21) or > 60 years (n = 3) were eliminated. Thus a total of 497 Vietnamese subjects were eligible for analysis. Subjects were classified as underweight (< 18.5 kg/m2), normal weight (18.5 kg/m2 - 22.9 kg/m2), and overweight (≥ 23 kg/m2) based on regional cutoffs of BMI defined by WHO [12]. The study protocol was approved by the human investigation review board of Ewha Womans University College of Medicine and informed consent for participation was obtained from all subjects.
General characteristics
Subjects were individually interviewed by trained technicians using standard protocols. A questionnaire was developed for this study and included age, education, income, employment, current alcohol consumption, smoking, and exercise status. Alcohol drinking was classified into current drinkers and non-drinkers (never- or ex-drinkers). Current cigarette smokers were defined as subjects who currently smoke and have smoked more than 4 packs in their life. Past smokers were classified into non-smokers. Regular exerciser defined as person who currently performs exercise enough to induce sweating regularly. Education status was categorized as completion of ≤ elementary school, middle school, and ≥ high school. Household monthly income status was classified as < 0.5, 0.5 - 0.99, 1.- 1.49, and ≥ 1.5 million Vietnamese Dong (VND) / month (1million VND = 56 $).
Eating habits and dietary intake
To assess eating habits, information on meal time regularity, meal speed, eating out, and overeating were obtained. Subjects were asked how often they consumed six different food groups (grains, vegetables, meats, fishes, fruits, and milk). Dietary intake was assessed using 24-hour recalls for 2 consecutive days and an average of 2 days was used as daily intake. Guidelines and photos for estimation of portion sizes were provided for trained interviewers majoring in Nutrition. Food intake was analyzed with the Computer Aided Nutritional Analysis version 3.0 (CAN-pro 3.0, Nutritional Assessment Program, 2006, The Korean Nutrition Society, Seoul, Korea) [13] and compared with the Vietnamese RDA [14]. To analyze food intake, Vietnamese foods were entered into CAN-pro food database program based on Vietnamese food composition database [15] and general cooking methods, which had been obtained through the interview with Vietnamese female immigrants in Korea. Portion sizes were determined based on the most frequently reported portion sizes according to 24HR data. However, the mean calcium intake of subjects was found to be unreasonably high. This was probably due to the unreasonably high calcium content of crab (5040 mg) and shrimp (1120 mg) in the composition table of Vietnam food compared to those in the Korean database (crab: 83 mg, shrimp: 55 mg) and American database (crab: 89 mg, shrimp: 52 mg). Therefore, calcium intake was reported with and without (indicated by adjusted Ca) subjects who had consumed crab or shrimp.
Anthropometric parameters and blood pressure
Anthropometric measurements were obtained by trained nurses or medical personnel. Standing height and body weight were measured using an automatic height/weight measuring instrument (Dong Sahn Jenix Co., Seoul, Korea). Body composition was assessed with an INBODY 230 (Biospace Co., Seoul, Korea). Waist and hip circumferences were measured with a tape measure (Anthropometric tape, Preston 5193, Seoul, Korea). These measurements were taken once. Systolic and diastolic blood pressures were measured using an automatic blood pressure calculator FT0500R (Jawon Medical. Gyeongsan, Korea), and read by attendant medical personnel after a 10-minute rest in the sitting position; the average of two measurements was used. Hypertension was defined as systolic ≥ 130 mmHg or diastolic ≥ 85 mmHg blood pressure.
Blood profiles
Blood samples were drawn by medical technicians after an 8-hr overnight fast, collected in EDTA-containing tubes, and centrifuged at 3500 rpm for 10 min at 4℃. The plasma samples were stored at -70℃ until analysis was performed. Serum hemoglobin, hematocrit, albumin, and protein were measured using an autoanalyzer (ADVIA 120, Bayer Diagnostics, Tarrytown, NY, USA). Anemia was defined as hemoblobin < 12 g/dl. Fasting blood glucose levels, total cholesterol, high density lipoprotein (HDL)-cholesterol, and triglycerides were also measured with an autoanalyzer (ADVIA 1550, Bayer Diagnostics, Tarrytown, NY, USA). Low density lipoprotein (LDL)-cholesterol was calculated as described by Friedewald. Abnormal values were ≥ 126 mg/dl for fasting blood glucose, ≥ 240 mg/dl for total cholesterol, ≥ 160 mg/dl for LDL-cholesterol, ≥ 150 mg/dl for triglycerides, and < 40 mg/dl for males and < 50 mg/dl for females for HDL-cholesterol.
Statistical analysis
The data were expressed as means and standard deviations (continuous) or as numbers and percentages (categorical). Differences between subjects in general characteristics, anthropometric parameters, blood profiles, and dietary intake according to BMI distribution were evaluated using the one-way ANOVA test after adjustment for age (Duncan's multiple comparison test between BMI groups) or a chi square test without non-responses, as appropriate. To test whether the percentage of subjects with indicators related to disease risk that were out of normal ranges increased across BMI distribution, a Mantel-Haenszel χ2 test for trend was used when the expected prevalence was ≥ 5. Furthermore, to assess whether eating habits and food consumption differed according to BMI distribution, a Mantel-Haenszel χ2 test for trend was used without non-responses. All analyses were performed using SAS 9.1 software (SAS Inc., Cary, NC, USA). Significance was defined as P < 0.05.
Results
Study population characteristics by BMI distribution
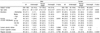
Average BMI was 21.0 ± 2.7 kg/m2 for males and 20.9 ± 2.6 kg/m2 for females (Table 1). The proportion of underweight, normal weight, and overweight individuals was 14.2%, 64.2%, and 21.6% for males and 18.9%, 60.5%, and 20.6% for females, respectively. In males, the percent of drinkers and smokers was 12.1% and 34.7%, respectively. However, most females were neither smokers nor drinkers. About 44.1% of males and 32.9% of females exercised regularly. According to BMI distribution, subjects in the overweight group were older than those in the other two groups in both genders (P = 0.0118 for males and P = 0.0002 for females). Female subjects in the overweight group were more likely to exercise regularly than those in under- and normal weight groups (P < 0.0001).
Anthropometric parameters, blood profiles, and prevalence of disease risk factors by BMI distribution
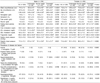
All anthropometric and hematologic variables except for triglycerides were within normal ranges in both genders (Table 2). In both genders, waist and hip circumferences and WHR were significantly greater in the overweight group than in the other two groups (P < 0.0001). The mean concentrations of total cholesterol, LDL cholesterol, and triglyceride were also significantly higher in the overweight group (P < 0.0001). Overweight females had higher fasting blood glucose levels than those in the other two groups (P = 0.0052). In male subjects, systolic (P < 0.0001) and diastolic (P = 0.0001) blood pressures were higher in the overweight group. For indicators of disease risk related to under-and over-nutrition, the prevalence of anemia was higher in females (19.5%) than in males (1.5%). The prevalence of hypercholesterolemia (16.3% for males and 13.8% for females), hypertriglyceridemia (53.0% and 45.5%) and hypertension (31.5% and 16.5%) was greater in males than in females, whereas the prevalence of hyper-LDL-cholesterol (9.4% and 10.7%) and hypo-HDL-cholesterol (18.1% and 47.1%) was higher in females. According to BMI distribution, the overweight group had the highest prevalence of hypercholesterolemia (P < 0.0001 for males and P = 0.0090 for females), hypertriglyceridemia (P < 0.0001 for both genders), and hypertension (P < 0.0001 and 0.0435). For female subjects, the overweight individuals had the highest prevalence of hyper-LDL-cholesterolemia (P = 0.0012).
Dietary intake
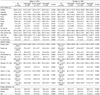
Subjects consumed cereals the most (about 40% of total food consumption) and eggs and milk the least (less than 1% of total food consumption) (Table 3). The total energy intake of male and female subjects was 2,024.6 ± 535.6 kcal and 1,808.4 ± 412.1 kcal, respectively. In both genders, the mean intake of energy, calcium, iron, vitamin A and vitamin B2 did not meet Vietnamese RDA and the mean vitamin A consumption was the lowest (around 30% of RDA) in both genders. In male subjects, there were no significant differences in food and nutrient intake according to BMI distribution. However, in female subjects, the overweight group consumed significantly less cereals (P = 0.0033), energy (P = 0.0046), protein (P = 0.0222), and carbohydrate (P = 0.0017), and more fruits (P = 0.0026) than the underweight group. The intake of total plant food (P = 0.0025), total food (P = 0.0038), iron (P = 0.0060), vitamin B2 (P = 0.0024), and vitamin C (P = 0.0007) were greater in the normal weight group than under- and overweight groups.
Eating habits and food consumption frequency
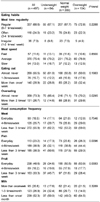
Approximately 55% of the subjects almost never ate out and 73% of subjects almost never overate (Table 4). Most subjects consumed grains (96.4%) and vegetables (93.9%) everyday (data not shown). The proportions of subjects who consumed meat, fish, and fruit more than 4-6 times per week were 44.2%, 62.0%, and 47.7%, respectively. Nearly 50% of the subjects consumed milk less than once per month. Thus, unlike other food groups, the frequency of milk consumption was divided into three categories: more than once/week, 1-3 times/month, and less than once/month. According to BMI distribution, the proportion of subjects who overate more than twice per week was highest in the overweight group (P for trend = 0.0295). In addition, the overweight group had the highest proportion of subjects who consumed fish (P for trend = 0.0096) and fruit (P for trend = 0.0083) everyday.
Discussion
A high prevalence of both underweight and overweight individuals was observed in this study, showing a clear indication of continuing under-nutrition and increasing rates of over-nutrition and their coexistence in the rural areas of Vietnam. The overweight subjects overate more frequently and consumed fish and fruits more often. The results of this study suggest that eating habits may be related to the prevalence of overweight Vietnamese living in rural areas.
Overeating refers to eating behaviors that are characterized by consuming a large quantity of food in one meal and thus repeated overeating may lead to an increased risk of an individual being overweight. Many studies have addressed the association between eating habits such as skipping breakfast, eating frequently [16], eating at night [17], eating until full, eating quickly [18], meal speed [19], and over-nutrition. Consumption frequencies of fish and fruit were related to subjects being overweight in the present study. This result is in contrast with previous studies that reported consumption of fruit and fish protected against the prevalence of obesity and chronic diseases in adults from 41 countries [20] and women in rural areas of Lublin, because a vast majority of overweight and obese women preferred fried dishes, red meat, and animal fats and did not consume enough vegetables and fruit [21]. It is not clear whether the frequent consumption of fish and fruit is related to the prevalence of an individual being overweight or if overweight subjects altered their food intake towards more fish and fruits because they were overweight. These two issues could not be resolved because of the nature of this cross-sectional study. Unlike the high frequency of consuming fish and fruit observed in overweight subjects, the amount of fish and fruit consumption measured in the 24-hr recalls did not differ by BMI distribution in males and females, but fish consumption was not greater in normal and overweight individuals than the underweight female subjects. This inconsistent result in the amount of fish and fruit consumed by overweight people could be explained by an underreporting of the actual food consumption, especially for high calorie food in overweight and obese individuals [22], since, unexpectedly, there were no differences in food and nutrient intake by BMI distribution in male subjects and the overweight group reported substantially lower cereal, energy, protein, and carbohydrate intake than the underweight female subjects.
Overweight subjects were older than under-and normal weight subjects in the present study. This result was similar to other studies, which showed that the prevalence of overweight progressively increased with advancing age [2,23]. This may be related to the decrease in the degree of physical activity from work with age, since a larger proportion of younger aged subjects were currently engaged in jobs that required a high physical activity such as famers and laborers (data not shown). Most studies reported that low levels of physical activity are likely to be linked to an increased risk of weight gain and over-nutrition [24,25]. The proportion of subjects that did regular exercise was highest in overweight females and low in overweight males. The gender difference in the perception of weight gain may be related to these exercise behaviors. Results from a previous study of Vietnamese in Ho Chi Minh City indicated that women that were overweight were more concerned about their weight than men and fatness in Vietnamese men was perceives as a sign of success and wealth [10]. Thus, overweight female subjects may make an effort to lose weight.
The subjects in our study consumed higher amounts of most foods compared to data obtained from the Vietnamese General Nutrition Survey [3]: higher intake of all food groups except for milk and eggs in male subjects and higher intake of all food groups except for cereals, eggs and, oil and fat in female subjects. Although a direct comparison is not possible because the Vietnamese General Nutrition Survey was conducted 8 years earlier than this study, there is a possibility that food intake by Vietnamese has been increased over this time period, as shown in previous studies [26]. Compared to the Vietnamese RDA, nutritional intake of our subjects was inadequate: total energy intake of our study subjects was about 80% of the Vietnamese RDA and consumption of most nutrients including calcium, iron, vitamin A, and vitamin B2 were below the Vietnamese RDA for both genders. However, compared to middle-aged Vietnamese living in the rural areas of Ho Chi Minh City [27], the subjects in our study had a higher consumption of most nutrients.
Mean blood concentrations of total cholesterol, LDL-cholesterol, and triglyceride were higher in the overweight group for both genders, consistent with previous studies [28,29]. Moreover, the prevalence of hypercholesterolemia, hypertriglyceridemia, and hypertension increased with increasing BMI. These results suggest that the probability of suffering from chronic diseases increases with increasing BMI. On the other hand, the prevalence of anemia in underweight and normal weight females was about 22%, which was twice that of the overweight females. Thus, the public health program and policy in this area should focus not only on decreasing the number of overweight individuals to prevent chronic diseases but also on limiting the number of underweight individuals to reduce the risk of malnutrition.
This study had several limitations that should be addressed in future studies. The relationship between dietary factors and underweight and overweight subjects was observed only in a cross-sectional setting. Therefore, we were unable to determine whether diet is a cause or consequence of weight status. The causality between diet and body weight should be evaluated in adult Vietnamese in a follow-up study. In addition, over- or underreporting of dietary intake consumed by the adult Vietnamese may bias the results. On the other hand, this was the first study that analyzed the relationship between dietary factors and BMI among adult Vietnamese living in a rural area. Second, the results of this study may be helpful for policy makers and dietitians in order to develop appropriate nutrition and health programs that address both overweight and underweight people living in rural areas, and can be the basis for further studies.
 XML Download