

 PDF
PDF ePub
ePub Citation
 Print
Print


Introduction
Increased blood pressure is a major cause of strokes, heart attacks, and heart failure [1]. Hypertension is an emergent risk factor that causes more than 7.1 million premature deaths a year worldwide, and it is becoming more prevalent in developing countries [2,3]. Although the prevalence rate of hypertension in Korean adults was decreased from 30% to 24.9% between 1998 and 2007, more than 45% of those who were 60 years old and older suffered from hypertension [4-7]. Recently, the treatment rate among those over age 60 was increased to above 64%. The population under age 49, however, had a treatment rate of less than 37% in 2007 [7]. This treatment rate is approximately 50% lower than the rate in the older group. It is crucial to examine the relationship between risk factors and blood pressure in those adults who are under 49 years old to prevent and manage hypertension in their later life.
Control rates for hypertension are poor and only 38.3% of diagnosed cases of hypertension are controlled in Korea [7]. Healthy lifestyles involving physical activity, diet, weight management, and moderate alcohol use are essential to the prevention and control of hypertension [8]. An increase in body weight or BMI raised the risk of hypertension by 1.6 to 1.8 times in Norway [9]. Persons with a BMI of 24 kg/m2 or more showed an increase in both systolic blood pressure (SBP) and diastolic blood pressure (DBP) [10]. Therapeutic approaches that focus on diet appear to be promising since metabolic researches and epidemiological data show that several nutrients are inversely associated with blood pressure. A previous research suggests that increasing the intake of potassium and calcium may reduce blood pressure, and other minerals are also related to blood pressure [11]. Sodium intake is considered to be a factor that increases blood pressure [12-14], while calcium intake may reduce blood pressure [15-17]. A research has also shown that the source of these nutrients (such as dairy products) is relevant to their effect on blood pressure [17]. In addition, a recent study of National Health and Nutrition Examination Survey (NHANES) III data also showed that subjects in the higher quartile of sodium intake were more likely to have a higher DBP [18].
In 2007, the sodium intake in the Korean population was 5,260.2 mg/day [7], which is not only 2.5 times higher than the recommended intake level for sodium for Koreans [19], but also exceeding the initial risk factor level of 3,500 mg/day that was proposed by Geleijnse et al. [20]. Moreover, calcium intake was 552.4 mg/day, which was lower than the 800 mg/day initial risk factor level proposed by Geleijnse et al. [20]. These nutrient intakes, as well as anthropometric indexes, may negatively affect blood pressure in Korean population. However, there have been few studies that address the relationship between dietary factors (sodium, potassium, calcium, etc) or anthropometric parameters and hypertension risk in data from the Korean National Health and Nutrition Examination Survey (KNHANES).
Therefore, this study was executed to use KNHANES III data to reveal the relationship of blood pressure to intakes of sodium, potassium, and calcium and to anthropometric parameters, such as weight, BMI, and waist circumference in young and middle aged adults. It is hoped that this study can contribute to the construction of a guideline for the prevention and treatment of hypertension.
Subjects and Methods
Study population
The data analyzed in this study were obtained from KNHANES III [6] conducted by the Ministry for Health and Welfare in Korea. KNHANES has been conducted every three years since 1998, and raw data are released to the public for scientific use. KNHANES consisted of a Health Interview Survey, a Health Behavior Survey, a Health Examination Survey, and a Nutrition Survey. The surveys used stratified multistage samples of the South Korean population from multiple geographic areas, ages, and sexes. Trained interviewers administered structured questionnaires in participants' homes to obtain information on sociodemographic characteristics, lifestyle, health, nutritional status, and the use of dietary supplements.
In total, 33,848 people responded to KNHANES III, but only 7,597 people participated in the Health Behavior Survey, the Health Examination Survey, and the Nutrition Survey. From this group, 2,761 adults (574 aged 19~29 years and 2,187 aged 30~49 years) were selected for the present study. Those who were 50 years and older were excluded due to their high treatment rates (over 54.9%) and high control rates (over 62.8%) [6]. Besides, hypertension prevalence are rather different between young adults (19~29 years) and middle aged adults (30~49 years), 3.0% and 14.6% respectively. Therefore, we classified the subjects into two age groups: young and middle aged adults.
Data from the Health Behavior Survey was used to obtain information on smoking, alcohol intake, and physical activity. Intakes of energy, sodium, potassium, and calcium were obtained from the Nutrition Survey, while data on height, weight, BMI, waist circumference, and blood pressure (SBP and DBP) were obtained from the Health Examination Survey.
Ascertainment of hypertension
Hypertension was indentified in individuals who met at least 1 of 4 criteria from the KNHANES III data: physicians' diagnosis of hypertension; self-reports of antihypertensive drug intake; SBP ≥ 140 mmHg; or DBP ≥ 90 mmHg. Blood pressure measurements were taken three times in a stable state, and the average SBP and DBP measurements were used to determine hypertension. A person has 120 ≤ SBP < 140 mmHg or 80 ≤ DBP < 90 mmHg was classified as the prehypertensive. A person has the normal or prehypertensive range of blood pressure was clustered as the normal group.
Statistical analysis
As part of the standard KNHANES data collection protocol, 24-hour dietary recalls were elicited and used to estimate intakes of energy, sodium, potassium, and calcium. General information, nutritional status, and anthropometric data were compared between the two age groups. In addition, sodium, potassium, and calcium intakes of the two groups were calculated per 1,000 kcal of energy. Income groups were categorized according to average monthly income in 2005 in relation to the minimum cost of living. Low income was defined as an average monthly income that was, at most, 1.2 times the minimum cost of living; middle income was defined as an average monthly income that was 1.2 to 2.5 times the minimum cost of living; and high income was defined as an average monthly income that was more than 2.5 times the minimum cost of living. Subjects were categorized based on their educational level, defined as middle school or less (9 years and below), high school (10~12 years), and college or more (13 years or more). Present smoking status was used to classify each subject as a 'current smoker', 'ex-smoker', or 'non-smoker'. Metabolic Equivalent of Task values (METs) were used to classify physical activity as low, middle, or high. METs are multiples of the resting metabolic rates and were calculated using the short form (version 2.0, April 2004) of the International Physical Activity Questionnaire, that is, low activity was 600 > MET-minutes/week, middle activity was 600 ≤ MET-minutes/week < 3,000, and high activity was 3,000 ≤ MET-minutes/week.
All analyses used survey weighting to account for the complex survey design that consisted of multistage, stratified, and clustered sampling. Probability sampling weights were used with strata and primary sampling units in the data analysis. Subject characteristics were compared between two age groups (19~29 years old and 30~49 years old) using a chi-squared test. Mean values and standard errors for anthropometric data and nutrient intakes were adjusted for sex and compared between two age groups using t-test. Also, mean values and standard errors for anthropometric data, sodium, potassium, and calcium intakes were adjusted for sex and compared between the normal group and hypertensive group using t-test.
The relevance of blood pressure (SBP and DBP) and risk factors such as age, sex, BMI, weight, waist circumference, and sodium, potassium, and calcium intake was determined by multiple regression analysis. Multiple regression analysis was performed for the two age groups separately, and all models were adjusted for energy intake, smoking, alcohol drinking, drug treatment, and physical activity. Previous researches reported that lifestyles such as smoking, alcohol drinking, and physical activity are the factors influencing blood pressure [21-23]. Thus, this study selected these factors as compensation variables in order to reflect ahead of energy intake and drug treatment.
In order to conduct multiple regression analysis to identify risk factors influencing blood pressure, we selected 4 types of models based on Table 3. We selected age and sex variables as independent variables in all 4 models due to its effect on blood pressure. Therefore, independent variables of each model were as follows: Model 1 - age, sex, BMI, sodium intake, and potassium intake; Model 2 - age, sex, BMI, sodium intake, and calcium intake; Model 3 - age, sex, sodium intake, weight, and waist circumference; and Model 4 - age, sex, weight, waist circumference, sodium intake, potassium intake, and calcium intake. All statistical analyses were performed using SAS software (version 9.12, Cary, NC, USA) and SUDDAN software (release 9.0, Research Triangle Institute, Research Triangle Park, NC, USA) and using a significance level of P < 0.05.
Results
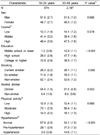
General characteristics of the participants in two age groups are shown in Table 1. There was a significant difference according to education level and smoking status between two age groups (P < 0.001 and P = 0.002). The participants who had achieved an education level of college or higher accounted for 72.8% in the 19~29-year-old group, while those in the same education level were 39.5% of the 30~49-year-old group. The ratio of non-smokers to current smokers and ex-smokers in young adult group was higher than the ratio in middle aged group; current smokers accounted for 26.3% in the 19~29-year-old group and 28.1% in the 30~49-year-old group (P < 0.001). There was a significant difference in hypertension prevalence according to age between two age groups: hypertension prevalence rates of 19~29 year-old and 30~49 year-old group were 3% and 14.6%, respectively. Also, prehypertension rates of two age groups were 29.1% and 31.3%, respectively (P < 0.001). However, there was no significant difference according to sex, household income, alcohol drinking, or physical activity between two age groups.
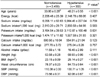
Sodium, potassium, and calcium intakes, anthropometric indexes and blood pressure in the normal and hypertension groups are given in Table 2. There was significant age difference between the normal and hypertension group; average age of normal group was 33.86 years and that of hypertension group was 40.21 years (P < 0.001). There were no differences in energy, sodium, potassium, calcium, and alcohol intake between the normal and hypertension groups. Weight, BMI, and waist circumference were significantly different between the normal and hypertension groups; the hypertension group had higher weight, BMI, and waist circumference than the normal group (P < 0.001). Obviously, the hypertension group had higher SBP and DBP than the normal group (P < 0.001).
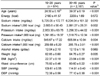
Sodium, potassium, and calcium intakes, anthropometric indexes and blood pressure in two age groups are given in Table 3. There was no difference in energy intake between two age groups. However, persons aged 30~49 years had significantly higher sodium, potassium and calcium intakes than those aged 19~29 years. Each intake of sodium, potassium and calcium per 1,000 kcal also showed the same trends. There was no difference in alcohol consumption between two age groups. All anthropometric indexes including weight, BMI, waist circumference were significantly different between two age groups; middle aged adults had higher weight, BMI, and waist circumference than young adults (P < 0.001). Persons aged 30~49 years had higher SBP and DBP than those aged 19~29 years (P < 0.001).
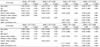
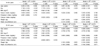
Multiple linear regression analysis was conducted for the two age groups separately to determine the relevance of blood pressure (SBP and DBP) and dietary factors after adjusting for confounding variables. As shown in Table 4 and Table 5, the variables included in each model (1, 2, 3, and 4) accounted for between 0.306 and 0.319 R2 of the variability in SBP in the 19~29-year-old group, and between 0.267 and 0.276 R2 of the variability in SBP in the 30~49-year-old group (Table 4). In the 19~29-year-old group, sex and BMI were significantly associated with SBP. Sex was inversely associated with SBP in all four models, whereas BMI was positively associated with SBP in models 1 and 2 (P < 0.001). In model 3 and model 4, weight was positively associated with SBP (P < 0.004). Other risk factors such as waist circumference, sodium intake, potassium intake, and calcium intake did not affect SBP. In the 30~49-year-old group, age, BMI, and waist circumference were positively associated with SBP (P < 0.001), whereas sex was inversely associated with SBP (P < 0.001). Weight was positively associated with SBP in this age group in model 4 (P = 0.039). Sodium and potassium intake did not affect SBP, although calcium intake appeared to be a dietary factor that reduced SBP in model 2 (P < 0.05).
The variables included in models 1, 2, 3, and 4 accounted for between 0.200 and 0.224 R2 of the variability in DBP in the 19~29-year-old group, and between 0.274 and 0.277 R2 of the variability in DBP in the 30~49-year-old group (Table 5). In the 19~29-year-old group, sex was inversely associated with DBP in all models, whereas BMI was positively associated with DBP in models 1 and 2 (P < 0.001). Age was positively associated with DBP in model 4, and weight was positively associated with DBP in models 3 and 4 (P < 0.001). In the 30~49-year-old group, age was positively associated with DBP and sex was inversely associated with DBP in all models (P < 0.001). BMI was positively associated with DBP in models 1 and 2 (P < 0.001). In model 2, calcium intake was inversely associated with DBP (P < 0.010). Sodium and potassium intake did not show any relevance to DBP in models 1 and 4. Weight and waist circumference, in addition to age and sex, were factors that were associated with an increase in DBP in models 3 and 4.
Discussion
In the present study, we used KNHANES III to analyze the effects of sodium, calcium and potassium intakes and anthropometric parameters on blood pressure in the 19~49-year-old Korean population. The main results of this study were that waist circumference, weight, and BMI were positively associated with SBP and DBP in multiple regression models in this population. Among dietary factors, calcium intake was inversely associated with both SBP and DBP (P = 0.012 and 0.010, respectively) in 30~49-year-old Korean population.
Several studies have reported that BMI is associated with hypertension risk or blood pressure [10,14,24-27]. Meta-analysis of cross-sectional data from 16 cohorts of the Epidemiology Collaborative Analysis of Diagnostic Criteria in Asia Study group revealed that hypertension in men was more strongly associated with BMI (P = 0.001) than with waist-to-hip ratio (WHR). In women, hypertension was more strongly associated with BMI than with other indicators including WHR, waist circumference, and waist-to-stature ratio [26]. The present study confirmed the positive association between BMI and blood pressure in both age groups. After adjusting for energy intake, smoking, alcohol use, drug treatment, and physical activity, however, other anthropometric parameters were differently associated with blood pressure in the two age groups. Waist circumference was positively associated with SBP and DBP in the 30~49-year-old group while weight was significantly associated with SBP and DBP in the 19~29-year-old group and DBP in the 30~49-year-old group.
There is an abundance of scientific evidence demonstrating a direct correlation between sodium intake and blood pressure [8,18,28]. Although there were national differences among western societies, high sodium intake raised the population attributable risk percentage (PAR %) of hypertension by 9-17% [20]. A cross-sectional study in China also demonstrated that sodium intake increased hypertension to 1.479 times (odd ratios (ORs), P = 0.002) in both Guangxi Bai Ku Yao and Han populations aged 15~89 years [10]. Schroder et al. [14] reported that sodium intake increased DBP in normotensive and non-medicated hypertensive subjects in a Mediterranean population. A recent study of NHANES III data also showed that subjects in the higher quartile of sodium intake were more likely to have a higher DBP [18]. In the present study, the use of multiple regression models did not associate sodium intake with SBP or DBP in both age groups. This discrepancy may be the result of limitations of national level cross-sectional data, even though the data were adjusted for confounding factors. The variation in sodium intake was more than double the variation in calcium or potassium intake (Table 3). KNHNAES III collected dietary data for one day. Single-day dietary recalls are known to be imprecise at the individual level, and the usual dietary intake of individual subjects may not have been accurately assessed. The variation in intake data may have been reduced by collecting dietary data over several days. The high sodium intake level may also be a contributing factor. The mean sodium intake in the present study was over 5,000 mg/day, which is 2.5 times higher than the recommended intake level for sodium [19]. We also conducted logistic regression analysis that adjusted for sex, age, income, education, smoking, and energy intake between normotensive and hypertensive subjects (data are not shown). Indeed, the results of the multivariate ORs and crude ORs did not differ significantly between sodium intake and hypertension prevalence (P for trend = 0.119 and 0.721, respectively).
It is widely hypothesized that an appropriate potassium intake will lower hypertension risk. However, epidemiological evidence of the effect of potassium on blood pressure is inconsistent [29]. Geleijnse et al. [20] reported that low potassium intake substantially contributes to the prevalence of hypertension; they suggested that in five western countries the PAR% of hypertension caused by low potassium intake was between 4% and 17%. Potassium intake tended to be inversely associated with DBP in the 30~49-year-old group in the present study (P = 0.053), however, a significant relationship was not observed.
Metabolic and experimental studies have reported that calcium may play a role in the regulation of blood pressure. Several epidemiological studies have reported that people who have a higher intake of calcium tend to have lower blood pressure. Dickinson et al. [30] conducted a meta-analysis and demonstrated that calcium supplementation is effective in lowering blood pressure and hypertension risk. They analyzed 13 randomized controlled trials and found that participants receiving calcium supplementation, when compared to controls, had a statistically significant reduction in SBP (mean difference: -2.5 mmHg, 95% CI: -4.5 mmHg to -0.6 mmHg) but not in DBP (mean difference: -0.8 mmHg, 95% CI: -2.1 mmHg to 0.4 mmHg) [30]. Another meta-analysis also combined 40 clinical trials and revealed that calcium supplementation (mean daily dose: 1,200 mg) reduced SBP by -1.86 mm Hg (95% CI: -2.91 mmHg to -0.81 mmHg) and DBP by -0.99 mm Hg (95% CI: -1.61 mmHg to -0.37 mmHg) [31]. In persons with a relatively low calcium intake (≤ 800 mg/day) somewhat larger BP estimates were obtained, that is, -2.63 mmHg (95% CI: -4.03 mmHg to -1.24 mmHg) for SBP and -1.30 mmHg (95% CI: -2.13 mmHg to -0.47 mmHg) for DBP. In the present study, calcium intake was inversely associated with both SBP and DBP in the 30~49-year-old group; this finding is in line with those of previous studies. A higher dietary calcium intake reduced the risk of hypertension in women over age 45 in the American Women's Health Study, and a calcium intake over 1,000 mg/day lowered the risk of hypertension (multivariate relative risk = 0.87) [17]. Also, the appropriate intake levels of sodium, along with a calcium intake of 800mg or more, reduced the hypertension risk to normotensive or non-treated hypertensive populations (ORs = 0.70, 95% CI:0.50-0.91), to treated hypertensive populations (ORs = 0.48, 95% CI:0.24-0.95), respectively [14,32].
It is thought that a reduced calcium intake may increase serum parathyroid hormone (PTH) levels, which may cause the secretion of renin and angiotensin II from the kidney and eventually increase blood pressure [33,34]. Increased calcium intake can therefore reduce blood pressure. Recent studies have suggested that calcium-sensing receptors (CaR) in blood vessels might be involved in the regulation of blood pressure [34,35]. In parathyroid glands, the expression of CaR inhibits the secretion of PTH [35]. However, the exact mechanisms of action of calcium and CaR on blood pressure regulation are not yet fully understood [34]. It is evident that dietary calcium supplementation has beneficial effects on the treatment and prevention of hypertension.
The main limitation of this study is its cross-sectional design, which does not allow for causal or directional inferences. Blood pressure is strongly influenced by other variables, such as family history, which are not modifiable and have limited implications for prevention interventions.
Using data from KNHANES III, we examined the association of SBP and DBP with sodium, calcium, and potassium intakes and anthropometric parameters in 19~49-year-old Korean adults. As a result, waist circumference, weight, and BMI were positively associated with SBP and DBP. Among 30~49-year-olds, calcium was inversely associated with both SBP and DBP. Therefore, early lifestyle modifications with encouraging calcium consumption and optimal weight control are recommended in Korean population.
 XML Download