

 PDF
PDF ePub
ePub Citation
 Print
Print


Introduction
Obesity is described as a state in which the percentage of adipose tissue in the body rises above normal levels. Excess fat is described as fat-mass in kilograms or the percentage (%) of fat of the total weight. Therefore, in order to correctly assess obesity, there is a need for an accurate body fat measurement [1].
To take the clinical importance of obesity into consideration, correct obesity assessment [2] based on definite standards is crucial because it not only can provide an index for population obesity comparison but can also be predictive of future health threats in individuals.
There are two ways to diagnose obesity: usage of anthropometry (BMI, Obesity Index and the WHR) and body fat-mass measurement (Underwater Weight, BIA, CT, MRI and DEXA).
Generally, anthropometry such as BMI, and waist circumference is known to be less reliable for making accurate muscle and fat mass calculations. BMI, however, has proven to be a simple method for evaluating the existence of obesity by quickly providing results about body fat [3]. However, at the same time, it has the weaknesses of being unable to distinguish between body fat and lean body mass [4]. Children and juveniles in their growth period tend to show lower lean body mass density due to their physique and low-density, water, and calcium percentages compared to adults [5].
CT, MRI and DEXA are complicated and expensive methods of analyzing body fat, and require expert skills, so it is difficult to apply those methods to a wide range of people. However, their accuracy for assessing body composition has proven to be superior to the results of anthropometry. Overall, CT seems to be the best method used in body fat research with its ability to pin-point differences between visceral fat and subcutaneous fat in the abdominal region [6].
With high reproducibility [7], DEXA is currently used in many clinical settings to assess body composition because of its accuracy and acuteness when measuring bone density and body fat [8,9].
BIA is simple, saves time and shows high-level interrelationships with other methods of obesity assessment [10,11]. However, the accuracy of BIA has yet to be proven in children and juveniles because it was originally designed for adult measurements.
Unlike obesity in adults, juvenile obesity measurements require different approaches and should not solely depend on body composition measurements, but also take growth into account [12]. Although, it is advisable to have direct measurements of body fat and fat distribution for precise assessment of juvenile obesity, the high cost and time needs to be taken into consideration. On the other hand, since most clinical settings prefer anthropometric methods with low cost and simplicity, there seems to be insufficient research on the reliability and suitability of those methods for assessing juvenile obesity.
This research not only used anthropometric assessment methods such as BMI, OI, Waist circumference and WHR measurements, but also performed BIA, CT and DEXA for estimating body fat mass.
The difference in obesity percentages as calculated by BMI and OI were compared, along with CT and DEXA which are known to be the most accurate among obesity confirmation methods using direct bodily measurements. The aim of this study was to elucidate the relationship among these measurement methods and offer basic information on ways to determine the degree of obesity in elementary school settings.
Subjects and Methods
Subjects
This research targeted 103 overweight/obese elementary students (grade 2-6) from three schools in three cities (designated J, I, and G) located within Jeonbuk Province (J-S elementary: 37 students, I-D elementary: 38 students, G-G elementary: 28 students). The data were collected from April 2008 to May 2008. With their parent's consent, these students (69 boys, 34 girls) were nominated for participation by the healthcare advisor from each school.
Anthropometry and classification
Anthropometry assessments were performed in April (2008) by trained graduate students. The weights and heights of participants were measured into 0.1 kg and 0.1 cm scale using inbody scales (Biospace, 230) and a height measurer (folded meter, Korea). BMI was then calculated from the measured height and weight. Students in the 95th percentile or more for BMI were classified as obese (Korean Pediatrics Society, 2007). The Obesity Index was calculated by using the Standard growth charts for Korean children and adolescents (Korean Pediatrics Society, 2007) and 20% or more of students were classified as obese (OI(%) = Actual weight - Classified by height standard weight/Classified by height standard weight×100).
Bioimpedance Analysis (BIA)
With participants wearing light clothing without socks, In-Body 230 (Biospace, Korea), measurements were conducted, and then the analyses of weight, muscle volume, fat free mass, body fat mass, and body fat percentage were performed.
WHR (Waist Hip Ratio)
The WHR is used as an abdominal fat index. With participants wearing light clothing, the circumference of the belly area and the most prominent part of the hip were measured. The waist/hip ratio was calculated on the basis of these actual measurements.
Computed Tomography (CT)
Participants underwent a CT scan at the Chonbuk National University Hospital Radiology Department. Once again with light clothing, their overall abdominal fat, visceral fat and subcutaneous fat were measured using the computerized single-layer scanner, Somatom Sensation 16 (SIMENS Erlangen, Germany). Five non-enhanced images were taken from the abdominal CT scan, with 10 cm intervals (4-5 times) above and below the umbilical level, which was centered. From each of the images, the Total Abdominal Fat Area (TAF) was named after the area of the CT number -150¢|-50 pixel. The boundary between the abdominals and its covering tissue were delineated as the inner structure (Visceral Adipose Tissue, VAT) and the outer structure (Subcutaneous Abdominal fat Tissue, SAT), then by using specialized software (Rapidia; INFINITT, Seoul, Korea) TAF and VAT were calculated. VAT was subtracted from TAF to calculate the area of SAT, from which the V/S ratio was then calculated (Visceral Adipose Tissue/Subcutaneous Abdominal fat Tissue, VSR) (V/S ratio = Abdominal visceral fat/Abdominal subcutaneous fat).
Dual-Energy X-ray Absorptiometry (DEXA)
DEXA was done at the Chonbuk National University's Health Promotion Center. Participants who wore gowns provided by the hospital, laid straight on a Scanning table to measure their arms, legs, body, head (% fat), body fat percentage and Fat Free Mass (LBM).
Statistical analysis
SPSS (Ver. 13.0) was used for statistical analysis, and the standards of probability were set to P < 0.01 and P < 0.05. The inter-relationship among body fat mass, body fat percentage, etc. measured by DEXA and BIA were analyzed by Pearson's Correlation and a Scatter diagram. In order to find out whether there are differences in body fat percentage by gender, the independent t-test was used. A paired t-test was used to examine the differences in body composition measured by DEXA and BIA.
Results
General characteristics
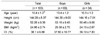
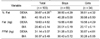
Participants' average age, height, and weight were 10.4 years (boys 10.4, girls 10.3), 144.3 cm (boys 144.3 cm, girls 144.2 cm) and 52.3 kg (boys 53.2 kg, girls 50.5 kg). Their Body Mass Indexes showed an average of 25.0 kg/m2 (boys 25.4 kg/m2, girls 24.1 kg/m2) and Obesity Indexes of 38.1% (boys 37.6%, girls 39.1%) (Table 1).
Comparisons of body fat percentage indices
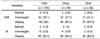
The obesity confirmation results based on BMI and OI are shown in Table 2. While the results of BMI showed 66.0% of participants as obese (boys 65.2%, girls 67.6%), OI results reported 92.2% of participants as obese (boys 94.2%, girls 88.2%). Therefore, there were some differences between the two methods in determining obesity. Although differences in obesity incidence exist between BMI and OI, there are no internationally standardized criteria for evaluating childhood obesity. The criteria used for children, unlike the adult's criteria, are different according to individual researchers or the research area [13]. Because the criteria for physical measurements in students are not standardized, different criteria are used at different schools, causing inconsistencies. Therefore, because of the difficulty in administering consistent assessments and care for overweight school children, there is a critical need for accurate and workable standard methodologies for the assessment of childhood obesity in Korea.
Comparisons of body fat percentage indices
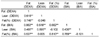
Table 3 shows body fat percentage, body fat mass and fat free mass of the participants as measured by DEXA and BIA.
The average body fat percentage was 38.7% (boys 38.6%, girls 38.8%) by DEXA and 40.18% (boys 40.3%, girls 40.0%) with BIA. The average body fat mass by DEXA was 19.6 kg (boys 19.7 kg, girls 19.6 kg) and 20.4 kg (boys 20.2 kg, girls 20.1 kg) with BIA.
The fat free mass as measured by DEXA was 31.1 kg (boys 31.3 kg, girls 30.9 kg) and 30.4 kg (boys 30.4 kg, girls 30.3 kg) with BIA.
Comparison of interrelationships between each percent body fat variable
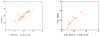
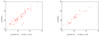
The interrelationship of body fat percentages as measured by DEXA and BIA are shown in Table 4.
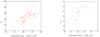
DEXA and BIA, which are both known to correctly measure body fat, showed mutual correlations. Among them, measurements by DEXA and BIA of body fat (r = 0.862, P < 0.01), fat free mass (r = 0.895, P < 0.01), and body fat percentage (r = 0.810, P < 0.01) showed high correlations and a Scatter Graph was drawn to illustrate the distinction between sexes (Fig. 1-3).
Comparison of abdominal fat mass variables
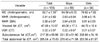
The waist circumferences averaged 82.8 cm (boys 84.1 cm, girls 79.8 cm), the average WHR was 0.91 (boys 0.93, girls 0.88) and the average WHR by using BIA was 0.90 (boys 0.94, girls 0.81) (Table 5).
The CT scan showed a TAF (Total Abdominal Fat Area) average of 265.0 cm2 (boys 270.4 cm2, girls 253.6 cm2), VAT (Visceral Adipose Tissue) average of 47.7 cm2 (boys 49.1 cm2, girls 44.7 cm2) and SAT (Subcutaneous Abdominal fat Tissue) average of 217.4 cm2 (boys 221.4 cm2, girls 208.9 cm2). With VSR (visceral adipose tissue / subcutaneous abdominal adipose tissue ratio) of 0.22 (boys 0.22, girls 0.21), most participants in this research had predominantly subcutaneous fat obesity rather than visceral fat obesity.
Comparing interrelationship of abdominal fat
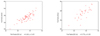
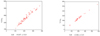
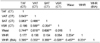
By using CT scan, the abdominal fat mass, waist circumference, WHR and its interrelationship using BIA was measured as shown in Table 6.
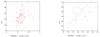
The CT scan revealed that subcutaneous fat was highly related to the abdominal fat mass. Especially, the abdominal fat mass in obese children was more closely related with the subcutaneous fat (r = 0.983, P < 0.01) than the visceral fat (r = 0.640, P < 0.01). On the basis of BIA results, abdominal visceral fat and subcutaneous fat were closely related with the waist circumference and the WHR. On the other hand, VSR by CT, which indicates abdominal obesity, was not correlated with the waist circumference, measured WHR and WHR by BIA. The distribution chart of each sex is as shown in Figure 4-6.
Discussion
Previous investigations that include obesity assessments of elementary students are classified into two groups: studies using BMI [14,15] and those using OI [16-18].
When we assessed obesity of the participants using BMI percentile curve and OI, the results were conflicting. While 27 obese students in the OI measurement group were assessed as overweight by BMI and 3 overweight students in OI were assessed as normal using BMI.
Average body fat mass of boys was higher than that of girls, and average fat free mass of girls was higher than that of boys, but there were no statistically significant differences. These results may be explained by the higher obesity ratio of boys in Korea than that of girls, and previous DEXA research in children with 86-95 lower BMI [19] showed higher body fat percentages (46.4%) than the body fat percentage of this study (38.67%).
Although Ellis's research [20] reported an average difference of 0.3 kg between the results with DEXA and BIA, this study suggests that BIA is an efficient method of measuring body fat percentage and body fat mass in the view of cost and effort since there was little difference between DEXA and BIA.
It is generally assumed that DEXA and BIA, two confirmed effective methods, have significant correlation. Tyrrell et al. [21] measured DEXA and BIA of a multi ethnic group of children (European, NZ Maori and Pacific Island children) and showed high correlation between fat free mass and body fat percentage. However, there was no study comparison of DEXA and BIA for Korean children. Given the high correlation between DEXA and BIA, BIA can be considered to be an easier and more trustworthy measurement method for assessing body fat of Korean children.
Since the results from anthropometry alone cannot precisely identify the degree of the danger from abdominal obesity in elementary students, we performed CT scans to obtain data on the subcutaneous fat mass and visceral fat mass.
The waist circumference index is considered to be highly related to abdominal visceral fat [22-25]. Abdominal visceral fat was also highly related to WHR as determined by CT scan using the ratio of waist and hip (buttock) circumference. These assessments are reliable predictive variables for abdominal visceral fat measurements [26-28]. However, there are also shortcoming and split opinions on the suitability of predicting abdominal visceral fat, due to all individuals having different physiques [29].
In this study, CT scans of obese children were made, the degree of visceral fat was examined by status of abdominal fat, and then waist circumference using a tape measurer, WHR, and WHR using BIA were compared and the correlation among them were examined. While there are many studies using CT for adults, the studies for children in Korea are very short.
If obesity was classified into visceral fat obesity (GE 0.4) and subcutaneous fat obesity (LT 0.4) by VSR (visceral adipose tissue / subcutaneous abdominal adipose tissue ratio), most participants in this research had subcutaneous fat obesity rather than visceral fat obesity (only 3 students with visceral fat of 0.93% exhibited any visceral obesity).
The VSR of this study was lower than VSR (0.25) of Kim et al., Given that children had more abdominal subcutaneous fat than visceral fat structures, the results may not be considered as serious.
The average TAF measured by CT of obesity children was more significantly related with subcutaneous fat (r = 0.983, P < 0.01) than visceral fat (r = 0.640, P < 0.01). Also, TAF was significantly correlated with waist circumstance by a tape measure and WHR by BIA. VSR using CT which, indicated the risk of abdominal fat, was not significantly correlated with waist circumstance and WHR by a tape measure, and WHR by BIA.
The total size of abdominal fat confirmed by CT showed the highest correlation with the waist circumference (r = 0.744, P < 0.01) using a tape measure, while visceral abdominal fat by CT and waist circumference (r = 0.615, P < 0.01), along with subcutaneous abdominal fat and waist circumference (r = 0.696, P < 0.01) showed the strong quantitative relationships. Therefore, using a tape measurer for waist circumference measurement seems to be the most appropriate way for assessing abdominal fat in obese children.
In summary, there are some differences in assessing obesity according to assessment methods, so we need more exact standards for determining obesity and index of obesity according to various assessment methods.
As elementary children's obesity consists mainly of subcutaneous abdominal fat, there seems to be less of a health threat from visceral fat accumulation. Nevertheless we found that for measuring abdominal fat and body fat mass, WHR using a tape measure and the BIA can provide the most effective and simple approaches. A waist circumference measurement using a tape measure is considered to be the most effective method for assessing abdominal fat in elementary students.
However, in order to determine the degree of obesity for children during their growth period, a continual large scale examination is needed to rigorously validate the assessment of obesity for children and juveniles in Korea. In this way, we could actively forecast and prevent obesity related health threats, and efficiently control obesity as a whole.
 XML Download