

 PDF
PDF ePub
ePub Citation
 Print
Print


Introduction
According to the third National Health and Nutrition Survey (Ministry of Health and Welfare, 2006), Korean consumed more animal foods and less plant foods during the past 30 years. However, the consumption of seaweeds such as sea tangle, seamustard, and sea lettuce has continued to increase 3.5 times from 2.4 g/d in 1970 to 8.5 g/d in 2005. Traditionally, many postpartum women in Korea have used a seamustard soup in order to return to the pre-pregnant state physiologically as fast as possible. According to Donguibogam written by Heo Jun who was the famous doctor in the Joseon Dynasty, seamustard was used to stimulate the excretion or removal of watery components after delivery (Choi, 2003). Nowadays marine natural products are considered to be effective for preventing chronic diseases such as obesity, diabetes mellitus, atherosclerosis, cancer as well as constipation (BFN, 2005). Various seaweeds contain lots of alginic acid, in addition to beta carotene, iodine or bioactive components such as fucoidan. Among them, alginic acid, a kind of soluble viscous fiber, is one of the important healthy components. One of its well-known physiological functions is a LDL cholesterol-lowering effect (Anderson & Hanna, 1999; Fernandez, 2001).
Hypertriglyceridemia and cholesterolemia seem to confer a higher risk of atherosclerotic cardiovascular disease in diabetic person than non-diabetics (Hu et al., 2001; Rubins et al., 1999). Including animal fat and trans-fatty acid, dietary modification of protein, carbohydrate, fiber or phytosterol could affect cholesterol metabolism. Recently, a low fat and high carbohydrate diet is considered to protect against heart disease. However, the fasting triglyceride level would be increased if there were no dietary fiber in high carbohydrate diet (Robins et al., 2003).
This study was conducted to investigate the effects of seamustard powder on body weight change, blood glucose concentration and lipid profiles in rats fed diet with different energy nutrient composition.
Materials and Methods
Animals and diets
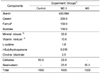
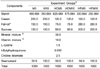
Male Sprague-Dawley rats (average initial weight 103.7 g, n=48) were divided into eight groups as follows: Control diet, M2.5 (2.5% seamustard diet), M5 (5% seamustard diet), M10 (10% seamustard diet), HCM5 (high carbohydrate+5% seamustard diet), HCM10 (high carbohydrate+10% seamustard diet), HFM5 (high fat+5% seamustard diet) and HFM10 (high fat+10% seamustard diet). In fact, two experiments were designed concomitantly. Experiment I was consisted of three groups (control, M2.5 & M5) according to the level of seamustard powder in control diet. Experiment II was consisted of six groups (M5, M10, HCM5, HCM10, HFM5 & HFM10) according to seamustard level and dietary energy composition. All diets were based on AIN-93G diet (Reeves, 1997) as shown Table 1. All ingredients of diets were purchased from Labanimal Co. (Dyets, Bethleham, PA). Total experiment period was 4 weeks. The animals were fed diet and tap water ad libitum with alternating 12-h light/12-h dark cycle in temperature controlled (20-22℃) room at a relative humidity (50-60%). From the food intake and body weight gain of rats, food efficiency ratio (FER) and energy efficiency ratio (EER) were calculated. For three days a week, feces were collected and weighed immediately and stored at -20℃ in the refrigerator. All animal procedures conformed to "Guide for the Care and Use of Laboratory Animals" (National Research Council, 1996).
Sample collection and biochemical analysis
The blood samples were collected from the carotid of rats anesthetized with ethyl ether. Samples were then centrifuged at 3,000 rpm for 20 minutes and the serum was separated. The organs such as liver, spleen, kidneys, adrenal glands, epididymal fat pads and gastrocnemius muscle were removed and weighed immediately. All samples were stored at -70℃ until analysis. The concentrations of total- and HDL-cholesterol, triglyceride and glucose in serum were determined enzymatically by using commercial kit (Asan Pharmaceutical, Seoul, Korea). Serum LDL-cholesterol level was calculated from the equation of Friedewald et al. (1972). The total lipid contents in liver and feces were extracted with chloroform: methanol mixture (v/v, 2:1) and measured using the method of Bligh and Dyer (1959). Hepatic and fecal cholesterol concentrations in the lipid extracts were measured enzymatically by using commercial kit (Asan Pharmaceutical, Seoul, Korea).
Statistical analysis
All data were expressed as mean ± SD. The significance of difference among groups was determined by one way analysis of variance (ANOVA) using the SPSS program v.14 (SPSS, Chicago, IL, USA). The result was considered to be significantly different if the p value was <.05, and then Duncan's multiple range test was performed if differences were identified among groups.
Results
Exp. I
The food and energy intake, body weight gain, food efficiency ratio (FER) and energy efficiency ratio (EER) of rats are shown in Table 3. Energy intake of M5 group was the lowest among groups. However, food intakes, body weight and body weight gain were not significantly different among groups. Consequently, there were no significant differences in FER and EER among groups according to seamustard level.
As shown in Table 4, for weights of liver, spleen, kidney and gastrocnemius muscle there were no significant differences among three groups. However, seamustard intake resulted to affect the weights of epididymal fat pads and adrenal glands (p<.05). Adrenal glands weight of M5 group was the highest, but the weight of epididymal fat pads was significantly lower than that of M2.5 group (p<.05).
As shown in Table 5, all of daily fecal excretion, fecal lipid and cholesterol contents, hepatic lipid and cholesterol contents did not show any significant differences among groups according to seamustard level.
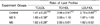
The serum concentrations of glucose, triglyceride and total cholesterol (TC) did not show any significant differences among three groups. Interestingly, serum LDL-cholesterol (LDL) concentration of M5 group was the lowest among groups. However, serum HDL-cholesterol concentrations of M2.5 and M5 groups were higher than that of control group (Table 6). Collectively shown in Table 7, the ratios of TC / LDL of M2.5 and M5 groups were significantly higher than that of control group. However, in the ratio of TC to HDL and the ratio of LDL to HDL, there were no significant differences among groups, even though the ratios tended to decrease according to seamustard level.
Exp. II
The food intake, energy intake, body weight gain, food efficiency ratio (FER) and energy efficiency ratio (EER) of rats are shown in Table 8. Food intakes of high fat diet groups (HFM5 & HFM10) were significantly lower (p<.05) than those of high carbohydrate diet groups (HCM5 & HCM10). Energy intake was the highest in HCM5 group and the lowest in M5 group; final body weight and body weight gain were the highest in M10 group and the lowest in HFM10 group (p<.05). FER was the lowest in HCM5 group, and EER was the lowest in HFM10 group, while both of FER and EER were the highest in M10 group. Conclusively, seamustard affected only body weight gain, while dietary energy composition affected both food intake and body weight gain of rats.
As shown in Table 9, the weights of liver and kidney of HFM10 group were significantly lower than those of the other groups (p<.05). Spleen weight of high fat diet groups (HFM5 & HFM10) were significantly lower than those of M5 and M10 groups (p<.05), and adrenal glands weight of HFM10 group was the lowest among groups. The weight of epididymal fat pads was the lowest in HFM10 group, but there were no significant differences in weight of gastrocnemius muscle among all groups. Consequently, dietary energy composition affected the weights of liver and kidney, but seamustard affected the weight of gastrocnemius.
As shown in Table 10, daily fecal weight and fecal lipid content did not show any significant difference among groups. Fecal cholesterol excretion of HFM5, HFM10 and HCM10 groups were significantly higher than that of HCM5 group. However, there were no significant differences in hepatic total lipid and cholesterol contents among groups. As a result, seamustard affected fecal weights and hepatic cholesterol contents, while dietary energy composition might affect fecal cholesterol excretion.
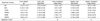
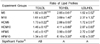
As shown in Table 11, the concentrations of glucose, triglyceride and total cholesterol (TC) in serum showed no significant differences among groups, even though serum glucose and triglyceride concentrations of high fat diet groups (HFM5 & HFM10) tended to be lower than other groups. However, serum LDL-cholesterol (LDL) concentrations of these groups were higher than those of control diet groups (M5 & M10). Serum HDL-cholesterol (HDL) concentration of HFM10 group was the lowest among all groups. As a result, 10% seamustard level and high fat diet affected serum cholesterol profiles of rats undesirably. As shown in Table 12, the ratios TC/LDL of M10, HCM10, and HFM10 groups tended to be lower than those of M5, HCM5, and HFM5 groups, respectively. However, the ratios TC/HDL and LDL/HDL were not significantly different among groups, except those of HFM10 group. Extraordinarily in HFM10 group, the risk for atherosclerotic cardiovascular diseases, the ratio of TC/HDL was the highest. From the results, it was observed that seamustard as a dietary fiber source might confer the risk for cardiovascular disease in high fat diets statistically.
Discussion
Generally, it has been recognized that dietary fiber had numerous important physiological effects on the gastrointestinal tract, which might be attributed in large part to the viscosity or fermentability of the fiber sources. In upper gastrointestinal tract, an important attribute of fiber is its viscosity which may lead to delay in gastric emptying, interfere with or prolonged absorption of other nutrients, for example, cholesterol or glucose (Lupton & Trumbo, 2006).
Viscous fibers, such as pectin, guar, oat bran and psyllium are considered to have a cholesterol-lowering effect (Fernandez, 2001), a reducing hunger or weight loss (Birketvedt, 2000) as well as a protective effect against cardiovascular disease (Truswell, 2002). The well-known physiological function of soluble viscous fiber is a LDL cholesterol-lowering effect (Anderson & Hanna, 1999; Fernandez, 2001).
In this study, there were no significant differences in fecal and hepatic cholesterol changes by seamustard consumption in control group. However, 10% seamustard level induced to increase fecal cholesterol excretion and to decrease hepatic cholesterol contents remarkably in high carbohydrate diet groups (Table 5, Table 10). From these results, it was expected that seaweeds containing soluble viscous fiber and some healthy components, might affect bile acid excretion to the intestine and affect the cholesterol metabolism at higher level in rats fed with high carbohydrate diet.
Interestingly, seamustard at below 5% level in control group induced to decrease LDL-cholesterol (LDL) and to increase HDL-cholesterol (HDL). In contrast, 10% seamustard level induced to increase LDL of rats fed with high carbohydrate diet or high fat diet significantly compared to rats fed with control diet. Assessment of risk for coronary disease is usually done by measuring TC and LDL in blood as well as the ratios TC/LDL, TC/HDL or LDL/HDL. Elevated LDL is considered to be a major risk factor, and HDL-cholesterol is a major protective factor for cardiovascular diseases (Kritchevsky, 2006). It is reported that the risk for coronary disease may be high, especially when the ratio of TC/HDL is greater than 4:1. It may be optimal when that ratio is 3.5:1 or less (Wardlaw & Smith, 2009). In this study, the TC/HDL ratios of all diet groups were similar or lower than 4:1, except HFM10 group (6:1) in which rats were fed high fat diet with 10% seamustard powder as fiber source (Table 7, Table 12). From the results, it was observed that the higher was the seamustard level, the worse serum lipid profile was in high fat diet especially.
There were no significant changes in serum triglyceride as well as glucose concentration among all groups. It has been reported that if high carbohydrate diet was also a high fiber diet, fasting triglyceride level in blood would be reduced while it is usually increased in high carbohydrate and low fiber diet (Anderson, 2000). Total fiber of seamustard powder is about 14.2 g per 100 g edible portion (National Rural Resources Development Institute, 2006). Therefore, dietary fiber levels in diets of Exp. I groups were 5% (cellulose) in control diet, 2.85% (cellulose+seamustard fiber) in M2.5 group and 0.71% (seamustard fiber) in M5 group, respectively. The seamustard fiber levels in diets in Exp. II groups were 0.71% in M5, HCM5, and HFM5 groups and 1.42% in M10, HCM10, and HFM10 groups. According to replacement of cellulose by seamustard powder partially or completely, substantial dietary fiber level was dramatically reduced. From these results, it could be speculated that seamustard effect on body weight gain or serum lipid profiles relied on its soluble fiber, alginic acid and/or other components. Seaweeds contain much β-carotene, iodine, or a bioactive components such as fucoidan. Nowadays, these substances are known to be effective for preventing chronic diseases such as obesity, diabetes mellitus, atherosclerosis as well as cancer. In fact, interaction of both seamustard intake and dietary energy composition resulted in significantly different effects on body weight and HDL-cholesterol between high fat diet and high carbohydrate diet.
Sometimes the reduction of LDL level implied lowering levels of circulating carotenoids and vitamin E because they are transported in LDL (Noakes et al., 2002). Olistat, a chemically synthesized derivative of lipostatin, directly inhibited the lipase activity and resulted in the suppression of triglyceride digestion by around 30%, and thus increasing fecal elimination of fat, and therefore overall effects resulted in a 5 % to 10% weight loss and improved total-, LDL- and HDL-cholesterol levels without significant declines in circulating vitamin A, vitamin D, vitamin E and β-carotene (Hutton & Fegusson, 2004).
Conclusively, the present study suggested that seamustard might be more effective for body weight control in high fat diet than in high carbohydrate diet, but not for improving blood lipid profiles. Even though still remain the difficulties and research limitations to generalize this suggestion. In the future, more well-designed epidemiologic researches would be needed to investigate the beneficial and/or undesirable effects of seamustard consumption on modern population living under the global environments.


 XML Download