

 PDF
PDF ePub
ePub Citation
 Print
Print


Introduction
Currently, it is obligated to have nutrition labeling such as calorie, carbohydrate/sugars, protein, fat/saturated fat· trans fat, cholesterol, sodium, and other nutrients with emphasis for long-term storage food (only for retort foods), cookies and candies, breads and dumplings, chocolate, jams, vegetable oils, noodles, beverages, and food for special dietary uses, based on the Foods Labeling Standards (KFDA, 2008). Conventionally, nutrition facts are located in the back of pack (BOP), but it is difficult to compare products after reading the provided information during a short time because consumers spend very short time when purchasing processed foods. Thus the need has been increased that nutrition labeling should be effectively provided with simple design appropriate for the eye level of consumers (Feunekes et al., 2008). It has been reported that, while back-of-product nutrition labeling provides a detailed information on nutrients included in the product, front-of-pack (FOP) nutrition labeling which is displayed in the front part of the product has advantages of providing consumers with easier access to the nutrition information and with simpler understanding of information (Dotsch-Klerk & Jensen, 2008).
In case of other countries for front of pack nutrition labeling, UK Food Standard Agency (FSA) has recommended companies to voluntarily practice the front of pack nutrition labeling for consumers through the Traffic Light Signpost labeling guidelines since 2005 (Food Standards Agency, 2009). European Commission (EC) proposed a new revision for nutrition labeling in the January of 2008 in which major nutrients, that is, calorie, total fat, saturated fat, sugars and salt contents should be indicated on the front part of products (Commission of the European Communities, 2008). In Australia and New Zealand, the idea of front of pack labeling has been studied based on its advantages to meet the various needs for front of pack labeling (Louie et al., 2008; Mhurchu & Gorton, 2007). At present in Korea, several companies are voluntarily practicing the front of pack nutrition labeling.
There are some studies on consumer perception for front of pack nutrition labeling in other countries including an on-line survey on the front of pack labeling in the UK and a survey of 790 participants by Australia Cancer Society in 2008, and the types of nutrients indicated on the front of pack labeling, labeling plan, and design have been studied on the basis of these large-scale consumer survey results (Kelly et al., 2008; Netmums, 2007).
The results of 2005 KNHANES showed that the degree of checking nutrition labeling in our country was 24.8% among all participants over 19 years old, which is very low rate of checking nutrition labeling. Thus educational and promotional strategies for nutrition labeling are constantly needed (Ministry for Health, Welfare and Family affairs, 2006). This study was conducted to figure out the current status of practicing front of pack nutrition labeling in processed foods and consumers' perception for front of pack nutrition labeling, and to collect the consumers' opinions on labeling methods, and to promote the development of nutrition labeling related policies.
Subjects and Methods
I. Current state in the front-of-pack labeling of processed foods in Korea
A total of 1,496 products with nutrition labeling in the food section of a large discount store located in Jukjeon area, Yongin-si, were examined from August 18 to 22, 2008.
II. Consumer perception survey for front-of-pack labeling
Study subjects and survey period
This study was conducted in 1,019 male and female adults in their 20s-40s resided in 6 administrative regions including Seoul and Gyeonggi-do from October 15 to November 15, 2008.
Survey contents
The survey tool for this study was a survey questionnaire method through face-to-face interview by an investigator. The survey contents included general characteristics of the subjects such as gender, age, residence, education level, monthly income, job and marriage status, and number of children. Contents for nutrition labeling included the degree of checking nutrition labeling, degree of understanding, degree of utilizing nutrition labeling when purchasing products, and the reasons of not checking nutrition labeling. Contents for front of pack nutrition labeling included the necessity for front of pack nutrition labeling, the number and type of nutrients appropriate for front of pack labeling, the necessity for labeling the percentage of daily value, the unit for front of pack nutrition labeling, the necessity for color difference according to nutrient contents, and labeling method for front of pack nutrition labeling. The survey was conducted while explaining an example using the products of O company which practices front of pack nutrition labeling, for better understanding of front of pack nutrition labeling.
Results
Current status of front of pack nutrition labeling in processed foods
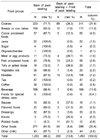
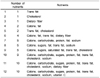
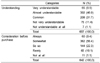
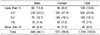
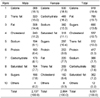
Among 1,496 products with nutrition labeling on the back of their package examined in one location of large discount stores as of August 2008, only 200 products (13.4%) had front of pack labeling (Table 1). The number and type of nutrients appeared on the front of pack were varied depending on the product from 1, either trans fat, cholesterol, or dietary fat, to 2, 4, 5, 9, and 10 (Table 2).
General characteristics of subjects in the survey for the perception on the front of pack nutrition labeling
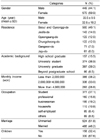
General characteristics of subjects are shown in Table 3. The percentage of males was 44.1% and that of females was 59.9%, and the average age of males was 33.5 years and that of females was 32.5 years. For the residence of participants, Gyeonggi-do was the highest and then were in the order of Seoul, Jeolla-do, Gyeongsang-do and Chungcheong-do, Gangwon-do, and Jeju-do. The education level of participants showed 39.2% of college graduate, 36.9% of college students, 15.5% of high school graduate and below, and 8.5% of graduate college and over. Also, monthly income showed 38.2% of below 2 million won, 33.0% of 2~4 million won, and 28.8% of 4 million won and over. The job status of participants was in the order of office worker, students, professional worker, housewives, and others.
Degree of checking nutrition labeling
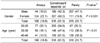
The results on the degree of checking nutrition labeling showed that 16.8% of participants answered 'always check' and 51.5% answered 'try to check but vary depending on the circumstances', and 32.7% answered 'rarely check' (Table 4). There was a gender difference, which was statistically significant, and female subjects were more sensitively recognize nutrition labeling of foods than male subjects. For age differences, 20.1% of the 20s answered 'always check', while 16.1% of the 30s and 13.3% of the 40s answered the same, showing that younger age groups had significantly higher degree of checking nutrition labeling.
The results on the degree of understanding of nutrition labeling and the degree of utilization for nutrition labeling at the time of purchase in participants who answered for checking nutrition labeling are shown in Table 5. The percentage of participants who answered that they were very well or slightly well understood nutrition labeling was 55.9% of all participants and the percentage who answered that they always or sometimes utilize nutrition labeling at the time of purchase was 65.8% of all participants.
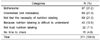
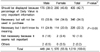
The reasons for not checking nutrition labeling in participants who answered not checking nutrition labeling showed 32.1% of 'bothersome' and 21.3% of 'not noticed' (Table 6).
Perception on front of pack nutrition labeling
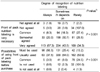
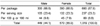
The results of investigating the degree of recognition on front of pack nutrition labeling after explaining the front of pack nutrition labeling by directly showing product samples were shown in Table 7 with a 5-point score system. For the necessity of front of pack nutrition labeling, the average score was 3.9 in males and 4.2 in females, which was significantly higher. For the helpfulness of front of pack labeling in product selection, the average score was 3.8 in males and 4.1 in females; for noticeable front of pack labeling for easier access to nutrition information, the average score was 3.7 in males and 4.0 in females.
The influence of checking back of pack nutrition labeling on the degree of recognition for front of pack nutrition labeling showed that the agreement for the necessity of front of pack nutrition labeling was higher as the degree of checking nutrition labeling increased (Table 8). Also, it was investigated that the intention of using front of pack nutrition labeling was higher as the degree of checking nutrition labeling increased.
Methods for front of pack nutrition labeling
When practicing front of pack nutrition labeling, the number of nutrients that consumers wanted on the front of pack was mostly 4~5, but not significantly different (Table 9).
For the type of nutrients that should be appeared on the front of pack labeling, multiple responses showed that trans fat, total fat, cholesterol, and sodium were on the list, and there was no difference between male and female subjects (Table 10)
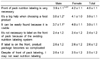
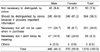
The results on the questionnaire for indicating percentages for both nutrient content and daily value as a method for front of pack nutrition labeling showed 42.7% of 'it is very important information and should be definitely indicated', 34.0% of 'it is necessary information but will not be used actually', and 22.2% of 'it is necessary information but I can't understand exactly what it means' (Table 11).
The most appropriate unit for front of pack nutrition labeling was 1 package unit (67.9%), and then in the order of 1 serving unit (23.3%) and 100 g or 100 ml unit (8.8%). There was no significant gender difference (Table 12).
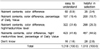
The results on the questionnaire for color difference according to nutrient contents, as similarly as done in the UK Traffic Light Signpost Labeling, showed 58.3% of 'it is very important information and should be definitely indicated', 32.9% of 'it is necessary information but not used actually in purchasing' & 'it is necessary information but I can't understand exactly what it means', and 7.9% of 'color difference is not necessary', suggesting low degree of perception for actual utilization of color difference system. There was no significant gender difference (Table 13).
The consumer preference for color difference according to nutrient contents and for labeling of low, medium, high contents, and for percentage daily intake value from the information provided by front of pack nutrition labeling showed that indicating all of color difference, low/medium/high contents, and percentage content and daily intake value is easy to understand (41.6%) and helpful in selecting products (44.9%) (Table 14).
Discussion
The results of 2005 KNHANES showed that the degree of checking nutrition labeling in our country was 24.8% among all participants over 19 years old, which is very low rate of checking nutrition labeling (Ministry for Health, Welfare and Family affairs, 2006), and another study on adults in their 20s and over showed that only 15% of participants checked nutrition labeling (Lee & Lee, 2004). According to a study in 4 middle schools in Gangbuk area of Seoul, the results for checking nutrition labeling in selecting processed foods showed in the order of 'sometimes check' 33.4%, 'seldom check' 24.7%, 'mostly check.' 23.5%, 'always check' 12.1%, and 'never check' 6.3%, and the percentages for 'always check' and 'mostly check' were 16.4% and 28.6% in female students, which were higher than 8.2% and 18.9% in male students, respectively (Park et al., 2008). In this study, only 16.8% of participants answered 'always check nutrition labeling' and 32.7% answered 'seldom check', which is similar to the results of other studies. According to the study of Lee and Kim (2007), the results of the survey for food and nutrition labeling in college students in Busan showed that the reasons for not checking food and nutrition labeling were in the order of the following: the labeling is not easily seen, the labeling is not necessary, the labeling is difficult to understand, and the labeling can't be trusted. The results of this study also showed similarly that the reasons for not checking food and nutrition labeling are 'bothersome' 31.2%, 'labeling is not easily seen' 21.3%, 'not feeling the necessity of the labeling' 21.3%, 'labeling is difficult to understand' 13.5%, and 'labeling can't be trusted' 7.1%.
Therefore, it is considered that a new measure should be developed for nutrition labeling which provides sufficient information on nutrients in processed foods and is easily identified by consumers. In this study, among 1,496 products with nutrition labeling on the back of the package, only 200 products (13.4%) had front of pack labeling practiced voluntarily by some companies. Therefore, the consumer survey is very important and significant for systematic development of the front of pack nutrition labeling.
The front of pack nutrition labeling was practiced first in UK where companies have voluntarily practiced the front of pack nutrition labeling for easier understanding of the labeling by consumers through the Traffic Light Signpost labeling guidelines since 2005 (Food Standards Agency, 2009). The UK's system uses a category system for 4 major nutrients related to health such as fat, saturated fat, sugar, and salt. The labeling of nutrient contents is based on per serving and divided into 'high', 'medium', and 'low' by comparing each nutrient content to the standard value and by giving red, orange, and green colors, respectively, to provide both information on nutrients and the guideline for that information. The basis for color difference by nutrient contents is 100 mg/100 ml because the nutrient content can be easily compared among other products. The UK's Traffic Light Signpost labeling system is recommended for processed convenient foods such as sandwiches, frozen foods (ready meals), burgers, meat pies, pizza, sausage, and breakfast cereals, and has limitations that it is not applied to all categories of foods (Food Standards Agency, 2009).
However, as problems related to color difference by nutrient's traffic light are brought up from the industries, % Guideline Daily Amounts (%GDA) has appeared on the front part of a package since 2005 when 'Tesco', a British-based supermarket chain, first started to use it and Confederation of the Food and Drink Industries (Confédération des industries agro-alimentaires de l'UE) (CIAA, 2009) recommends %GDA appeared on the nutrition labeling of processed foods (CIAA, 2009). Then the European Commission (EC) proposed a new revision for nutrition labeling in the January of 2008 in which major nutrients, that is, calorie, total fat, saturated fat, sugars and salt contents should be indicated on the front part of products (Commission of the European Communities, 2008). In Australia and New Zealand, the idea of front of pack labeling has been studied based on its advantages to meet the various needs for front of pack labeling (Louie et al., 2008; Mhurchu & Gorton, 2007). At present in Korea, several companies are voluntarily practicing the front of pack nutrition labeling.
Among participants who answered 'always check' or 'sometimes check' nutrition labeling at the time of purchase in a study of 300 females over 20 years old in Korea, total calorie was the mostly checked nutrient as 58.2% when purchasing, followed by fat (Chung & Kim, 2007). Also in our study, calorie was the mostly answered nutrient that should be appeared on the front of pack nutrition labeling, showing higher consumer's interest for information on calorie.
Chang (2007) suggested a multiple traffic light with % daily value (MTL-%DV) as a new nutrition labeling method. The same study reported that 77.1% of elementary students, which was the highest, answered to check the front of pack traffic light nutrition labeling, and then 67.3% of adults and 64.9% of high school students answered the same. In our study, 58.3% answered that the necessity for color difference according to nutrients is important, which was low. And for the questionnaire on indicating the percentage daily value on the front of pack nutrition labeling, 42.7% answered that the labeling of percent daily value is a very important information and thus should be indicated, which is consistent with consumer studies in other countries that reported the preference for simple color difference according to nutrient contents in the front of pack labeling compared to the percentage daily value (Kelly et al., 2008; Netmums, 2007).
From the above results, consumers of our country showed the very low degree of recognition for the current back of pack nutrition labeling, but the necessity for front of pack nutrition labeling was significantly high. It is considered that consumer surveys on nutrition labeling from various viewpoints are needed to provide consumers the right to know by appropriate nutrition labeling methods in the current circumstances with no consumer survey on front of pack nutrition labeling.
 XML Download