Journal List > Nutr Res Pract > v.3(4) > 1051030

Chung and Pérez-Escamilla: Risk factors of type 2 diabetes among Korean adults: The 2001 Korean national health and nutrition examination survey

Abstract

This study aimed to identify risk factors for type 2 diabetes (T2D) in Korea, a rapidly changing country. Data of 5,132 adults aged 20-85 were used from the 2001 Korean Health and Nutrition Examination Survey. Multiple logistic regression was carried out to identify risk factors for T2D. Three models were specified: (i) socioeconomic and demographic factors (model 1: age, gender, education, poverty income ratio, employment), (ii) behavioral risk factors and covariates (model 2: obesity, physical activity, smoking, alcohol drinking, dietary quality, family history of T2D, co-morbidity) and (iii) socioeconomic, demographic, and behavioral factors (model 3). The prevalence of T2D was 7.4%. Less education (OR 1.41, 95% CI 1.08-1.84), age (OR 2.19, 95% CI 1.56-3.08 in 40-59 yrs, OR 4.05, 95% CI 2.76-5.95 in 60 yrs + comparing to 20-39 yrs) and abdominal obesity (OR 2.24, 95% CI 1.79-2.82) were risk factors for T2D even after controlling for other factors simultaneously. There was a significant association of T2D with ever smoking (OR 1.34, 95% CI 1.06-1.67). The relationship of age with T2D was modified by gender in model 1 and the relationship of smoking with T2D was modified by obesity in model 2. Less educated, older, obese or ever smokers were more likely to have T2D. Gender mediated the relationship of age, and obesity mediated the relationship of smoking, with T2D. Intervention programs for T2D in Korea should take the interactions among risk factors into account.

Introduction

South Korea, which was considered to be one of the poorest countries in the 1950s, became the world's 10th largest economy in 2005 (International Monetary Fund, 2007). Along with a surge in economic growth, individual lifestyle behavior and socioenvironmental conditions surrounding individuals have changed rapidly (Kim et al., 2004). These trends may have accelerated the incidence of chronic diseases.
Diabetes has become a major health threat to Koreans. The mortality rate due to diabetes dramatically increased from 4.3 in 1983 to 24.3 per 100,000 persons in 2004. Currently diabetes is Korea's fifth leading cause of death (National Statistical Office, 2006). In addition, twenty four percent of the population is at risk of diabetes (Kim et al., 2006). The disease is closely related to the risk of cerebrovascular disease and coronary heart disease, the second and third causes of death in Korea respectively (Ko et al., 2006). Obesity and metabolic syndrome are significantly associated with type 2 diabetes (T2D) in Korea.
Several factors contribute to this chronic disease epidemic including socioeconomic and demographic status, as well as lifestyle behaviors. These factors are typically correlated with each other. Moreover, these relationships have been demonstrated to behave differently among ethnic groups or even within the same ethnic groups, when the living environment differs (Centers for Disease Control and Prevention, 2004; McNeely & Byoko, 2004; Singh & Hiatt, 2006).
Several studies have examined risk factors to T2D in Korea (Cho et al., 2006; Kim et al., 2006; Sung et al., 2001). However, none considered statistical interactions among risk factors. The objectives of the study were to determine the relationships of T2D with socioeconomic and demographic factors, and potential lifestyle behavioral risk factors, while taking interactions among risk factors into account.

Subjects and Methods

Subjects

The analysis was conducted with the 2001 Korean National Health and Nutrition Survey data. The cross-sectional and nationally representative survey consisted of four components: a Health Interview Survey, a Health Behavior Survey, a Health Examination Survey, and a Nutrition Survey. The subjects of the surveys were selected from the non-institutionalized civilian population following a multistage probability stratified sampling design based on the 2000 Korean National Census Registry. The number of individuals from these sampling frames included in the Health Interview Survey was 37,769. Out of the Health Interview Survey participants, a third was selected for the Health Examination, Health Behavior and Nutrition Surveys. A more detailed description of the sampling design has been published elsewhere (Ryu et al., 2001). The surveys were conducted on November, 2001 in the respondents' homes by the field staff, and the Health Examination was done in local health centers.
For this study, adults aged 20 to 85 were selected, each of whom completed the Health Interview, the Health Examination and the Nutrition Survey. Pregnant women were excluded (n=52). The final sample size was 5,132. An individual was considered to have T2D if he/she was taking a pill for diabetes or if they had plasma glucose levels of ≥126 mg/dl following at least 8 hours of fasting (World Health Organization, 1999). With this definition, type 1 diabetes cannot be excluded. However, in Korea as in the rest of the world, the overwhelming proportion of cases identified through this definition would have T2D.

Risk factors

Potential socioeconomic, demographic, and behavioral risk factors for T2D were studied. Age, gender, education, employment and poverty income ratio (PIR) were examined as socioeconomic and demographic factors. Cigarette smoking, alcohol drinking, physical activity, dietary quality and obesity were included as behavioral risk factors. Family history of diabetes and co-morbidity were added to the analysis as covariates.
Socioeconomic status (SES) was examined through the education, employment and PIR variables. Education was classified as low for subjects who did not complete high school, and high for those who had a high school diploma or more. Persons reported as currently not having a job or as a housewife were classified as unemployed. The PIR was the ratio of the family income to the poverty threshold, which is based on the minimum standard cost of living set by the Ministry of Health and Welfare based on and adjusted by family size (Ministry of Health and Welfare, 2006). The ratio less than 1.2 was defined as being below the poverty threshold, and the ratio of 1.2 or above as being above the poverty threshold.
Self-reported cigarette smoking, alcohol drinking and physical activity were included as lifestyle indicators. To determine smoking status, we used two questions: "Have you smoked at least 100 cigarettes in your entire life?" and "Do you smoke cigarettes now?" Ever smoking was defined by a positive answer to the first question, and current smoking was defined by a positive answer to both questions. Those who consumed alcoholic drinks "sometimes" or "often" were classified as drinkers. Physical activity adequacy was defined as doing vigorous exercise that causes sweating or deep breathing, at least three times for 30 minutes or four times for 20 minutes per week.
Abdominal and overall adiposity were measured by waist circumference (WC) and body mass index (BMI) respectively. We used the WC cutoff points of ≥90 cm for men and ≥85 cm for women, as recommended by the Korean Obesity Society (Korean Society for the Study of Obesity, 2005). BMI was classified into underweight (<18.5), normal (18.5-24.9), and overweight (25.0-29.9), and obese (≥30.0) categories (World Health Organization, 2000).
Dietary quality was examined using the Mean Adequacy Ratio (MAR) based on a single 24-hr recall per participant. The overall MAR was the sum of the Nutrient Adequacy Ratio (NAR) for each of nine nutrients (protein, vitamin A, vitamin B1, vitamin B2, niacin, vitamin C, calcium, phosphorus, and iron). The NAR was the nutrient intake calculated as a percentage of the Recommended Dietary Allowance (RDA). Each NAR greater than 1 was considered as 1 to avoid high consumption levels of some nutrients compensating for low levels of others in the resulting MAR (Kant, 1996). Subjects below the median of the MAR distribution were regarded as low, and those above the median were regarded as high.
A family history of diabetes was defined as having blood relatives, alive or deceased, with T2D. Persons reported being told by a doctor or other health professional that he/she had congestive health failure, coronary heart disease, angina pectoris, heart attack, or cancer were classified as having a co-morbid condition.

Statistical analysis and statistical model building procedure

All statistical procedures were performed using SPSS for Windows, version 13. Bivariate associations between socioeconomic, demographic and behavioral variables studied were examined by Spearman rho correlations. Individual associations of the independent variables with T2D were examined with the Chi-square test of independence. Survey weights were taken into account to calculate prevalence and standard errors.
Multiple logistic regression analyses were carried out to estimate the factors which influence the prevalence of T2D with two categories of independent variables: (i) socioeconomic and demographic factors, and (ii) behavioral risk factors. In model 1, socioeconomic and demographic variables were examined together for their associations with T2D as the dependent variable. In a separate model, behavior risk factors and covariates were assessed (model 2). All variables in model 1 and model 2 were examined together in model 3. Because of a strong correlation between WC and BMI, we examined their relationship with T2D in separate models. WC appeared to have a greater influence on the model efficiency, thus the models presented are based on WC. We also examined the relationship of smoking with T2D in two separate models, one with current smoking and other with ever smoking. Ever smoking was included in the final models because of its greater influence on the model efficiency.
We performed multivariate logistic regressions with backward elimination procedure using SPSS for Windows. All variables having p < 0.15 on the bivariate analyses were included in the model. We chose the p level of 0.15 to avoid excluding relevant variables from the model. Gender and alcohol drinking were included in the model despite having a weak significance (p=0.631, p=0.271, respectively) with T2D. Once the main effects in each model were identified, interactions among the variables in the model were examined (Hosmer & Lemeshow, 2000). The interaction variables were added, one at a time, to the model containing all the main effects and kept in the model if they had a p value ≤ 0.05. Once all significant interaction terms were included, main effects having p ≥ 0.05 were removed if they were not included in interaction terms. Odds ratios and the corresponding 95% Confidence Interval (CI) were obtained for each variable that was used in the logistic regression model. The Hosmer-Lemeshow goodness of fit index was used to assess model fit (Hosmer & Lemeshow, 2000).

Results

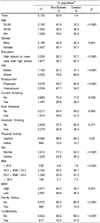
The prevalence of T2D in this population was 7.4% (Table 1). Individuals with T2D were significantly older, less educated, poorer and unemployed. WC and BMI were significantly higher in persons with T2D. Persons with T2D had lower dietary quality and were less physically active. There was no significant difference in T2D prevalence by gender, smoking, or alcohol drinking status. Correlations between all of the examined independent variables were shown in Table 2.
Multivariate logistic regression results were presented in Table 3. The results from model 1, that only included socioeconomic and demographic variables, indicated that being less educated (OR 1.45 (95% CI = 1.11-1.90)) older (OR 3.12 (95% CI=1.95-5.00) among 40-59 years old, OR 4.67 (95% CI =2.80-7.78) among 60 years old and over, respectively) were more likely to have T2D. However, gender modified the relationship of T2D with age. While the risk among men increased gradually with age, it showed a sharp increase in the group of women aged 60 and over. This interaction became insignificant after controlling for behavioral risk factors. The PIR and employment status had no relationship with T2D in this model.
In model 2, which included behavioral risk factors, persons with high WC were about 3.4 times (95% CI=2.57, 4.62) more who smoked at least 100 cigarettes in their entire life were 1.7 times (95% CI=1.26, 2.26) more likely to have T2D. Abdominal obesity mediated the relationship of ever smoking to T2D. Ever smokers were more likely to have T2D in non obese group and this smoking-associated risk was equally high among obese group. Two covariates, having family history of diabetes and having co-morbidities, were also significantly and positively associated with T2D.
Model 3 included socioeconomic, demographic, and behavioral factors together. Age and education remained significant in the two models. The education level regression coefficient remained almost unchanged. WC, family history and co-morbidity also remained significant even after controlling for behavioral risk factors. MAR became insignificant in model 3.
PIR, employment status and physical exercise which had shown significant differences in Table 1 were not included in any model during backward stepwise elimination procedures.

Discussion

This study found that there was a relationship between low level of education and T2D in Koreans. Less educated persons were found to have a significantly higher likelihood of having T2D even after adjusting for other confounders. This relationship is consistent with studies previously conducted in Asian countries as well as in developed countries (Dalstra et al., 2005; Fitzgerald, 2004; Kim et al., 2004; Wong et al., 2002; Zhang & Wang 2004). The Korean population has a great variability in education level as a function of age and gender. The elder generation who experienced the Korean War in 1950 had few opportunities to get educated. Higher education opportunities were more available to younger generations exposed to the industrialization era that began in the 1970's (Kim et al., 2005b). PIR and employment status were associated with T2D in the socioeconomic model but not in the model that controlled for behavioral factors as well. In both developed and developing countries, education has been shown to be a more powerful predictor of health outcomes than income inequality (Fitzgerald, 2004; Miller, 2002; Wong et al., 2002). Lack of high school education may be associated with the lifetime effect of adverse social conditions increasing the likelihood to T2D. These results stress the importance of addressing educational disparities as part of T2D prevention efforts.
There was a strong relationship between age and T2D. Increased insulin resistance and gradual malfunctioning of insulin-producing cells as human age can explain this commonly found relationship. The prevalence of T2D in subjects aged 60 years and over was 16%, a lot more compared to younger age groups (2.8% in 20-39 years and 7.3% in 40-59 years old group). We found, however, that the association between age and T2D was modified by gender. After controlling for socioeconomic factors, the prevalence of T2D in the 40-59 years old group was higher in men comparing to women, while the pattern was reversed in the older age group.
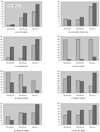
The mechanism by which gender mediated the association of age with T2D could be explained in two ways: lifestyle behaviors and biological aspects. First, the T2D pattern as a function of gender change across generations. To support this assumption, we examined the gender-specific prevalence of unfavorable SES and lifestyle behaviors to T2D by age group (Fig. 1). Overall, the older groups had higher prevalence of risk factors for T2D except alcohol drinking and ever smoking. This pattern was more dramatic when comparing the 40-59 years old with the older group, than when comparing the 20-39 years old group with the 40-59 years old. There was an overall trend of higher prevalence of risk factors for T2D in all age groups in women compared to men, except alcohol drinking and ever smoking. The most interesting risk factor was abdominal obesity, which showed different patterns across age. The prevalence was higher in women than in men among the older group, showed no gender difference among 40-59 years old, and higher in men than in women among young generation. Lower physical activity in old women might contribute to the high prevalence of obesity in the group.
Metabolic changes caused by menopause may be another explanation. With menopause, women accumulate central fat, which increases the risk of T2D (Toth et al., 2000). Several studies have suggested a reduced incidence of T2D in postmenopausal women receiving hormonal therapies. However, the question of whether the benefit may occur through a reduction in insulin resistance is uncertain (Goodrow et al., 2006; Margolis et al., 2004). In a systematic review, Ding et al suggested that the influence of endogenous sex hormones on T2D risk is a function of gender (Ding et al., 2006). Further studies are needed to verify if and how gender modifies the relationship between age and T2D.
Smoking can affect T2D by acutely impairing insulin action, increasing hepatic lipase activity or inducing oxidative stress (Patja et al., 2005). Although many studies have shown an association between smoking and T2D (Al-Delaimy et al., 2001; Hu et al., 2001; Kawakami, 1997; Sairenchi et al., 2004; Will, 2001), the effect size has varied considerably across studies. This is perhaps explained by the nature of the data collected on smoking status including history, intensity, duration, age at initiation, and time since cessation of smoking (Leffondre et al., 2002; Patja et al., 2005; Sairenchi et al., 2004). Therefore, we examined and compared the association of smoking status with T2D with ever smoking or with current smoking in separate models. Ever smokers were 1.7 times more likely to have T2D and this relationship remained significant even after adjusting for socioeconomic and demographic factors.
In comparison to ever smoking, current smoking was not significantly associated with T2D. Thus, ever smoking may be a better predictor of T2D than current smoking. This is reasonable as many prior smokers are likely to quit when they are diagnosed with T2D. To verify this assumption, we compared the proportion of smokers according to ever- and current- smoking status among non-diabetic and diabetic groups. As expected, the smoking quitting rate was higher in diabetic group than in non-diabetic group (Fig. 2). In this sample, 37.4% of the elderly persons with T2D were classified as smokers when using ever- smoking as indicator, but only 17.4% when using current smoking. Thus, we concluded that ever smoking is a better predictor than current smoking as a risk factor for T2D in cross-sectional surveys.
Abdominal obesity was a strong predictor of T2D. In this population, abdominal obesity was associated with a twofold likelihood of having T2D even after controlling for other factors. The prevalence of abdominal obesity was 24.4% in men and 23.8% in women. From two separate analyses, we confirmed that abdominal adiposity was more strongly associated than overall obesity with T2D (data not shown). This is consistent with previous studies (Fitzgerald, 2004; Wang et al., 2005; Wei et al., 1997).
The predominant feature of obesity in this population was that the relative proportion of overweight persons to obese was high. The rate of being overweight, defined by 25 ≤ BMI < 30, was 30.2% in men and 24.9% in women and the rates of obesity, defined by ≥ 30, was 2.5% in men and 3.2% in women, much lower than those in western populations. A cohort study of Korean adults reported that the age-adjusted incidence of T2D increased in an exponential pattern in persons having a BMI of 21-22 and above with an even faster increase among women (Oh et al., 2004), which is comparable with the linear relations of obesity with T2D in the range of BMI less than 30 seen in Western populations (Willett et al., 2006). Several studies reported that, for a given BMI, Asians have higher risk of T2D (Chen et al., 2002). The BMI-adjusted prevalence of diabetes is 60% higher in Asian Americans compared to non-Hispanic White Americans (McNeely & Bokyo, 2004). This relatively high prevalence of T2D despite of lower BMIs may be explained by a thrifty gene hypotheses (Swinburn, 1996).
More importantly, the overweight population has been rapidly increasing in Korea at an annual rate of 1.3% during the period of 1998 to 2001 (Kim et al., 2005a). This pattern is comparable to the rapid increase in the proportion of obese people in the U.S (Flegal et al., 1998). This strongly suggests that diabetes prevention efforts in Korea should include people at risk of obesity (i.e., overweight) and not only those who are already obese.
The association of smoking with T2D was mediated by obesity after adjusting for other behavioral risk factors. The relationship between ever smoking and T2D was only found among non obese group. In general, smoking may distort the true association between obesity and the health problem because smokers tend to weigh less (Willett et al., 2006). A study reported that smoking quitting rates were affected by socioeconomic status, as well as age (Khang & Cho, 2006). More studies are needed to better understand the relationship.
Dietary quality was significantly associated with T2D in the model that included only behavioral factors. However, it became insignificant after adding socioeconomic variables to the model.
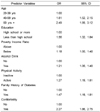
Alcohol drinking did not show any significant association with T2D in the models that included abdominal obesity. Considering heavy alcohol drinking habits among middle-aged Korean men (Kim et al., 2005a), we examined the relationship of alcohol drinking to WC. After adjusting for other factors, high consumption of alcohol drink was a significant predictor of high WC (Table 4).
One limitation of our study is that our analysis was based on cross-sectional survey data, which prevents causality inferences. Thus, through this study design it is not possible to determine to what extent people changed their lifestyles as a result of T2D. Daily nutrient intake measured by one-day 24 hour recall data may have a bias. This was the only available national data in Korea.
In conclusion, our findings have important implications for targeting efforts to develop and implement prevention intervention programs for T2D in Korea. These efforts need to focus on the less educated and should include persons who are overweight as well as obese, and persons who previously smoked, regardless of their current smoking habits. Moreover, interaction between age and gender or between abdominal obesity and ever smoking should be taken into account. To our knowledge, this paper was the first study identifying interactions among risk factors to T2D in Korean population.

Figures and Tables

Fig. 1
Gender specifie prevalence of unfavourable SES and lifestyle behaviors to T2D by age group
nrp-3-286-g001
Fig. 2
Proportion of smokers according to ever-and current-smoking status among non-diabetic and diabetic groups
nrp-3-286-g002
Table 1
Participant Characteristics by Diabetes Status
nrp-3-286-i001

abbreviations: PIR, poverty income ratio; WC, waist circumference; MAR, mean adequacy ratio

aunadjusted sample size

bpercentages were adjusted for the sample design.

cRefers to χ2 test

Table 2
Correlations among Socioeconomic, Demographic and Behavioral Risk Factors
nrp-3-286-i002

*indicates statistical significance at P=0.05 level, unadjusted

**indicates statistical significance at P=0.01 level, unadjustedvariables are defined as age (1 20-39 years, 2 40-59 years, 3 60 years and over), gender (1 male, 2 female), education (1 less than high school, 2 high school or more), employment (1 unemployed, 2 employed), Poverty Income Ratio (1 below, 2 above), Waist Circumference (1 normal, 2 obese), BMI (1 < 18.5, 2 18.5 ≤ BMI < 25.0, 3 25.0 ≤ BMI < 30, 4 ≥ 30.0), Mean Adequacy Ratio (1 below, 2 high), current smoking (1 no, 2 yes), ever smoking (1 no, 2 yes), alcohol drinking (1 no, 2 yes), physical activity (1 inactive, 2 active), family history of diabetes (1 no, 2 yes), comorbidity (1 no, 2 yes)

Table 3
Multivariate Logistic Regression Determinants of T2D Status
nrp-3-286-i003

abbreviations : WC, waist circumference; MAR, mean adequacy ratio.

1)Hosmer and Lemeshow χ2=3.65 df=6 P=0.72; Nagelkerke R2=9.6%. Variable excluded from the model during the stepwise procedure : gender, poverty income ratio, employment.

2)Hosmer and Lemeshow χ2=6.06 df=5 P=0.30; Nagelkerke R2=9.4%. Variable excluded from the model during the stepwise procedure : physical exercise, drinking

3)Hosmer and Lemeshow χ2=2.66 df=7 P=0.92; Nagelkerke R2=13.6%. Variable excluded from the model during the stepwise procedure : gender, poverty income ratio, employment, MAR, physical exercise, drinking

Table 4
Multivariate Logistic Regression Determinants of High Waist Circumference
nrp-3-286-i004

1)Hosmer and Lemeshow χ2=9.59, df=7 p=0.21; Nagelkerke R2=10.4%. Variable excluded from the model during the stepwise procedure : gender, employment. MAR, ever smoking

References

1. Al-Delaimy WK, Willett WC, Mansen JE, Speizer FE, Hu FB. Smoking and mortality among women with type 2 diabetes: The nurses's health study cohort. Diabetes Care. 2001. 24:2043–2048.
2. Centers for Disease Control and Prevention. Health status of Cambodians and Vietnamese- selected communities, United States, 2001-2002. MMWR Morb Mortal Wkly Rep. 2004. 53:760–765.
3. Chen GLX, Wang JJ, Xing X, Yang W, Hu Y. Obesity, coronary heart disease risk factors and diabetes in Chenese: an approach to the criteria of obesity in the Chinese population. Obes Rev. 2002. 2002:167–172.
4. Cho NH, Jang HC, Park HK, Cho YW. Waist circumference is the key risk factor for diabetes in Korean women with history of gestational diabetes. Diabetes Res Clin Pract. 2006. 71:177–183.
crossref
5. Dalstra JAA, Kunst AE, Borrell C, Breeze C, Cambois E, Costa G, Geurts JJ, Lahelma E, Van Oyen H, Rasmussen NK, Regidor E, Spadea T, Mackenbach JP. Socioeconomic differences in the prevalence of common chronic diseases: an overview of eight European countries. Int J Epidemiol. 2005. 34:316–326.
crossref
6. Ding EL, Song Y, Malik VS, Liu S. Sex differences of endogenous sex hormones and risk of type 2 diabetes- a systemic review and meta-analysis. JAMA. 2006. 295:1288–1293.
crossref
7. Fitzgerald N. Identification of risk factors mediating the associations of socioeconomic, cultural, and demographic factors with type 2 diabetes across ethnic groups. 2004. USA: University of Connecticut;PhD dissertation.
8. Flegal KM, Kuczmarski RJ, Johnson CL. Overweight and obesity in the United States: Prevalence and trends, 1960-1994. Int J Obes Relat Metab Disord. 1998. 22:39–47.
crossref
9. Goodrow GJ, L'Hommedieu GD, Gannon B, Sites CK. Predictors of worsening insulin sensitivity in postmenopausal women. Am J Obstet Gynecol. 2006. 194:355–361.
crossref
10. Hosmer DW, Lemeshow S. Applied logistic regression. 2000. 2nd ed. New York. USA: John Wiley & Sons Inc.
11. Hu FB, Manson JE, Stampfer MJ, Colditz G, Liu S, Solomon CG, Willett WC. Diet, lifestyle and the risk of type 2 diabetes mellitus in women. N Engl J Med. 2001. 345:790–797.
crossref
12. World Economic Outlook 2006. International Monetary Fund. 2007. 3/20/2007. http://www.imf.org/external/pubs/ft/weo/2006/02/index.htm.
13. Kant AK. Indexes of overall diet quality: a review. J Am Diet Assoc. 1996. 96:785–791.
14. Kawakami N. Effects of smoking on incidence of non-insulin dependence diabetes mellitus. Am J Epidemiol. 1997. 145:103–109.
15. Khang YH, Cho HJ. Socioeconomic inequality in cigarette smoking : Trends by gender, age and socioeconomic position in South Korea, 1989-2003. Prev Med. 2006. 42:415–422.
crossref
16. Kim SW, Symons M, Popkin BM. Contrasting socioeconomic profiles related to healthier lifestyles in China and the United States. Am J Epidemiol. 2004. 59:184–191.
crossref
17. Kim DM, Ahn CW, Nam SY. Prevalence of obesity in Korea. Obes Rev. 2005a. 6:117–121.
crossref
18. Kim MH, Kim MK, Choi BY, Shin YJ. Educational disparities in the metabolic syndrome in a rapidly changing society--the case of South Korea. Int J Epidemiol. 2005b. 34:1266–1273.
crossref
19. Kim SM, Lee JS, Lee J, Na JK, Han JH, Yoon DK, Baik SH, Choi DS, Choi KM. Prevalence of diabetes and impaired fasting glucose in Korea. Diabetes Care. 2006. 29:226–231.
crossref
20. Ko MJ, Kim MT, Nam JJ. Assessing risk factors of coronary heart disease and its risk prediction among Korean adults : The 2001 Korea national health and nutrition examination survey. Int J Cardiol. 2006. 110:184–190.
crossref
21. Korean Society for the Study of Obesity. Report on cut-off point of body mass index and waist circumference for criteria of obesity and abdominal obesity among Korean. 2005. Seoul. Republic of Korea: 2–3.
22. Leffondre K, Abrahamowicz M, Siemiatycki J, Rachel B. Modeling smoking history : A comparison of different approaches. Am J Epidemiol. 2002. 156:813–823.
23. Margolis KL, Bonds DE, Rodabough RJ, Tinker L, Philips LS, Allen C, Bassford T, Burke G, Torrens J, Howard BV. Effect of oestrogen plus progestin on the incidence of diabetes in postmenopausal women: results from the women's health initiative hormone trial. Diabetologia. 2004. 47:1175–1187.
crossref
24. McNeely MJ, Boyko EB. Type 2 diabetes prevalence in Asian Americans. Diabetes Care. 2004. 27:66–69.
crossref
25. Miller A. Education, income inequality, and mortality : a multiple regression analysis. BMJ. 2002. 324:23–26.
26. National Basic Livelihood Program. Ministry of Health and Welfare. 2006. Accessed on 8/20/2006. http://www.mohw.go.kr.
27. 2003 statistical results about cause of death. National Statistical Office. 2006. Accessed on 8/15/2006. http://www.nso.go.kr.
28. Oh SW, Shin SA, Yun YH, Yoo TW, Huh BY. Cut-off point of BMI and obesity-related comorbidities and mortality in middle-aged Koreans. Obes Res. 2004. 12:2031–2040.
crossref
29. Patja K, Jousilahti P, Hu G, Valle T, Qiao Q, Tuomilehto J. Effects of smoking, obesity and physical activity on the risk of type 2 diabetes in middle-aged finnish men and women. J Intern Med. 2005. 258:356–362.
crossref
30. Ryu JB, Lee KO, Kim YW. A sampling design for the 2001 national health and nutrition survey. Applied Statistics Research. 2001. 14:289–304.
31. Sairenchi T, Iso H, Nishmura A, Hosoda T, Irie F, Saito Y, Murakami A, Fukutomi H. Cigarette smoking and risk of type 2 diabetes mellitus among middle-aged and elderly Japanese men and women. Am J Epidemiol. 2004. 160:158–162.
crossref
32. Singh GK, Hiatt RA. Trends and disparities in socioeconomic and behavioral characteristics, life expectancy and cause-specific mortality of native-born and foreign-born populations in the United States, 1979-2003. Int J Epidemiol. 2006. 35:903–919.
crossref
33. Sung EJ, SW S, Kim SW, Kim YS. Obesity as a risk factor for non-insulin-dependent diabetes mellitus in Korea. J Korean Med Sci. 2001. 16:391–396.
crossref
34. Swinburn B. The thrifty genotype hypothesis: How does it look after 30 years? Diabet Med. 1996. 13:695–699.
crossref
35. Toth MJ, Tchernof A, Sites CK, Poehlman E. Menopause-related changes in body fat distribution. Ann N Y Acad Sci. 2000. 904:502–506.
crossref
36. Wang Y, Rimm EB, Stampfer MJ, Willett WC, Hu FB. Comparison of abdominal adiposity and overall obesity in predicting risk of type 2 diabetes among men. Am J Clin Nutr. 2005. 81:555–563.
crossref
37. Wei M, Gaskill SP, Haffner SM, Stern MP. Waist circumference as the best predictor of noninsulin dependent diabetes mellitus (NIDDM) compared to body mass index, waist/hip ratio and other anthropometric measurements in Mexican Americans-a 7-yrea prospective study. Obes Res. 1997. 5:16–23.
crossref
38. Will JC. Cigarette smoking and diabetes mellitus: Evidence of a positive association from a large prospective cohort study. Int J Epidemiol. 2001. 30:554–555.
crossref
39. Willett WC, Dietz WH, Colditz GA. Guidelines for healthy weight. N Engl J Med. 2006. 341:427–434.
crossref
40. Wong MD, Shapiro MF, Boscardin J, Ettner SL. Contribution of major diseases to disparities in mortality. N Engl J Med. 2002. 347:1585–1592.
crossref
41. World Health Organization. Definition, diagnosis and classification of diabetes millets and its complications, WHO/NCD/NCS/99.2. Report of a WHO Consultation. 1999. Geneva. Switzerland:
42. World Health Organization. Obesity: Preventing and managing the global epidemic. WHO Technical Report Series 894. 2000. Geneva:
43. Zhang Q, Wang Y. Trends in the association between obesity and socioeconomic status in U.S. adults. Obes Res. 2004. 12:1622–1632.
crossref
TOOLS
Similar articles