

 PDF
PDF ePub
ePub Citation
 Print
Print


Introduction
Diabetes mellitus, both insulin-dependent (type 1 diabetes) and non-insulin-dependent (type 2 diabetes), is a common and serious disorder throughout the world (Harris et al., 1987; Keen, 1986). The number of people with diabetes is increasing all over the world because of population growth, aging, urbanization, and increasing prevalence of obesity and physical inactivity (Wild et al., 2004). The dietary habit has become westernized, and the intake of processed food has increased because the rate of economic growth has increased rapidly and the standard of living has improved in Korea. Moreover, the intake of micronutrients, vitamins and minerals, has reduced (Chen et al., 1991; Kim & Paek, 1997). With these changes of dietary life, the mortality of diseases such as cancer, heart disease, hypertension and diabetes has risen steadily these days. The incidence of diabetes over 30 years old has increased from 6.6% in 1998 to 8.1% in 2005 (Ministry of Health and Welfare, 1999; Ministry of Health and Welfare, 2006), and many diabetic experts are predicting that the incidence of diabetes would increase steadily (Rhee, 2003). Most of the Koreans have type 2, non-insulin dependent diabetes mellitus (Song et al., 2007).
Type 2 diabetes is one of the chronic metabolic disorders. Reduction of insulin secretion and impairment of insulin action cause an abnormal metabolic regulation. Type 2 diabetes is made up of multiple forms, each of which is characterized by variable degrees of insulin resistance and β-cell dysfunction, which together leads to hyperglycemia (Bernard, 2005). Insulin resistance is associated with a number of metabolic disorders. If hyperglycemic status is kept for a long time, it can cause cardiovascular diseases such as hyperlipidemia and hypertension. (Haffner et al., 1998). Moreover, insulin resistance is a common physiologic abnormality characterized by an impaired response to insulin in insulin sensitive tissues such as muscle, liver, and adipose tissues, and it is a major symptom of type 2 diabetes (Simonson & Kendalla, 2005). Hence many people have made efforts to improve insulin resistance. Dietary effort is one of the helpful solutions in improving insulin resistance. A lot of studies have evaluated effects of natural products safety confirmed to improve and prevent diseases. Representatively, chlorella is worthy of notice.
Chlorella has long been a popular functional food in Asian countries including Korea, Japan and Taiwan. It has little bio-availabilities and is acknowledged as good food (Cherng & Shih, 2005a). Chlorella is a good source of protein, lipid soluble vitamins, choline, dietary fiber and essential minerals. Many studies have been performed to figure out the biochemical and physiological functions of chlorella, such as promoting the growth rate of animals, boosting immune function, preventing stress-induced ulcers, and preventing high-fat diet induced dyslipidemia. The effects of chlorella, such as fatigue recovery, degradation of toxic materials, heavy metal removal, and environmental application were also studied (Cherng & Shih, 2005a; Cherng & Shih, 2005b; Han et al., 2002; Kang et al., 2004; Sano et al., 1988). The hypoglycemic effect is one of them. Although the acute administration of chlorella produced a significant hypoglycemic effect in alloxan-induced rats or streptozotocin (STZ)-induced mice (Cherng & Shih, 2005a; Rodiriguez-Lopez, 1964), it is difficult to explain that long-term intake of chlorella has hypoglycemic effect. Also, previous studies used the type 1 diabetic model that suggested that chlorella doesn't affect insulin secretion but improves insulin resistance. This could not explain the hypoglycemic effect of chlorella in type 2 diabetes. Therefore, it is necessary to study about the effects of the long-term chlorella intake on type 2 diabetic model. Thus, this study examined if the intake of chlorella had a hypoglycemic effect in six week-old GK rats with type 2 diabetes and normal Wistar rats, respectively.
Materials and Methods
Preparation of Chlorella
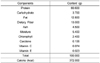
Chlorella used in this experiment was supplied by Daesang Co. Ltd., (Korea) in powdered form of Chlorella Vulgaris. The specification of chlorella is shown in Table 1.
Animals
Thirty six week-old male GK rats [GK/Slc, inbred, Tohoku University School of Medicine Origin; Jung-Ang Lab Aminal, Inc., Korea] and thirty six week-old male Wistar rats [Slc :Wistar/ST, outbred, Institute of Medical Science Origin; Jung-Ang Lab Animal, Inc., Korea] were placed in individual stainless steel wire-mesh cages in a climate-controlled room. The room had a 12 hour light-dark cycle, a temperature of 22-24℃, and a relative humidity of 45 ± 5%. This study was conducted at the nutrition laboratory of Ewha Womans University, in compliance with the Guide for the Care and Use of Laboratory Animals (Nutrition Research Council, 1995). The rats were fed a pellet diet (Samyang Co., Korea) for the first seven days (adaptation period). The GK rats weighed 139.30 ± 12.86 g and the Wistar rats weighed 175.40 ± 5.75 g after the adaptation period. The body weight of GK rat is 10-30% lower than that of the age and sex-matched Wistar rat (Bernard, 2005). They were then stratified according to body weight and randomly blocked into three groups for the experimental periods, which lasted for eight weeks, respectively.
Experimental diets
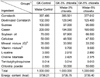
The compositions of experimental diets are shown in Table 2. The experimental diets were formulated according to the nutrient content of the 93G diet of the American Institute of Nutrition (AIN) (Reeves et al., 1993), with slight modification. Three different experimental diets replaced the control diet, with different levels of chlorella (0%, 3% or 5%, w/w). There were no differences in total calories among the three experimental diets. Cornstarch (Daesang Co., Korea), sucrose (Dyets, Inc., USA), Dextrinized cornstarch (Dyets, Inc., USA), were used as sources of carbohydrate. Soybean oil (CJ Co., Korea) was used as a source of lipid. Casein (Murray Goulburn Co-operative Co., Australia) was used as a source of protein. Mineral and vitamin mixtures were prepared in accordance with the 1993 recommendation of the AIN (Dyets, Inc., USA). All the other materials were purchased from Dyets Inc. (USA).
The rats were allowed free access to the experimental diets and deionized water during the experimental period. Body weight was recorded once a week. To determine the food intake, the amount of food offered was weighed and the weight of scraps and waste were recorded three times per week.
Specimen collection
At the end of the experimental period, the animals were fasted for 12 hours. The rats were sacrificed after anesthetization with ethyl ether. The liver samples were frozen in liquid nitrogen and stored at -80℃ until analysis for indices of lipid levels. The blood samples were collected directly from the heart, using syringes treated with either heparin (5,000 IU/mL) or 3.8% sodium citrate. Blood samples collected with heparinized syringes were transferred to polypropylene tubes, and those treated with 3.8% sodium citrate were transferred to polypropylene tubes containing ethylenediaminetetraacetic acid (EDTA) and polypropylene tubes containing 500 IKU/mL of aprotinin (Sigma-Aldrich Co., USA), which were placed in an ice bath for 20 minutes and the blood samples contained in polypropylene tubes were centrifuged at 2,800 rpm for 30 minutes at 4℃ (Union 55R centrifuge, Hanil, Korea). The aprotinin is an inhibitor of proteolytic enzymes including chymotrypsin, plasmin, trypsin, elastase, kallikrein, et cetra. Treatment of EDTA and aprotinin to the blood samples is recommended to avoid breakdown of glucagons (Wakasugi, 1989). Then plasma was transferred to microtubes. Heparin-treated plasma was frozen at -80℃ until analysis for insulin concentration. Plasma treated with EDTA was frozen at -80℃ until analysis for activities of AST and ALT, and concentrations of total protein and albumin. Plasma treated with EDTA and aprotinin was frozen at -80℃ until analysis for concentration of glucagons (Wakasugi, 1989).
Measurements
Measurement of liver function and toxicity
The total lipid concentration of liver was measured using the method of Bligh & Dyer (Bligh & Dyer, 1959). The lipid extract from the liver was dissolved in 5 mL methanol, and concentrations of triglyceride and total cholesterol were determined using a kit (Asan Pharmaceutical, Korea) based on an enzymatic colorimetric method, respectively (Fossati & Prencipe, 1982; McGowan et al., 1983). Plasma aspartate aminotransferase (AST) and alanine aminotransferase (ALT) activities were measured using a kit (Asan Pharmaceutical, Korea) based on the Reitman-Frankel method (Reitman & Frankel, 1957). Plasma total protein concentration was measured using a kit (Asan Pharmaceutical, Korea) based on Biuret reaction (Layne, 1957). Plasma albumin concentration was measured using a kit (Asan Pharmaceutical, Korea) based on Bromocresol green (BCG) method (Webster et al., 1974).
Plasma metabolite and hormone measurements
Blood glucose concentrations were determined immediately with an Accu-check (Roche diagnostics, Germany) at 0 and 30 minutes after glucose administration. Collected blood samples that were transferred to microtubes containing heparin were placed in an ice bath for 20 minutes and centrifuged at 4,000 rpm for 7 minutes at 4℃. Then enzyme-linked immunosorbent assay (ELISA) kit (Mercodia, Sweden) was used to determine the concentration of plasma insulin. Enzyme immunoassay (EIA) kit (Yanaihara Institute Inc., Japan) was used to determine the concentration of plasma glucagon concentration.
HOMA-IR
The fasting blood glucose and plasma insulin concentrations were used to calculate the homeostasis model assessment-insulin resistance (HOMA-IR): [HOMA-IR=(fasting plasma insulin (µg/L)×fasting blood glucose (mg/dL)/22.5)] (Asano et al., 2007; Nunes et al., 2007).
Insulinogenic-index
At six weeks after the feeding of experimental diets, all rats were fasted for 12 hours before the glucose-stimulated insulin secretion test. Glucose (1 g/kg body weight) was administrated orally, and blood samples were collected with heparinized capillary tubes from the ophthalmic vein at 0 and 30 minutes for measurement of blood glucose and plasma insulin concentrations. Then, insulinogenic-index was calculated using equation: [Insulinogenic-index = (30 min plasma insulin-fasting plasma insulin) / (30 min blood glucose-fasting blood glucose)] (Asano et al., 2007; Jue et al., 2003; Pratley & Weyer, 2002).
Statistical analysis
All experiments were performed in duplicate and all statistical analyses were performed by the SAS program package version 9.1. All results were expressed as the mean ± standard error (SE). The data were analyzed by one-way analysis of variance (ANOVA) and differences between experimental groups were evaluated using Duncan's multiple range tests at the P < 0.05 level.
Results
Food intake and body weight gain
Food intake, calorie intake, body weight gain and food efficacy are shown in Table 3. In both diabetic GK and normal Wistar rats, there were no significant differences among the groups.
Liver function and toxicity
In Table 5, the hepatic triglyceride concentrations of the GK-3% chlorella and GK-5% chlorella groups were significantly lower than that of the GK-control group. The liver concentrations of total lipid and total cholesterol were not significantly affected by the intake of chlorella. In normal Wistar rats, the concentrations of total lipid, triglyceride and total cholesterol were not influenced by the intake of chlorella.
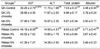
The plasma AST and ALT activities are shown in Table 4. There were no significant differences among the diabetic GK groups. In normal Wistar rats, the activities were within the reference range of 39.92-92 IU/L for AST activity and 17-50 IU/L for ALT activity (The Koreas Society of Food Science and Nutrition, 2000). Therefore, the intake of chlorella with different levels did not affect liver and heart function and was regarded as nontoxic in diabetic GK and normal Wistar rats.
As shown in Table 4, the plasma total protein and albumin concentrations were not significantly different among the diabetic groups, and the concentrations were within the reference ranges of 6.3-8.6 g/dL for plasma total protein concentration and 3.3-4.9 g/dL for plasma albumin concentration in normal Wistar rats (The Koreas Society of Food Science and Nutrition, 2000). As the result, feeding of chlorella did not cause protein malnutrition in diabetic GK and normal Wistar rats.
Insulinogenic-index
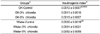
As shown in Table 6, there was no significant difference of the insulinogenic-indices in both diabetic GK and normal Wistar rats, but that of the 5% chlorella fed group was slightly higher than those of the control and 3% chlorella groups in normal Wistar rats.
HOMA-index and Concentrations of fasting blood glucose, plasma insulin and glucagon
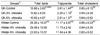
Table 7 showed the HOMA-index and concentrations of fasting blood glucose, plasma insulin and glucagon. In diabetic GK rats, there were no significant difference of the HOMA-IR and the concentrations of the fasting blood glucose and plasma insulin. However, the fasting plasma glucagon concentrations and insulin/glucagon ratios of the GK-3% chlorella and GK-5% chlorella groups were significantly lower than those of the GK-control group. In normal Wistar rats, the HOMA-IR and the concentrations of the fasting blood glucose and plasma insulin were not significantly decreased by the intake of the experimental diet containing 5% chlorella, but the fasting plasma glucagon concentration and insulin/glucagon ratio of the Wistar-5% chlorella group were significantly higher than those of the Wistar-control and the Wistar-3% chlorella groups.
Discussion
The aim of this study was to examine the hypoglycemic effect of chlorella in type 2 diabetic Goto-Kakizaki (GK) and normal Wistar rats. During the experimental period, the insulinogenic-index was calculated to determine the effect of chlorella on the insulin secretion capacity. At the end of the experiment, the concentrations of the fasting blood glucose, plasma insulin, glucagon and hepatic lipids were measured, and the homeostatic model assessment-insulin resistance (HOMA-IR) was calculated using the fasting blood glucose and plasma insulin concentrations to examine the effect of chlorella intake on the insulin sensitivity.
First of all, the insulinogenic-index was calculated using the blood glucose and the plasma insulin concentration changes during the 30 minutes after the administration of glucose as a marker of the insulin secretion at six weeks after the feeding of experimental diets that contained different levels of chlorella. Goto-Kakizaki rats are resistant to the action of insulin and the compensatory attempt by the β-cells to release more insulin is not sufficient to maintain blood glucose concentrations, leading to the functional exhaustion of the surviving β-cells (Bernard, 2005). It was expected that the intake of chlorella could improve the glucose-stimulated insulin secretion, but it was observed that the insulinogenic-indices of the diabetic GK rats were not influenced by the intake of chlorella. Moreover, those of the normal Wistar rats were not significantly different among the group either, but that of the Wistar-5% chlorella groups was very slightly higher than those of the Wistar-control, Wistar-3% chlorella groups. Previous studies (Cherng & Shih, 2005b; Rodríguez-López & López-Quijada, 1971) reported that chlorella had no influence on insulin secretion.
In the work using alloxan induced-diabetic Wistar, type 1 diabetic model, rats were injected intraperitoneally of chlorella pyrenoidosa (1 mg/kg body weight). Forty-eight hours later, the plasma glucose and insulin concentrations were measured in the rats fasted for 15 hours. The plasma glucose concentrations of the alloxan induced-diabetic Wistar rats fell clearly when chlorella was injected, but the plasma insulin concentration was unchanged. The study concluded that the injection of chlorella did not affect the fasting plasma insulin concentration in type 1 diabetic rats (Rodríguez-López & López-Quijada, 1971). Another study also evaluated the effect on insulin secretion of chlorella in streptozotocin (STZ)-induced diabetic mice (type 1 diabetic model). Twenty minutes before the blood collection, 100 mg/kg of chlorella or H2O was administrated to the STZ mice and normal mice. The insulin concentrations of the chlorella treated STZ mice and normal mice were not different from the H2O-treated STZ mice and normal mice (Cherng & Shih, 2005b). These results of previous studies are somewhat in accordance with the results of this study that the intake of chlorella affects the insulin secretion capacity very slightly or not at all in both GK and Wistar rats. Chlorella might have the plasma glucose lowering effect, but that is not the effect of chlorella on insulin secretion.
Some biomarkers were measured to evaluate whether chlorella has hypoglycemic effects via enhancement of insulin sensitivity or not. To examine the effects of chlorella to improve the insulin sensitivity, the concentrations of the fasting blood glucose, plasma insulin, glucagon and hepatic lipids were measured, and the HOMA-IR was calculated in diabetic GK and normal Wistar rats, respectively.
The fasting blood glucose concentrations of the chlorella fed groups were tended to be lower than those of the chlorella non-fed group in diabetic GK rats. That seems to be leading to the small reduction of the plasma insulin concentrations. The high glucose and insulin concentrations are leading to hyperinsulinemia in type 2 diabetes. However, there was no significant difference of the fasting insulin concentrations between the chlorella non-fed groups despite of diabetes. It is assumed that the GK rats used in this study were six-week old. The insulin resistance of the young diabetic animals might be less than that of old diabetic animals and thus the insulin concentration might be not significantly different.
Consistent with the slightly lower fasting blood glucose concentrations of chlorella fed groups, the HOMA-IR of chlorella fed groups was tended to be lower. The HOMA-IR calculated using the fasting blood glucose and plasma insulin concentration is a method used to quantify insulin resistance and β-cell function (Asano et al., 2007; Matthews et al., 1985). Since the lower HOMA-IR means that the fasting blood glucose and/or insulin concentration is low, insulin resistance could be slightly reduced by the intake of chlorella in diabetic GK rats.
The slightly lower HOMA-IR of the chlorella fed groups seems to be related with the significantly lower hepatic triglyceride (TG) concentrations. Insulin resistance is related to dyslipidemia. Excessive glucose can be stored as glycogen in the liver and muscles or as TG by the lipogenesis pathway in adipose tissues (Cherng & Shin, 2006; Smith et al., 2005). When insulin resistance induces the lipolysis of adipose tissues, plasma non-esterified free fatty acids (NEFA) are also increased, thus affecting the liver. The excessive plasma NEFA is stored as TG in the liver and used for gluconeogenesis to induce hyperglycemia (Boden et al., 1998), and that could inhibit insulin-stimulated glucose utilization in muscles (Roden et al., 1996). In contrast, the reduction of plasma NEFA concentration could improve glucose utilization (Reaven et al., 1988) and enhance the suppression of hepatic glucose production by insulin (Saloranta et al., 1991), and reduce the high insulin concentration in type 2 diabetes (Boden et al., 1998).
Although the plasma NEFA concentration was not measured in this study, the work of Cherng and Shin (Cherng & Shin, 2006) measured that in STZ-induced diabetic mice after acute chlorella treatment (100 mg/kg of chlorella). The serum NEFA concentration of the chlorella administrated STZ-induced diabetic mice was significantly lower than that of the H2O administrated STZ-induced diabetic mice. Moreover, glucose uptake in the livers and muscles was increased after chlorella administration in STZ-induced diabetic and normal mice. The lowered NEFA concentration and enhanced glucose uptake in STZ-induced diabetic mice by the administration of chlorella could support the significantly lower hepatic TG concentrations in type 2 diabetic GK rats by the intake of chlorella. Therefore, these results from the chlorella fed groups could suggest the improvement of insulin resistance by the intake of chlorella in diabetic GK rats.
The plasma glucagon concentrations of the chlorella fed groups were significantly lower than that of the chlorella non-fed group. The significantly lower plasma glucagon concentrations of the chlorella fed groups were connected to the significantly higher insulin/glucagon ratio in diabetic GK rats. These significant effects could support the possibility of chlorella to help the improvement of hyperglucagonemia in type 2 diabetes. Because type 2 diabetes is a chronic metabolic disorder that not only is resulted from insulin resistance, but also is characterized by relative glucagons excess and pancreatic α-cell dysfunction. The characteristics of hyperglucagonemia are decreased sensitivity of cells to insulin or glucose and disturbances of insulin secretion (Ferrannini, 2007; Unger, 1978). A study of Choi et al. (2004) suggested that the duration of diabetes and poor glycemic control might be closely associated with relative hyperglucagonemia in Korean type 2 diabetic patients. Moreover, it has been reported that the absolute concentration of glucagon or the ratio of insulin to glucagon are often lowered in diabetes in both animals and human subjects (Jiang & Zhang, 2003; Unger, 1978).
The effect of chlorella on fasting glucagon concentration is similar to excendin-4 isolated from the venom of the Gila monster Heloderma suspectum. Glucagon-like peptide-1 is an incretin, which is intestinal hormone that enhances glucose-induced insulin secretion after meals. Glucagon-like peptide-1 is metabolized extremely rapidly in the circulation by the enzyme dipeptidyl peptidase-IV (DPP-IV), but excendin-4, a glucagon-like peptide-1 (GLP-1) receptor agonist, is resistant to the DPP-IV. Exenatide, synthetic exendin-4, has recently received FDA approval in the US for the treatment of type 2 diabetes (Briones & Bajaj, 2006; Park, 2007) and improves glycemic control in patients with diabetes through acute mechanisms, such as glucose-dependent stimulation of insulin secretion, suppression of inappropriate glucagon secretion and slowing of gastric emptying, as well as chronic mechanisms that include enhancement of β-cell mass in rodent studies, and weight loss and inhibition of food intake in humans (Egan et al., 2002; Kolterman et al., 2002; Mahler & Adler, 1999). Although the incensement of insulin secretion, the effect of exenatide, was not shown by the intake of chlorella, exenatide and chlorella intake show similar effect of lowering glucagon concentration. This could support that the intake of chlorella is beneficial to improvement of type 2 diabetes by decreasing glucagon concentration.
Taken together, the intake of chlorella significantly reduced the insulin/glucagon ratio, the concentrations of fasting plasma glucagon and hepatic TG. Also, the concentrations of fasting blood glucose and plasma insulin, the level of HOMA-IR were slightly decreased by the intake of chlorella. Considering the results described above, the intake of chlorella might improve insulin resistance and enhance insulin sensitivity in type 2 diabetic GK rats.
The hypoglycemic effects of chlorella intake were also evaluated in normal Wistar rats. The fasting blood glucose and plasma insulin concentrations of chlorella fed groups were tended to be lower than those of the chlorella non-fed group. Especially, the plasma insulin concentrations were slightly lowered in accordance with chlorella doses. The HOMA-IR was also decreased by chlorella intake in a dose-dependent manner. However, the plasma glucagon concentration of the 5% chlorella fed group was significantly higher than those of the other groups, and the insulin/glucagon ratio was significantly lower compared to other groups.
Insulin and glucagon are the key regulatory hormones for glucose homeostasis. The absolute concentrations and, even more so, the ratios of these two hormones are tightly regulated depending on nutritional status (Fanelli et al., 2006; Smith et al., 2005). Chlorella is expected to promote the action of counterregulatory hormones to rise in circulating glucose concentration, such as catecholamine, glucagon and adrenocorticotropic hormone in the fasting state. This is supported by the results that increased glucagon concentration of the 5% chlorella fed Wistar group to maintain blood glucose concentration in normal state, glycemic homeostasis. Because the glucagon concentration of the 5% chlorella fed group was significantly higher and the insulin/glucagon ratio was significantly lower among the normal groups, yet the blood glucose concentrations were not different in accordance with the intake of chlorella, it might be assumed that small amount of insulin was used efficiently by the intake of chlorella. In consistence with this assumption, the HOMA-IR was lower in chlorella fed groups.
In consequences, the intake of the 5% chlorella significantly increased the fasting glucagon concentration and insulin/glucagon ratio in normal Wistar rats. Also, the concentrations of fasting blood glucose and plasma insulin, the levels of the HOMA-IR of the 5% chlorella fed group were a little decreased. According to the above results, this study could suggest that the intake of chlorella could be beneficial to the improvement of insulin sensitivity in normal Wistar rats.
Considering the results of this study in type 2 diabetic GK and normal Wistar rats, these alterations by chlorella might perhaps be related to the potential hypoglycemic effects. However, it is difficult to make sure that chlorella has a hypoglycemic effect certainly because the results of this study were unclear. Moreover, there are only few studies performed to support the hypoglycemic effect of chlorella. Therefore, further studies are required to evaluate the effect with higher doses of chlorella to ensure that chlorella has hypoglycemic effects and to find that effective doses of chlorella are responsible for the positive effect on insulin sensitivity. In addition, some biomarkers, such as the plasma NEFA level and glucose uptake rate into the cell are also needed to examine the mechanism on how chlorella acts as a hypoglycemic agent. Finally, chlorella could be available as an anti-diabetic functional food when further studies identify the hypoglycemic effects of chlorella.


 XML Download