

 PDF
PDF ePub
ePub Citation
 Print
Print


Introduction
Food security is defined as "access by all people at all times to enough food for an active, healthy life" (World Bank, 1986). Access to food should also encompass acquisition of foods that is nutritionally adequate, safe and in socially acceptable ways (Life Science Research Office, 1990). At the household level, the definition of food security has also been extended to include related concepts of accessibility, sufficiency, security and sustainability (Gittelsohn et al., 1998; Maxwell & Frakenberger, 1992). There are several direct and indirect measurements of food security such as socioeconomic measures, food consumption, anthropometry and coping strategies, and a single indicator may not adequately capture the complexity of food security (Maxwell et al., 1999).
Food insecurity as a form of deprivation has been shown to affect many dimensions of well-being. Children from food insecure households are more likely to have poor growth attainment, recurrent infections, inadequate energy and nutrient intakes, compromised learning ability and psychosocial problems (Alaimo et al., 2001; Alaimo et al., 2002; Kaiser et al., 2002; Kleinman et al., 1998; Oh & Hong, 2003; Reid, 2000). Women experiencing food insecurity have lower micronutrient intakes and are at increased risk of overweight, obesity, disordered eating behaviors, depression and anxiety (Adams et al., 2003; Basiotis & Lino, 2001; Dixon et al., 2001; Kendall et al., 1996; Siefert et al., 2001; Tarasuk & Beaton, 1999; Whitaker et al., 2006). Older adults from food insufficient households have been reported to have low nutrient intakes (below 50% RDA) and functional impairments, even after controlling for socioeconomic variables (Lee & Frongillo, 2001; Rose & Oliveira, 1997).
Household food insecurity can be assessed using direct and indirect measurements. Food Sufficiency Status Question (Briefel et al., 1992), Community Childhood Hunger Identification Project Instrument (Wehler et al., 1994), Radimer/Cornell Hunger and Food Insecurity Instrument (Radimer et al., 1992) and Food Security Core Model (Bickel et al., 2000) and Cumulative Food Security Index (Maxwell, 1996) are among questionnaire-based instruments designed to directly measure core behaviors and experiences related to food sufficiency or food insecurity and to be administered to the person most responsible for food and food provision in the household. The indirect measurements of food insecurity which include income-based measures of poverty, utilization of food security-related program, indicators of financial hardship, anthropometric measurements, dietary intake and other health and nutrition parameters, indicate the level of vulnerability in which food insecurity may be reasonably inferred (Radimer et al., 1990; Office of Nutrition Policy and Promotion at Health Canada, 2002). In the developing countries, the indirect indicators are commonly used to gauge the prevalence and severity of food insecurity, however, the use of direct indicators are limited to several settings (Gonzalez et al., 2008; Guilliford et al., 2003; Lorenzana & Sanjur, 1999; Maxwell, 1996; Oh & Hong, 2003; Perez-Escamilla et al., 2004; Piaseu, 2006; ).
The Radimer/Cornell Hunger and Food Insecurity instrument identifies food insecurity experienced at the household, individual and child levels and maintains that food insecurity is a managed process (Radimer et al., 1990). The household makes necessary adjustments to address food insecurity with the children being spared until food insecurity becomes severe. In other words, the adults will endure hunger themselves so that their children do not suffer. While the Radimer/Cornell instrument has been used extensively in the United States, its application in a different cultural setting is relatively limited (Kaiser et al., 2002; Studdert et al., 2001; Welch et al., 1998). The Radimer/Cornell instrument has been shown to be applicable in Malaysia as a direct assessment of household food insecurity (Zalilah, 1998; Zalilah & Tham, 2002; Zalilah & Ang, 2002).
The purpose of this paper is to provide evidence of household food insecurity and to identify its indicators in a low-income rural community in Malaysia. Specifically, the paper will examine the associations between household food insecurity with demographic and socioeconomic factors and coping strategies to minimize food insecurity.
Subjects and Methods
Location
This study was carried out in the district of Sabak Bernam, located about 150 km north of the capital city of Kuala Lumpur. The district of Sabak Bernam is one of the districts in the state of Selangor and it was selected for its high percentage of hard core poor (households with income per capita below RM55) and poor (households with income per capita of RM55-RM110) households receiving welfare subsidy from the government. There are 12 villages and two oil palm plantations in Sabak Bernam, with the Malay ethnic group as the majority of the population. Based on population density, seven of the largest villages and both plantations were selected for the study. Altogether there were 840 households with about 80% (n=676) Malay and 20% (n=164) Indian households.
Subjects
Each household was screened for the presence of a husband-wife pair, a non-pregnant mother aged 20 years and above and her child in the age group of 1-6 years old. If the household had more than one child in this age group, the youngest one was selected for the study. Households with extended family members were also included in this study (n-29) with all households comprised only 2 families - the grandparents (one or both) as well as the parents and their children. A total of 290 Malay (n=213) and Indian (n=76) households were identified; however, as this study was part of a larger research on dual burden of malnutrition in the same households, a criterion was further applied for group categorization-1) Households with overweight (OW) mother (BMI > 25 kg/m2) / underweight (UW) child (WAZ < -1 SD) and 2) Households with normal weight (NW) mother (BMI 18.5 - 24.9 kg/m2) / normal weight (NW) child (WAZ -1 ≤ x ≤ 2 SD) (Khor & Zalilah, 2003). A total of 200 households (140 Malay and 60 Indian households) met this selection criterion. There was no significant design effect of mother-child criterion (OW mother/UW child and NW mother/NW child) and household food insecurity status (χ2=0.754; p=0.385) as well as ethnicity and food insecurity status (χ2=0.063; p=0.803) (Zalilah and Khor, 2005).
Data collection
Enumerators made house visits to collect pertinent research information through face-to-face interviews with the women. In situations where the women were not able to provide the required information (e.g. household economy), the spouses were interviewed to elicit responses.
1) Demographic and socioeconomic information
Detailed information on household composition, incomes, expenditures, basic amenities, asset ownership, financial and material aids received from government or non-government agencies were obtained from mothers. However, in cases where the mothers were not able to report on certain items (e.g. incomes, expenditures and assets), the fathers were interviewed. The respondents were also asked four questions related to the stability of their household incomes over the past months and years. This information was obtained to determine whether the food insecurity experienced by the households was transient or permanent. Rose (1999) indicated that recent economic downturn or emergencies (retrenchment, birth of a child, drop in market price for palm oil etc.) experienced by the households may affect household income stability and consequently contribute to the households being food insecure. For father's employment status, the own account worker refers to jobs in which the person is working on his or her own without being employed by anyone. These jobs include working on one's own land (e.g. palm or rubber plantation, poultry or cattle rearing), operating small businesses (e.g. running a sundry shop, a food stall or a car workshop) or doing small contractor jobs (e.g. repairing roofs and houses). Working mothers are defined as mothers who are wage earners regardless of being employed or self-employed (e.g. care for other children or operate food stalls).
2) Household food security
The Radimer/Cornell Hunger and Food Insecurity instrument was utilized whereby the ten items reflect four levels of food insecurity with increasing severity - food secure, household food insecure, individual or adult food insecure and child hunger. The ten items have been translated into Malay language and the translated version was used in previous studies with reported alpha Cronbach's in the range of 0.8-0.9 (Zalilah, 1998; Zalilah & Ang, 2002, Zalilah & Kathryn, 2002). The internal consistency of the instrument used in this study was 0.96.
During the interview, the enumerators went through the ten items with the mothers in the absence of other adults (husbands, parents or parent-in-laws) in order to avoid any discomfort for mothers. Based on our previous experiences in using this instrument (Zalilah, 1998; Zalilah & Ang, 2002, Zalilah & Kathryn, 2002), mothers were quite hesitant to answer the questions if other adults in the households were present.
Coping strategies
The items on coping strategies to household food insecurity were first developed based on focus group discussions followed by interviews with respectively 53 and 309 mothers from low-income households in urban and rural areas in the same state (Selangor) as this study location during field work in 1998. The first phase (focus group discussions) involved the identification of various coping strategies adopted by mothers who are responsible for household food procurement and preparation. The identified coping strategies to deal with household food insecurity were categorized into two main groups - food coping strategies and income/expenditure coping strategies. In the second phase (interviews), mothers were asked to rank each item according to its perceived importance during times of income and food insufficiency. The degree of importance for each coping strategy was defined as more than 50% of the mothers answered positively to the item. These criterion further reduced the number of the items into nine (9) for each food and income/expenditure coping strategy. All the items in food and income/expenditure coping strategies were stated in the order of most to less important during times of income and food insufficiency.
Prior to this study, these items were pre-tested with 33 women from low-income households to assess the instrument's internal consistency. These women were from one (1) of the smaller villages in Sabak Bernam district which was not included in the study and were district welfare recipients. The alpha Cronbach's for food and income/expenditure coping strategies was 0.79 and 0.73, respectively. In this present sample (n=200), the alpha Cronbach's for food coping strategy was 0.84 and 0.91 for income/expenditure coping strategy.
The protocol in this study was approved by the Medical Research Ethic Committee of the Faculty of Medicine and Health Sciences at University Putra Malaysia. Permission to conduct the study was also obtained from the district office of Sabak Bernam and the head villages. Informed consents were sought from all respondents prior to data collection.
Data analysis
The first step in the statistical analysis was to compare the food secure and food insecure households on demographic, socioeconomic, expenditure and coping strategy variables. Households experiencing household and individual food insecurity as well as child hunger were categorized as food insecure households. Chi-square analysis and T-tests were utilized for comparison of categorical and continuous variables between the food secure and food insecure, respectively. The two categories, food secure and food insecure households, were also used in the logistic regression analysis.
In order to identify the variables that contribute to food insecurity, four logistic regression models were estimated using the various subsets of variables from the three main groups of variables (demographic and socioeconomic, expenditures and coping strategies) (Olson et al., 1997) - (i) demographic and socioeconomic variables alone (ii) demographic, socioeconomic and expenditure variables (iii) demographic, socioeconomic and coping strategy variables (iv) demographic, socioeconomic, expenditure and coping strategy variables. The inclusion of variables into the logistic models was based on the combination of variables that were significantly different between food secure and food insecure households and variables with unadjusted odds ratios significant at p<0.05. However, in the variable selection procedures, various adjustments were made - income per capita was not included in any of the model as the variable was operationalized as both household income and household size. In models which include expenditure variables, household income was excluded, total expenditure was operationalized as a proportion of total household income and food, child and loan expenditures were included as a proportion of total expenditures; for income stability, trends in household income were included in the models even though the variables were not risk factors for food insecurity or not significantly different between the two types of households. The results from the final logistic regression model are expressed as odds ratios with 95 percent confidence intervals (CI).
Results
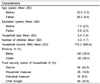
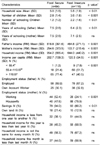
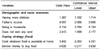
More than 50% of the households experienced some degree of food insecurity with 34.5% reporting child hunger (Table 1). On the demographic and socioeconomic characteristics, the food secure and insecure households differed significantly on most of the independent variables (Table 2). In general, the food insecure households were characterized by larger household size, more children and school-going children and mothers as housewives. Compared to the food secure households, more of the food insecure households were living below the poverty line (59.5%) with 7.8% categorized as hard-core poor households. Although the households did not differ significantly on perceptions of income stability, more of the food insecure households reported short and long term income instability. The common responses for income instability were fluctuations in prices for agricultural commodity items such as palm oil, coconut and rubber, bad weather which affects fish catch and difficulty to do odd jobs or secure secondary employment to supplement household income.
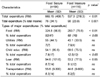
For both types of households, major expenditures were on foods, utilities, child education, loans and transportation, with food insecure households spending a higher proportion of their incomes (90%) compared to food secure households (76%) (Table 3). Many of the food insecure households had total expenditures which exceeded their monthly incomes. This was made possible as they would use their savings, borrow money from others or use a system in the communities whereby the villagers could take the food or non-food items from the grocery or sundry shops and pay at the end of the month or later.
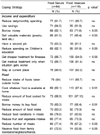
For early attempts to minimize household food insecurity, several coping strategies were found to be significantly different between the two types of households (Table 4). Firstly, more of the food secure households were able to adopt the strategies of selling valuable materials (81%) and borrowing money (82%) compared to 66% and 72% respectively among the food insecure households. The former with higher mean income have assets and properties that they can sell or mortgage during periods of economic hardship. Secondly, as food insecure households had more school-going children, reducing expenditures on children's education is an important coping strategy which includes requesting a school textbook loan, reducing children's pocket money and expenditures on school needs and activities.
On food strategies, borrowing money to buy food and receiving foods from family members, relatives and neighbors are ways to cushion the food secure households from experiencing food insufficiency (Table 4). Most of the food insecure households adopted the strategy on cooking whatever food is available at home, including the use of herbs, plant shoots (bamboo, cassava, banana) or vegetables grown by the households, poultry or other domesticated animals (rabbits, goats, cows) reared for own consumption or cash, and fishing from rivers, lakes and sea. In other words, these strategies do not require the food insecure households to use money to purchase food. The strategies on reducing amount of foods cooked for meals, amount of food intake, food variations in meals and consumption of fruits and vegetables did not differ significantly between the two households. However, reduction in the number of meals is adopted by more of the food secure households (77%) than the food insecure households (67%). Typically, breakfast or lunch is the meal excluded by these households.
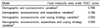
Logistic regression was performed between each independent variable and food insecurity status (data not shown). On demographic and socioeconomic variables, households with larger household size (OR=1.29, CI=1.09, 1.53) and number of children (OR=1.33, CI=1.11, 1.60) and school going children (OR=1.37, CI=1.10, 1.69), mothers as housewives (2.89, CI=1.58, 4.29) and with no savings (OR=3.91, CI=1.42, 10.76) or land ownership (OR=1.84, CI=1.12, 3.90) were more likely to be food insecure. Households with wage earning mothers (OR=0.998, CI=0.997, 0.999), fathers with higher years of schooling (OR=0.84, CI=0.74, 0.95) and higher per capita income (OR=0.993, CI=0.989, 0.996) were more food secure. Among expenditure variables, total expenditures as proportion of household income (OR=7.09, CI=2.08, 14.17) and percentage of food expenditure (OR=1.91, CI=1.11, 3.46) are higher for food insecure households. Mothers from food insecure households were also more likely to cook whatever was available at their homes for meals (OR=3.45, CI=1.42, 6.08) while strategies like borrowing money to buy food (OR=0.39, CI=0.20, 0.79), reducing number of meals (OR=0.996, CI=0.993, 0.999) and selling valuable materials (OR=0.46, CI=0.24, 0.90) contribute to household food security.
Table 5 shows the various models of food insecurity using the various subsets of variables from the three categories of demographic and socioeconomic, expenditure and coping strategy variables. The ROC (receiver operating characteristics) area represents the probability that the model correctly orders pairs of food secure and food insecure households. The area under the ROC curve is similar to R2 in the multiple regression model. The combination of demographic, socioeconomic and coping strategy variables yielded the area under the ROC curve as 0.85 and with all the three groups of variables combined, the value remained the same (0.85). Table 6 presents the combination of various subsets of demographic and socioeconomic and coping strategy variables as factors contributing to household food insecurity. Food insecure households were more likely to have more children (OR=1.37, CI=1.10, 1.71), non-working mothers (OR=5.15, CI=3.76, 9.15), did not own any land (OR=4.41, CI=1.60, 12.18) and adopted strategy of food preparation based on whatever was available at homes (OR=7.84, CI=2.25, 14.33). However, mothers who reported having to borrow money to purchase food (OR=0.63, CI=0.22, 0.84) and households having fathers with higher incomes (OR=0.997, CI=0.996, 0.998) were more likely to be food secure.
Discussion
In our studies on urban low-income households (Zalilah, 1998; Zalilah & Ang, 2001), the percentage of households reporting food insecurity was higher (66.6% and 65.7%) than that found in the present study of rural low-income households (58%). However, the number of urban low-income households experiencing child hunger (27.8% and 27.1%) was lower than that of the rural households (34.5%). There are two possible explanations for these differences. First, although the urban low-income households may have fixed incomes, the cost of living is higher and they were more likely to experience unexpected expenses (food and non-food items) due to sudden economic changes associated with urban living. For the rural households, although household incomes vary (e.g. hourly-wage, seasonality, weather-dependent), the relative lower cost of living and less non-food expenses in rural areas help to reduce the impact of income per se on household food security. For example, the average household spending in urban areas (RM1, 943) was higher than in rural areas (RM1, 270). In addition, an average urban household will spend more on gross rent, fuel and power at a value of RM 463 compared to a rural household at RM 246. However, the urban households tend to spend less on food (19% of household expenditure) compared to the rural households (29% of household expenditure) (Malaysian Dept. of Statistics, 2000). The anomaly of many low-income households appear to be food secure while many households above the poverty level show signs of food insecurity have been reported (Rose, 1999; Olson et al., 1997). It was further suggested that recent economic changes (which may stress household budgets) instead of income-based indicators should be considered in the analysis of food insecurity as the former may contribute to temporary bouts of food insecurity.
Second, the cultural perceptions of food sufficiency may differ between urban and rural households. A meal consisting of rice with eggs or anchovies may be sufficient to the rural households but not for the urban households, as these food items (eggs and anchovies) may be considered as side dishes only. Thus, given the same amount and types of foods, it is more likely for the urban low-income households to report food insecurity compared to the rural low-income. Although we substituted the term 'balanced meal' in the Radimer/Cornell instrument with 'a meal with rice, meat or fish and vegetables', the latter term may be subjected to diverse interpretations by the rural and urban households due to different cultural and social environments. Derrickson et al. (2001) reported that the term 'balanced meal' was defined by many as a meal consisting of at least three food groups that may depict the consumption of a variety of foods among but not necessarily within food groups.
In this sample of rural households, comparison of food secure and insecure households indicated that the latter had lower household income and income per capita (and more living below poverty line income), larger household size and higher number of children and school-going children. A study conducted in the slum areas of Bangkok found that households with inadequate income, higher number of children and lack social support from family were at greater risk of household food insecurity. These findings indicate the importance of empowering households both socially and economically during times of food adversity (Piaseu, 2006). Baer and Madrigal (1993), in their study of Mexican households, reported that even when household income was controlled, larger households were more food insufficient compared to smaller households. In our regression model, the number of children was a risk factor for food insecurity in that more children mean higher child expenditures which include general and education expenses. In an analysis of income and spending or poor households with children in the US (Lino, 1996), poor households with children spent nearly 70% of total expenditures on housing (shelter - rent, maintenance and repairs, mortgage interest, property tax and home insurance; and utilities - gas, electricity, fuel, telephone and water) and food compared with 42% for non-poor households. Similarly, in our findings, the food insecure households spend approximately 80-90% of total expenditures on housing (utilities and to some extent loan) and food compared to 60-70% among the food secure households.
It is recognized that in developing countries, women play an important role in achieving household food and nutrition security. They are involved in household food production, participate in economic activities so as to supplement household incomes and are responsible for the care of the household members (Quisumbing, 1996). In our study, more mothers in the food secure households were income-earners and being a housewife was a significant factor associated with household food insecurity. The combination of their working experience (socialization with other people) and ability to generate and control financial resources in the households may allow them to provide enough food for family members, manage income and food resources efficiently and be innovative in coping with household income or food insufficiency. Women with education and income-earning capability may have more autonomy in household decision making that could be translated to better health and nutrition of the women and their children (Fartahun et al., 2007; Hindin, 2006; Myntti, 1993; Pfeiffer et al., 2001).
Household wealth assets are important to lessen financial burden of households during events that stress household budgets. Home owners and households with savings have been reported to be less likely to experience food insecurity (Cristofar and Basiotis, 1992; Olson et al., 1997; Rose et al., 1995). In our study, land ownership has two valuable features - the land is utilized for agricultural or animal production activity or houses are built for rent, both of which are sources of income to the households. It is also noteworthy that 16% and 22% of the food secure and insecure households respectively own livestock. However, food secure households reared only poultry for their own consumption while food insecure households reared poultry and cattle mainly for cash. Land ownership per se may not be an important predictor of food security but its utilization may be protective against household food insecurity. In a study on socioeconomic profile and nutritional status of children aged 1-6 years in rubber smallholdings in Peninsular Malaysia (Zamaliah et al., 2002), acreage of land utilized is associated with child nutritional status. While per capita income was a predictor for height-for-age, acreage of land utilized significantly predicted weight-for-age and weight-for-height.
The use of strategies to cope with short-term and long-term changes in household income and food insufficiency as direct indicators has been documented in many earlier studies (De Garine, 1993; Eele, 1994; Frakenberger & Coyle, 1993; Watts & Bohle, 1993). Maxwell et al. (1999) indicated that in both rural and urban settings, four categories of coping strategies related to dietary change, food-seeking behaviors, household structure and rationing are commonly adopted by households experiencing food insufficiency; however the specific coping strategies within each category may vary across settings. Due to different environmental circumstances (e.g. cost of living, rural versus urban culture, education and employment status of women), the urban low-income households may utilize different specific coping mechanisms to deal with income and food insufficiency than rural households. Similarly, Davies (1996) has suggested that various aspects of coping behaviors (definition, sequence of importance or severity, short-term versus long-term changes) may differ between locations (e.g. urban versus rural) and within a location (fishing versus agricultural community in a rural area).
In this present study, we found that the rural low-income households used food-related coping mechanisms (cook whatever food is available at home and borrow money to buy food) during periods of food insecurity. Based on the Russian Longitudinal Monitoring (1994~2000), Dore et al. (2003) reported that the use of less expensive food and consumption of home-prepared meals were prevalent coping mechanisms among low-income Russian households to protect the dietary intakes of children. Decreased frequency and quantity of food intake, compromised diet in relation to food quality, food preference and food substitution, changes in food store, sale of assets and borrowing food or money were reported by families in Java during the Indonesia's economic crisis in 1998 (Studdert et al., 2001).
There are several advantages of using coping strategies to measure food insecurity such as the procedures are simple, low cost and comprehensible by many, can be used in combination with other measures of food insecurity and capture some elements of vulnerability and complexity related to food insecurity (Maxwell, 1996). Although we found that several food coping strategies were associated with food insecurity, the findings should be further investigated and confirmed as these strategies may be context or setting specific. Eventually, coping strategies as food security indicators should be validated against other indicators such as food consumption (household, individual), poverty measures (income and expenditure) and individual health and nutritional status.
In conclusion, it is recommended that cultural-context research be conducted to understand the various risk factors and coping strategies in relation to household income and food insufficiency (e.g. urban-rural and ethnic differences, female-headed versus male-headed households), nutritional and health outcomes associated with food insecurity and the role of women in household food security. Knowledge on such information will facilitate efforts to address household food insecurity effectively and efficiently.
 XML Download