

 PDF
PDF ePub
ePub Citation
 Print
Print


Introduction
Korea has experienced rapid socioeconomic growth with prominent lifestyle transformation over the past several decades, therefore overweight and obesity represent a rapidly growing health threat (Park et al., 2005). Also, high fat diet has been reported to adversely affect the health of humans and animal species (Ghosh et al., 2001; Steinberg, 1991; Storlien et al., 1996; Surwit et al., 1988). The prevalence of dyslipidemia resulting from excess energy intake and physical inactivity is increasing. Abnormal lipid metabolism is a main cause of dyslipidemia, which is a major risk factor for cardiovascular disease, obesity, cholestasis, and overall mortality (Rizvi et al., 2003).
In the present day, many people have made efforts to prevent and improve dyslipidemia. Dietary effort is one of the helpful solutions in preventing dyslipidemia. A lot of studies have evaluated effects of natural products safety confirmed to improve and prevent diseases. Representatively, chlorella is worthy of notice.
Chlorella has long been a popular functional food worldwide especially in Asian countries including Korea, Japan and Taiwan. It has few bio-availabilities and is acknowledged as good food (Cherng & Shih, 2005a). Chlorella containing a lot of chlorophyll (2,400 mg/100 g chlorella powder) is a type of unicellular green algae under 10 µm in diameter. It shows active photosynthesis and cell-division, with very fast proliferation rate, and survives well in hard environment. Chlorella is a good source of protein, lipid soluble vitamins, choline, dietary fiber and essential minerals. Chlorella especially contains approximately 60% protein, and the amino acid quantity and nutritional composition of chlorella are similar to those of egg, which is regarded as the perfect protein except methionine and tyrosine (Han et al., 2002; Kang et al., 2004). Many studies have been performed to figure out biochemical and physiological functions of chlorella, such as promoting the growth rate of animals, production of cytokine and boosting immune function (Konishi et al., 1996; Queiroz et al., 2002; Singh et al., 1998; Tanaka et al., 1998), ameliorating oxidative stress in mice and preventing stress induced ulcers (Lee et al., 2003; Tanaka et al., 1997), and preventing high fat diet induced dyslipidemia. The effects of chlorella, such as fatigue recovery, degradation of toxic materials, heavy metal removal, and environmental application were also studied (Cherng & Shih, 2005a; Cherng & Shih, 2005b; Han et al., 2002; Kang et al., 2004; Sano et al., 1988). Chlorella vulgaris, one strain of chlorella, has also been shown to influence rats' lipid contents in the liver and serum (Shibata et al., 2001). For cholesterol-fed rabbits, Chlorella vulgaris has anti-lipidemic and anti-atherosclerotic actions (Sano & Tanaka, 1987). In human studies, Okudo et al. (1975) showed that chlorella intake reduced cholesterol levels in patients with hypercholesterolemia. Thus, the aim of this study was to investigate the effects of Chlorella vulgaris powder on lipid metabolism in Wistar rats fed high fat diet. Body and fat pad weight; and total lipids, triglycerides and cholesterol levels in serum and liver, lipids excretions in fecal were measured.
Materials and Methods
Experimental diets
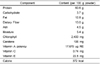
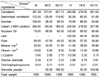
The Chlorella vulgaris sample used in this experiment was supplied by Daesang. Co. Ltd. (Korea) in powdered form of Chlorella vulgaris. The specification of the sample is shown in Table 1.
Animals and dietary treatment
Rats were purchased from Korea Jung-Ang Lab. Animal, Inc. (Seoul, Korea). Sixty six-week-old male Wistar rats (Slc:Wistar/ST, outbred, Institute of Medical Science origin) were used in this study and the rats were fed with commercial pellet diet (Samyang Co., Korea) for 1 week as acclimatization before the experiment. After 1 week of acclimatization, rats of weighing 273.73 ± 1.01 g were randomly divided into six groups (n=10) and were assigned to different dietary treatments. Experimental animals were fed with 6 experimental diets, with two levels of fat and three levels of chlorella. The compositions of experimental diets are shown in Table 2. The diets were formulated according to the nutrient content of the American institute of nutrition (AIN)-93G diet (Reeves et al., 1993), with slight modifications. Chlorella was supplied by replacing 0%, 5%, 10% (w/w) from all nutrients proportionally. They were fed normal diet containing 7% (w/w) soybean oil (N group), normal diet plus 5% and 10% (w/w) chlorella powder (NC5 and NC10 group), high fat diet containing 10% (w/w) lard plus 10% (w/w) soybean oil (H group), and high fat diet plus 5% and 10% (w/w) chlorella powder (HC5 and HC10 group) for 9 weeks, respectively. Food intake was measured three times per week and body weight gain was measured weekly.
Rats were housed one per cage under controlled temperature (22-24℃) and relative humidity (45 ± 5%) with a 12-hour light/dark cycle and allowed free access to water and diets assigned to individual feeding groups (Chau & Huang, 2005; Lee et al., 2005).
Sampling (blood, organ and adipose tissue)
Rats were put in cages for 24 hours to collect feces during the last three days of the feeding period. Feces were collected and weighed daily, followed by lyophilization. The dried fecal samples were weighed, ground, and stored at -80℃ until analyzed (Chau & Huang, 2005; Lee et al., 2005). At the end of the experiment, rats were deprived of food for 12 hours and then anesthetized using diethyl ether. A central longitudinal incision was made into the abdominal wall and blood samples were collected by cardiac puncture with syringes. Blood samples were centrifuged at 2,800 rpm for 30 minutes at 4℃ and the plasma was separated and stored at -20℃ until analyzed. Liver, kidney and spleen samples were excised, immediately frozen in liquid nitrogen and stored at -80℃ until analyzed. The adipose tissues (perirenal, epididymal) and brown adipose tissue were dissected, rinsed with saline, and weighed. Care and treatment of experimental animals were in accordance with the guide for the care and use of laboratory animals of Ewha Womans University.
Biochemical analysis
Serum lipid analysis
The serum total lipid level was measured by the method of Frings and Dunn (1970). Triglycerides (TG), total cholesterol and HDL-cholesterol levels were determined by enzymatic colorimetric methods using commercial kits (Asan Pharmaceutical, Korea). Serum aspartate aminotransferase (AST) and alanine aminotransferase (ALT) activities were measured using a kit (Asan Pharmaceutical, Korea) based on the Reitman- Frankel method (Reitman & Frankel, 1957). Serum total protein concentration was measured using a kit (Asan Pharmaceutical, Korea) based on Biuret reaction (Layne, 1957).
Liver analysis
Total lipid level in liver was extracted by the method of Bligh and Dyer (1959). Triglycerides and total cholesterol levels in liver were determined by enzymatic colorimetric methods using commercial kits (Asan pharmaceutical, Korea).
Statistical analysis
All experiments were performed in duplicate. All statistical analyses were performed by the SAS program package version 9.1. Data were expressed as mean ± standard error (S.E). The data were analyzed by the one-way analysis of variance (ANOVA) and mean differences among experimental groups were evaluated using Duncan's multiple range tests at the p<0.05 significance level. Two way ANOVA was also used to analyze main effects (A: dietary fat level, B: chlorella powder level) and interaction (AB: the interaction between dietary fat and chlorella level).
Results
Body weights and energy intake
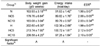
Body weight gain and energy intake are shown in Table 3. In normal diet groups, rats treated with 5% (NC5) and 10% (NC10) chlorella had significantly higher body weight gain than rats treated with normal diet (N). Energy intake and energy efficiency ratio (EER) of rats did not differ among the normal diet and high fat diet groups, in spite of chlorella supplementation. But energy intake was slightly decreased in 10% (NC10, HC10 group) chlorella intake group. Calorie intake and body weight were significantly influenced by dietary fat level. These indexes were not affected by the chlorella level.
Organ and tissue weights
Organ (liver, kidney and spleen) and tissue (epididymal, perirenal and brown fat pad) weights per 100 g body weight are shown in Table 4. Liver weight was significantly higher in the N group than in the NC5 and NC10 groups, and the H group was also significantly higher than the HC5 and HC10 groups (p<0.05). Kidney weight was significantly affected by dietary fat level. The chlorella level did not affect the kidney and spleen weights. But liver weight was significantly affected by dietary chlorella level. Epididymal and perirenal fat pad weights tended to be lower in chlorella intake groups, though not significantly. Brown fat fad weight was significantly lower in the HC10 group compared with the H group (p<0.05). Epididymal fat pad weight was significantly affected by dietary fat level, and brown fat fad weight was significantly affected by dietary chlorella level.
Serum aspartate aminotransferase (AST) and alanine aminotransferase (ALT) activities
Serum aspartate aminotransferase (AST) and alanine aminotransferase (ALT) activities are shown in Table 5. AST can be generally found in the liver, cardiac muscle, kidneys, brain, pancreas, lungs, leukocytes and erythrocytes, whereas, ALT is present in highest concentration in liver (Kupeli et al., 2006). Effects of chlorella on the serum AST and ALT activities were measured. Serum AST and ALT activities were not different in the normal diet groups, and so were in high fat diet groups.
Serum total protein and albumin concentrations
Serum total protein and albumin concentrations are shown in Table 5. In this study, the ranges of serum total protein and albumin were 7.11~7.80 g/dL and 3.23~3.75 g/dL, respectively. These concentrations are within the reference ranges of 6.3~8.6 g/dL for serum total protein concentration and 3.3~4.9 g/dL for serum albumin concentrations in Wistar rats (The Koreas Society of Food Science and Nutrition, 2000).
Serum lipids concentrations
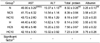
Serum total lipid, triglyceride, total cholesterol and HDL-cholesterol concentrations, and HDL-cholesterol/total-cholesterol ratio are shown in Table 6. Serum total lipids concentration was significantly lower in the HC5 and HC10 groups compared with the H group (p<0.05). Serum triglyceride and total cholesterol concentrations were significantly lower in the HC10 group compared with the H group (p<0.05). HDL-cholesterol concentration and HDL-cholesterol/total-cholesterol ratio tended to be higher in chlorella intake groups, though not significantly. Serum total lipid concentrations were significantly influenced by dietary fat and chlorella level. Serum triglyceride concentration was significantly affected by chlorella level, but not affected by dietary fat level.
Liver lipids concentrations
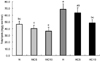
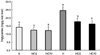
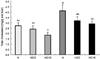
In high fat diet groups, liver total lipids and total cholesterol concentrations were significantly decreased by 71% and 70%, respectively, in 10% chlorella diet compared to the high fat diet group. Rats treated with 5% and 10% chlorella had significantly lower liver triglyceride concentration by 72% and 66%, respectively, than that of rats fed high fat diet. While the liver total lipids, triglyceride and total cholesterol concentrations were not significantly affected in normal diet groups, in spite of chlorella intake (Fig. 1, Fig. 2, Fig. 3).
Fecal lipids excretions
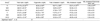
The effect of chlorella on the feces weight, fecal total lipids, triglyceride and total cholesterol excretions are shown in Table 7. Feces wet weight was significantly higher in the NC10 group compared with the N group. Feces dry weight was significantly higher in the NC5 and NC10 groups compared with the N group, and the H group had significantly lower feces dry weight than the HC10 group. Fecal total lipid, triglyceride and total cholesterol excretions were significantly higher in the NC5 and NC10 groups compared with the N group, and the HC5 and HC10 groups were also significantly higher than the H group. Feces wet and dry weights were significantly affected by dietary chlorella level, but not affected by dietary fat level. Fecal total lipid excretion was significantly affected by dietary chlorella level, and fecal excretions of triglyceride and total cholesterol were significantly affected by dietary fat and chlorella levels. In addition, fecal excretions of total cholesterol were affected by the interaction between dietary fat and chlorella levels.
Discussion
Chlorella vulgaris has been shown to influence the lipid contents in the liver and serum of rats. However, the effect of Chlorella vulgaris on blood lipids profile in normal Wistar rats fed high fat diet has yet been known. High proportion of daily energy derived from fat component is a common situation in the current lifestyle of most societies in the world. High prevalence of vascular diseases and other chronic diseases, e.g. hypertension, diabetes are likely related with abnormal blood lipid profiles that may be due to long term high fat intake. After 9 weeks of experimental period, this study showed the ameliorative effect of Chlorella vulgaris on serum lipid profiles, which were elevated fasting total lipids, triglyceride (TG) and total cholesterol concentrations, and decreased HDL-cholesterol concentration and HDL-cholesterol/total cholesterol ratio in high fat diet treated or chlorella non-fed groups.
In the study of Cherng and Shih (2005b), the effects of lowering blood lipids of Chlorella pyrenoidosa could be due to reduction in the absorption of fat in the intestinal tract. Also, administration of Chlorella pyrenoidosa provides the "beneficial effect" in hamster regarding to the decrease in total cholesterol/HDL ratio. Although the effect of Chlorella pyrenoidosa on HDL showed marginal increase in 7.2% CHFD (Chlorella pyrenoidosa contained high fat diet) grouped rats, the total cholesterol/HDL ratio was decreased significantly in all CHFD treated rats. Kay (1991) proposed that the possible active ingredients of chlorella in reducing blood lipid levels could be water-soluble fibers, vegetable protein, phospholipids, vitamin C, vitamin E and beta-carotene.
Dietary factors related to the possibility of the cholesterol and lipid lowering effects in the chlorella might be thought to be dietary fiber and protein. Lack of dietary fiber intake has been suggested as one of the major risk factors for cardiovascular disease, gastrointestinal disease, colon cancer and obesity, and high dietary fiber reduced the lipid levels in hypercholesterolemic hamsters (Chau & Huang, 2005). The hypolipidemic effect of dietary fiber might be due to the direct interference and alteration in fat and glucose absorption in the intestine (Mazur et al., 1990). Thus the hypolipidemic effect of chlorella might be related with 13.0 g of dietary fibers contained in 100 g chlorella powder.
Also, several studies have suggested that the hypocholesterolemic effect of vegetable protein, in particular soybean protein, is largely attributable to higher fecal steroid excretion as a consequence of the reduction in intestinal absorption (Huff & Carroll, 1980; Nagata et al., 1982). Iwami et al. (1986) reported that soybean isolate is inferior to casein in digestibility and suggested that the hydrophobic peptides of soybean protein that remain after digestion may bind well to bile acids and serve as a cholesterol lowering factor. Greater fecal steroid excretion may lead to increased bile acid production from cholesterol, thus reducing serum cholesterol concentration.
The liver total lipid, TG and total cholesterol concentrations in the 10% chlorella groups were significantly lower than those of the chlorella non-fed groups. Especially in high fat diet fed groups, the liver total lipids, TG and total cholesterol concentrations of the 10% chlorella group were markedly lower than those of the 0% chlorella group. Since insulin resistance is closely linked to hypertriglyceridemia, the lower HOMI-IR of the chlorella fed groups seems to be related with the significantly lower liver TG concentrations. Excessive glucose can be stored as glycogen in the liver and muscles or as TG by the lipogenesis pathway in adipose tissues (Cherng & Shih, 2006; Smith et al., 2005). When the lipolysis of adipose tissues is induced by insulin resistance, plasma non-esterified free fatty acids (NEFA) are increased, too, thus affecting the liver. The excessive plasma NEFA is stored as TG in the liver and used for gluconeogenesis to induce hyperglycemia (Boden et al., 1998), and that could inhibit insulin-stimulated glucose utilization in muscles (Roden et al., 1996). In contrast, the reduction of plasma NEFA concentration could improve glucose utilization (Reaven et al., 1988) and enhance the suppression of hepatic glucose production by insulin (Saloranta et al., 1991), and reduce the high insulin concentration in type 2 diabetes (Boden et al., 1998). Shibata et al. (2001) showed that chlorella administration increased the total amount of fecal neutral steroids excreted and subsequently lowered liver cholesterol contents. As the result, peripheral cholesterol may be transferred back to the liver in response to the reduction.
The feces wet weight and feces dry weight were influenced by chlorella intake in normal Wistar rats fed high fat diet. The results indicate that the consumption of chlorella could significantly increase the feces wet and dry weights up to 5% and 10%, respectively. The higher feces weights with chlorella fed groups versus chlorella non-fed groups might explain the feeding fibers, vegetable protein, vitamin E and beta-carotene in ingredients of chlorella. The present study showed that the 5% and 10% chlorella groups significantly elevated the levels of fecal total lipids, fecal TG and fecal total cholesterol when compared with the 0% chlorella groups in normal diet and high fat diet groups. These results demonstrate that the chlorella fed groups were more effective than chlorella non-fed groups in the excretion of total lipids, TG and total cholesterol via feces.
In conclusion, the intake of Chlorella vulgaris increased the total amount of feces excreted and the excretions of fecal lipids, and subsequently lowered liver and serum total lipids, TG and total cholesterol contents. Thus, these results suggest that Chlorella vulgaris is effective for prevention of dyslipidemia, which may be due to the modulation of lipid metabolism and increased fecal excretion of lipid.


 XML Download