

 PDF
PDF ePub
ePub Citation
 Print
Print


Introduction
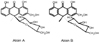
Aloe is widely used in food products, pharmaceuticals, and cosmetics due to its aromatic and therapeutic properties (Davis, 1994; Korkina, 2003). Aloe products have been used to alleviate inflammation and accelerate wound healing and its products ranked first in health food sales of 2005 (Park et al., 2005). Biologically active substrates in aloe include anthraquinone, anthrone derivatives, polysaccharides and chromones (Tom, 2004). Although aloe has been studied for its efficacy, the pharmacokinetic properties of its ingredients are largely unknown. Aloin is the major anthraquinone of aloe exudates and gels (Groon & Reynols, 1986) and it is characterized as the C-glycoside of aloe-emodin (Fig. 1.) (Reynold, 1985). Biological effects of aloin have been examined in a limited number of studies. Aloin increased the alcohol oxidation rate in rats (Chung et al., 1996), inhibited AOM-induced DNA adduct formation in rats (Shimpo et al., 2003), and had cytotoxicity against human breast cancer cell lines (Esmat et al., 2006). Even with these biological functions, the aloin content in aloe products is strictly regulated due to its possible adverse effects including laxative property (Koch, 1996) and cytotoxicity (Avila et al., 1997). Since these biological efficacies of aloin depend on its bioavailability, it is important to understand the absorption and tissue distribution of aloin as a basis for analyzing its benefits and risks. To produce data useful in interpreting many studies regarding in vitro efficacy and toxicity, we investigated the fate of oral aloin intake in rats.
Materials and Methods
Chemicals and reagents
Aloin, β-D-glucuronidase and sulfatase were purchased from Sigma-Aldrich Co. (St. Louis, MO, USA). All other chemicals and solvents (HPLC grade) were obtained from Waters Korea Co. (Seoul, KOREA). The standard stock solution of aloin was made in 70% methanol and stored at -80℃ until use.
Treatment of animals and blood sample collection
Male Sprague-Dawley rats were obtained at 7 weeks of age from Jung-Ang Lab Animal Inc. (Seoul, Korea) and maintained in air-conditioned quarters with 12-hr light/dark cycles. They were given a commercial rat food (Jung-Ang Lab Animal Inc., Seoul, Korea) and water ad libitum. The experiments started after the rats were given at least 1 week to adapt to their new diet and environment. A fresh dose of aloin solution was made with water and administered at dose of 11.8 g/kg. Blood samples were collected from the heart at 0.5, 1, 1.5, 3, 5, 8, 12, 24, 48, and 72 h after the aloin was administered, and placed in heparinized tubes. The blood samples were centrifuged at 2,000 × g for 10 min. The plasma was stored at -80℃ until it was used.
Tissue and urine sample collection
Rats were randomly divided into 11 groups (four rats per group), and given aloin gavage at a dose of 11.8 g/kg. To collect urine, rats were kept in metabolic cages. The animals were sacrificed at 0, 0.5, 1, 1.5, 3, 5, 8, 12, 24, 48, and 72 h after the aloin administration. Liver, kidney, and intestine (20 cm from the stomach) were removed and homogenized with 1 ml of 0.4 M sodium phosphate buffer containing 6 mg of ascorbic acid and 0.5 mg of Na2EDTA (final pH of 6.5). Tissue homogenates were centrifuged at 16,000 × g for 5min, and 200 µl of the supernatant was used to analyze aloin. The results were expressed on the basis of the weight of wet tissues (µg/g). Urine samples were collected before and at 0-24, 24-48, and 48-72 h after the aloin administration. The urine samples were stored at -80℃ until they were used.
Quantitation of aloin
The levels of aloin in rat plasma, tissues, and urine were determined by HPLC. The HPLC system consisted of a Waters 600 Controller, Waters 600 Pump, and Waters 486 Detector (Waters Korea Co., Seoul, Korea). The sample was incubated with β-D-glucuronidase and sulfatase at 37℃ for 45 min. The reaction mixture was then extracted with ethyl acetate, and the extract was dried under LN2. The residues were reconstituted in 200 µL of 50% methanol. After the resultant solution was centrifuged at 12,000 × g for 10 min, 15 µL of aliquots were injected into the HPLC column. A Symmetry C18, 4.6'250 mm, column was used with a mobile phase of methanol-water (50:50) at a flow rate of 0.9 ml/min and detection at 220 nm.
Results
Plasma concentration of aloin
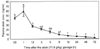
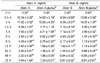
The plasma concentration-time curves of aloin and its glucuronides after the administration of aloin are shown in Fig. 2. The plasma samples obtained from rats were analyzed for the presence of both free and conjugated aloin. In rats receiving aloin (11.8 g/kg), plasma levels were detectable as early as 0.5 h, and peaked at 1 h followed by a subsequent decline. The plasma concentration at peak level was 59.07 ± 10.5 ng/ml. The plasma concentrations of both free and conjugates at different time points are given in Table 1. Fifty percent of total aloin in plasma was in the form of aloin glucuronide.
Tissue concentration of aloin
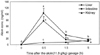
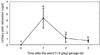
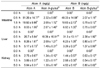
The tissue levels of aloin over time are shown in Fig. 3. The peak levels of aloin in liver and intestine were 77.15 ± 15.92 ng/g and 102.37 ± 14.12 ng/g, respectively, at 0.5 h (Table 2). The levels declined rapidly within 90 min. Aloin concentration in the kidney was maximized as 12.46 ± 0.81 ng/g at 5 h (Table 2).
Urinary concentration of aloin
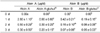
Urinary aloin and its conjugates were excreted within 72 h of the administration (Table 3). Most of the urinary aloin was excreted within 24 h. The cumulative amount of aloin excreted in the urine during the first 24 h was 0.03% of the administrated dose. The cumulative excretion of aloin A and aloin B within 24 h amounted to 2.8 ± 1.1 µg/day and 0.42 ± 0.21 µg/day, respectively. These values correspond to 64.97 and 9.7% of the administered doses, respectively.
Discussion
The aim of this study was to evaluate the absorption and urinary excretion of aloin to gain a better understanding of its bioavailability and tissue distribution as a basis to interpret in vitro studies, and to determine effective level of intake. To determine its in vivo bioavailability, we used 11.8 g/kg which was LOAEL of aloin (Zhou et al., 2003).
In this study, the level of aloin and their conjugates in plasma peaked at 1 h suggesting a rapid absorption of aloin in the gastrointestinal tract. At the peak plasma aloin level, conjugates of both aloin A and aloin B levels were higher compared to the levels of free aloin A and aloin B. The AUC0-24hr of aloin was determined as 270.81 ± 59.1 ng·h/ml and the half lives of aloin was 1.47 ± 0.24 hr. To maintain a high concentration in plasma, it requires a repeated ingestion of aloin every 1.5 h. The published studies in cell culture system used 50-2500 µM of aloin (Esmat et al., 2005; Wamer et al., 2003). However, the mean peak plasma level was 0.026 µM after the consumption of 11.8 g/kg. Thus this value could serve as a reference for designing and interpreting in vitro experiments for elucidating the mechanisms of action of aloin. Recently, several studies have shown that oral intake leads to anti-cancer (Shimpo et al., 2003) and anti-diabetic effects (Bolkent et al., 2004; Can et al., 2004). These are evidences to support either that the low aloin concentrations are adequate to induce biochemical changes, or that localized tissue aloin is metabolized to more active form(s).
Many in vitro studies have used high concentrations of aloin to test their efficacy presuming that most of aloin consumed would enter the circulation. However, a limited number of studies have been conducted for intestinal metabolism of anthraquinones. Our preliminary in vitro experiment using Caco-2 cell model showed that the absorption rate of aloin was about 6.6% which was similar to the absorption rate of other polyphenols (unpublished data). Due to the β-glycosidic linkage between the sugar and anthranoid structure, the glycoside form is protected against both hydrolysis by acid in the stomach and α-glucosidase activity in the small intestine (Wolffram et al., 2002). Results showed that native aloin as well as glucuronate or sulfate conjugates was identified in the jejunum indicating that aloin is absorbed in the small intestine and subjected to the action of various conjugation enzymes present in the small intestine. There are very few data on intestinal metabolism of anthraquinone. Although the absorption mechanisms of anthraquinones as glycosides are not clear, glycosidic polyphenols are transported into enterocyte by intestinal glucose transporters (GLUTs and SGLT) (Olthof et al., 2000) and can be hydrolyzed by a cytosolic β-glucosidase (Day et al., 1998). Another pathway involves the lactase phloridzine hydrolase (LPH), on the outside of the brush border membrane of the small intestine that catalyzes extracellular hydrolysis of glucosides (Day et al., 2000). Both enzymes are probably involved although their relative contribution for various glucosides is not clear. Moreover, part of them are transported by efflux into the intestinal lumen by multidrug resistance-associated protein 2 (MRP2) (Walle et al., 1999). Both phase I and phase II detoxification enzymes are expressed in the enterocytes. Glycosidic polyphenols are converted to polar β-glucuronides by phase II UDP-glucuronyltransferase (UGTs) (Jäger et al., 1998). These indicated that the absorption and metabolism of glycosidic polyphenols is complex, and requires further investigation.
The liver receives aloin from the mesenteric vein. We analyzed the aloin levels in the liver at several sampling times (0.5, 1.5, and 5 h after aloin gavage). After a short period of time, aloin was detectable in the liver (Table 2). The presence of a high proportion of glucuronidated aloins in rat liver possibly suggests that a significant extent of metabolism occurs in the liver. Since we measured total aloin and not aloe-emodin, aloin may also be converted to aloe-emodin by liver enzymes. Aloe-emodin can be biotransformed to 2-hydroxyemodin in the liver by cytochrome P450 1A2 (Mueller et al., 1998). In pharmacokinetic-metabolic studies with aloe-emodin, 15% of the dose was excreted in urine and the rest in feces (Maity et al., 2001). In this study, glucuronic acid or sulfate conjugated forms of aloin were also detected in the kidney, although aloin presented as an unconjugated form in the majority of tissues (intestine, liver and kidney). These results indicate that aloin undergoes deconjugation process when it enters the tissue. In liver cells, β-glucuronidase is responsible for the metabolism of polyphenol glucuronides (O'Leary et al., 2003).
Native aloin as well as its glucuronidated or sulfated metabolites was present in urine and their excretion rate was relatively low as compared to the amount ingested. In this study, urinary recovery of aloin was 0.03% of the oral intake. This finding is in agreement with the results of several other investigations which found that excretion rate of polyphenols in urine were between 0.005-0.1% of the intake (Bub et al., 2001; Chen et al., 1997; Matsumoto et al., 2001). Excretion percentages of aloin A and aloin B in urine were 64.7 and 9.7% of total aloin, respectively, indicating that aloin B would be more effective form of aloin than aloin A in rats. In a study using tea cathechins, β-elimination half-lives of epigallocatechin-gallate (EGCG) was greatest followed by epigallocatechin (EGC) and then epicatechin (EC), and EGCG is known as a strong antioxidant, anti-inflammatory and anti-cancer agent in green tea (Kim et al., 2006; Landis-Piwowar et al., 2007; Rice-Evans et al., 1995). These studies indicate that larger proportion of compounds circulating is possibly associated with its biological activity in vivo. In other bioavailability studies of polyphenols, they often reached the peak plasma level at 1-2 h after oral administration and then were rapidly decreased (Chen et al., 1997; Chow et al., 2001). In agreement with these results, aloin is also rapidly taken up and then excreted. Consequently, the fast excretion of aloin is facilitated by the conjugation of the aglycon to sulfate and glucuronide groups like other polyphenols. These pharmacokinetic parameters are useful for selecting the dose and dose frequency of aloe consumption for human studies.
This study confirmed that aloin was absorbed in its unchanged glycated forms in vivo. Further work is required to characterize the aloin metabolites and asses their potential biological activity at practical plasma concentrations.
 XML Download