

 PDF
PDF ePub
ePub Citation
 Print
Print


Introduction
Physical health status can be estimated by various measures such as biochemical indicators and blood pressure, and are associated with several health related factors such as dietary behaviors and obesity. However, when individuals rated self-recognition of health condition, it is related with various other factors. While self-rated health has shown to be related with mortality (Idler & Angel, 1990), other factors such as age, gender, and socioeconomic factors (Ahn & Joung, 2006; Vaez & Laflamme, 2003) were also shown to affect self-recognition of health status. In a study of the 2001 Korean National Health and Nutrition Examination Survey, adults aged between 20-69 showed better self-rated health when they were younger, male and with higher education, higher income, better living condition, no metabolic syndrome and higher dietary variety (Ahn & Joung, 2006). In a study of Canadian adolescence, students' self rated physical health was related with financial situation, gender, child-parent relationship, school achievement, tobacco use, and self-esteem (Vingilis et al., 1998).
Body image refers the perception of one's physical appearance or exterior to look. Body image or body weight perception has shown to play an important role in weight control in college students (Wharton, 2008), and unnecessary weight control leads the students to improper food habits (Ryu & Yoon, 2000). College students are in the transition from adolescence to adult, and in physically and mentally active times of life. Developing proper eating habits and adequate nutritional status are important for people in this age group in order to have better health in the later stage of life. However, distorted perception of body image and weight tends to lead college students to improper diets and life styles.
Distorted perception of body image and weight further negatively influence on body image satisfaction, which may turn to be a psychological risk factor. When young people habitually had negative body image thinking, they dissatisfy their body image, which affected self-esteem and tendency of eating disturbance (Verplanken & Velsvik 2008). In addition, dissatisfaction of body image and/or weight was further related with the development of depression (Rierdan & Koff, 1997).
Food behaviors of college students have shown to be affected by various factors such as gender, health consciousness, body mass index, and life style (Cheong et al., 2007; Kim et al., 2007; Lee, 1999). In addition, individual's perceived health has shown to be related with age, gender, health-related life style, psychological factors in young people (Vaez & Laflamme, 2003; Vingilis et al., 1998). However, it is not fully known how the self perception of health is related with body image, and how the dietary habits are affected by self perception of health in young people, especially college students. Therefore, the purpose of the current study was to examine dietary behaviors, perception of body shape and body-weight satisfaction of college students, and their relation with self-rated health.
Subjects and Methods
Subjects
Subjects were selected by 285 college students, who attended at the general physical education course of university located in Seoul, Korea, during the months of December in 2006. Information about demographic status, self-rated health condition, anthropometric data including the height and weight, perception of body image, satisfaction of body weight, concern for body weight control, dietary behavior, nutritional knowledge, and health-related characteristics such as drinking and smoking status were collected by a self-reported questionnaire. Subjects were divided into three groups according to the answer for the self-rated health question.
Measures
1) General characteristics and anthropometric factors
Socio-demographic variables examined were age, gender, grade, major, experience of nutritional education, type of residence, and pocket money. The anthropometric data, including height and weight, were collected by a self-reported questionnaire. Body mass index (BMI) was calculated by using the individuals' heights and weights, and classified into four categories: underweight (BMI<18.5 kg/m2), normal weight (18.5-22.9 kg/m2), overweight (23-24.9 kg/m2), and obesity (over 25 kg/m2).
2) Health status and body image recognition
Health status was assessed by self-rated health. The participants were asked to rate their health on a three point scale with the following response alternatives: "healthy", "normal", and "unhealthy". Body image recognition was asked by three questions: "What do you think about your body shape?", "Are you satisfied with your body weight?", and "Are you concerned with body weight control?". The question for body image was assessed by a four point scale (slim, moderate, fatty, and very fatty) and others were detected by a five point scale.
3) Health related characteristics
Health related characteristics were investigated by smoking and drinking status, sleep condition, dietary behavior, and nutritional knowledge. Smoking status was divided into two categories on smoker and non-smoker. The number of cigarettes smoked per day was investigated. Drinking status was also divided into two groups (drinker and non-drinker) and frequency of drinking of drinker was assessed. Sleeping time was investigated by a five point scale (1=less 4 hours a day, 2=4-6 hours a day, 3=7-8 hours a day, 4=9-10 hours a day, and 5=over 11 hours a day).
Dietary behavior was measured by modified the method of Kim and Kim (2005), which was comprised of 10 items; regularity of meal time, eating in moderation, frequency of protein food (meats, fish, egg and beans) about two meals a day, vegetable, using plant oil, dairy product, fruits and fruit juice, and seaweed, eating meal slowly, and regularity of breakfast. Nutritional knowledge was assessed by using the modified questionnaire of Kim et al. (2002), comprised of 20 items. Each item was granted one point when the answer was right, but zero point when the answer was false or no answer.
Statistical analysis
Statistical programs available in SAS program (version 8.01, SAS Inc, Cary, NC) were utilized for data analysis. Means and standard deviation values for the continuous variables are calculated while differences among the self-rated health status groups were assessed using one-way analysis of variance and Duncan's Multiple Range test. The frequencies and cross-tabulations were determined by X2-test, and a significance test on all results was conducted at level of p<0.05 unless otherwise stated.
Results
General characteristics and anthropometric factors
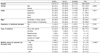
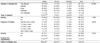
Subjects were 285 college students aged between 18 and 28 years, of whom 75.8% (n=216) were men and 24.2% (n=69) were women. The general characteristics variables with each of the self-reported health subscales are shown in Table 1. The numbers of subjects in each of health status group were 119 persons (41.7%) in healthy group, 129 persons (45.3%) in normal group, and 37 persons (13.0%) in unhealthy group. The proportion of men and women was not significantly different among the groups, however the proportion of men (n=97, 44.4%) who answered their self-rated health was "healthy" was higher than that of women (n=23, 33.3%). On the other hand, the proportion of men (n=24, 11.1%) who answered their self-rated health was "unhealthy" was lower than that of women (n=13, 18.8%). In case of the academic years, the percentage of subjects whose perceived health were "healthy" was lower and the percentage of subjects whose perceived health were "unhealthy" was showed a tendency to be higher in senior than in other academic years, but there was no significance. There were no significant associations between major, experience of nutritional education or type of residence and self perception of health status, but the pocket money range was significantly associated with self-rated health status. The proportion of subjects rated their health as unhealthy was the lowest in 210-300 thousand won pocket money range and was increased in less 210 thousand won or over 300 thousand won pocket money ranges, while the proportion of subjects rated their health as healthy was the highest in less 100 thousand won and was the lowest in over 410 thousand won pocket money range (Table 1).
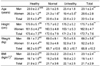
The average age was 22.5 years old in the healthy group (men; 23.0 years old, women; 20.3 years old), 22.6 years old in the normal group (men; 23.1 years old, women; 21.3 years old), and 22.6 years old in the unhealthy group (men; 23.4 years old, women; 19.4 years old). There was no significantly difference for age among the three groups, but in case of women, the mean age of normal group was higher than that of the unhealthy group. The average of height, weight, and BMI were 173.4 cm (men; 175.9 cm, women; 161.5 cm), 66.2 kg (men; 69.1 kg, women; 51.4 kg), and 21.9 kg/m2 (men; 22.3 kg/m2, women; 19.7 kg/m2) in the healthy group, 172.6 cm (men; 175.7 cm, women; 163.5 cm), 65.7 kg (men; 69.0 kg, women; 52.3 kg), and 21.7 kg/m2 (men; 22.3 kg/m2, women; 18.2 kg/m2) in the normal group, and 171.2 cm (men; 175.2 cm, women; 163.1 cm), 65.3 kg (men; 70.5 kg, women; 52.9 kg), and 22.1 kg/m2 (men; 23.0 kg/m2, women; 19.8 kg/m2) in the unhealthy group. There were no significant differences for height, weight and BMI in each of the three group (Table 2).
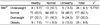
According to the result of comparison between BMI categories and self-rated health, the proportion of normal BMI in healthy subjects was higher than that in unhealthy subjects. In addition, the proportions of underweight, overweight and obesity in the healthy group were lower than those in the unhealthy group, but there was no significant association between BMI and self perception of health status (Table 3). It seems a tendency that the person who was to normal BMI range has better self-rated health status.
Body image recognition
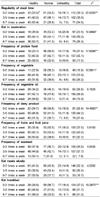
In case of self-perception of body image, the proportions of subjects reporting "slim" and "moderate" in the healthy group were higher than those in the unhealthy group, and the proportions of subjects reporting "fatty" and "very fatty" in the healthy group were lower than those in the unhealthy group (p<0.01)(Table 4).
The body weight satisfaction level of the healthy group was significantly higher than that of the unhealthy group (p<0.001), but the level of concern for body weight control in healthy subjects was significantly lower than that in unhealthy subjects (p<0.05). The proportions of subjects answered "very satisfied", "satisfied", and "normal" to the question about body weight satisfaction were higher in the healthy group as compared to the unhealthy group, but the proportions of subjects answered "dissatisfied" and "very dissatisfied" were lower in the healthy group than the unhealthy group. The proportions of subjects responded "very concerned" to the question about the interest in body weight control were lower in the healthy group than the unhealthy group, but the proportions of subjects answered "concerned", "normal", "unconcerned", and "very unconcerned" to that question in the healthy group were higher than those in the unhealthy group (Table 4).
Health related habits
The health related habits of subjects are shown in Table 5. According to the result of the adequacy of sleeping time, the percentages of persons replied "very adequate" and "adequate" in healthy subjects were significantly higher than those in unhealthy subjects, but the proportions of persons replied "normal", "inadequate", and "very inadequate" in healthy subjects were lower than those in unhealthy subjects. However, the mean of sleeping time was not significantly different in each group.
There were no significant differences for the percentages of smoker and drinker, the number of cigarettes per day, and frequency of drinking among three self-rated health status groups. But, the proportion of drinker and smoker and the frequency of drinking in healthy group showed tend to be lower than those in unhealthy group. The sum score of nutritional knowledge in unhealthy group was the highest and significantly higher than that in normal group (p<0.05) (healthy 15.8, normal 15.5, and unhealthy 16.9). Of the 20 questions regarding nutritional knowledge, the ratios of right for "Without having oil in your diet, you could be healthy" and "A meal comprised of Bibimbab and milk supplies more balanced nutrition than a meal which is composed of Gomtang and rice" were significantly higher in unhealthy group than in normal group, but there were not significantly difference between unhealthy and healthy groups. It seems that the person who has worse self-rated health condition has more concern about health, such as function of nutrients and food choice for health, than the person who perceived normal health condition.
Dietary behaviors
Table 6 shows the dietary behaviors of subjects according to self-rated health. Of the 10 questions regarding dietary behaviors, the frequency of regularity of meal time, eating in moderation, and eating breakfast was significantly increased, respectively, with an increased proportion of subjects whose perceived health were "healthy." Frequency of weekly use of protein foods (including meats, fish, egg and beans in two meals a day) (p<0.01), vegetables (p<0.05) or dairy foods (p<0.01) was also significantly increased as the proportion of individuals who rated themselves as healthy was increased. In addition, a similar trend was observed in food habit such as "eating slowly" and weekly use of plant oil, fruit and fruit juice and seaweed, respectively.
Discussion
This study examined the perception of body image, body weight satisfaction and dietary behaviors of college students, and their relations with self-rated health. Self-rated health status of students was found to be related with age, gender, income, family structure, school achievement, and self-esteem (Vingilis et al., 1998). In this study, there were no significant differences for age and the proportion of men and women among self-rated health status groups. However the proportion of men rated their health as healthy was slightly higher than that of women, while the proportion of men rated their health as unhealthy was lower than that of women. Vingilis et al. (1998) reported that the physical health was not rated differently by gender but showed gender differences in favor of male reporting higher levels of psychological health. In case of the academic years, the percentage of subjects rated their health as unhealthy showed a tendency to be higher in senior than in other academic years, but that was not significant different. The study of Mechanic and Hansell (1987) for adolescents reported that there was no grade difference on self-rated health and another study reported that age or grade would be assumed no or minimal difference in self-rated health (Vingilis et al., 1998). In addition, there were no significant associations between major, experience of nutritional education, or type of residence and self perception of health status; however, the pocket money range was significantly associated with self-rated health status. Ahn and Joung (2006) also reported that higher income was related with a better self-rated health in Korean adults. The financial situation was shown to affect on personal health status, self-esteem, school achievement, and health compromising life-style behaviors. It was suggested that the financial situation might have both direct and indirect effects on perceptions of both physical and psychological health status (Vingilis et al., 1998).
In this study, there were no significant differences for height, weight and BMI in each of three groups. Although the result of BMI categories was not also significantly associated with self-rated health status, the proportion of normal BMI in healthy subjects was higher than that in unhealthy subjects. It is assumed that the individuals with normal BMI might perceive themselves as healthy.
According to the result of body image recognition, the proportions of subjects answered "slim" and "moderate" to the question of body image perception and the body weight satisfaction level was significantly higher in healthy subjects than those in unhealthy subjects. A study with college students (Kim et al., 2002) also showed similar results that self-perception of health had significantly positive correlation with the satisfaction of body weight and body image. Kim et al. (2005) reported that college students showed better self-rated health when they were lower body fat percentage and higher body weight satisfaction. Body image or body weight perception was negatively associated with weight control in college students (Wharton, 2008), and unnecessary weight control leads the students to improper food habits (Ryu & Yoon, 2000). In this study, it was showed that the level of concern for body weight control was significantly lower in healthy subjects than unhealthy subjects.
As the result of dietary behaviors, subjects showed better self-rated health when they had better dietary behaviors such as higher frequencies of regularity of meal time, eating in moderation, protein food (meats, fish, egg, and beans) in two meals a day, vegetable, dairy product and regularity of breakfast. Kim (2006) reported that the level of health perception was increased by better dietary behaviors, and Lee (1999) also reported that the frequency of breakfast and the level of meal time regularity and eating in moderation were higher in the group with a high health consciousness than the groups with middle and low health consciousness.
In this study, there were no significant differences for smoking and drinking status in students with three different self-rated health but the proportion of drinkers and smokers and the frequency of drinking in healthy group tended to be lower than those in unhealthy group. Lee (1999) reported that there were no significant differences for smoking and drinking status among the health consciousness groups. The sum of nutritional knowledge score in the unhealthy group was significantly higher than that in the normal group, but there was no difference between the unhealthy and healthy groups. In a study by Kim (2006), it was reported that the nutritional knowledge score was not correlated with the health perception level. Of the 20 questions regarding nutritional knowledge, the ratios of right for two questions related to food choice and health were significantly higher in unhealthy group than in normal group. It seems that the person who has worse self-rated health condition tended to have more concern about health and nutritional balance than the person with normal self-rated health condition.
Overall results were shown that the college students whose perceived health was healthy were to normal BMI range, had better body image perception and body weight satisfaction levels, health related habits, and dietary behaviors. Therefore, it was suggested that the nutritional educations about dietary behavior for health, health related life-style, and body image recognition for college students were needed to estimate their health condition properly and increase perceptive level of their health.
 XML Download