

 PDF
PDF ePub
ePub Citation
 Print
Print


INTRODUCTION
Type 2 diabetes mellitus (T2DM) is a growing epidemic worldwide [1]; the condition is also a significant risk factor for cardiovascular disease, stroke, chronic kidney failure, diabetic retinopathy, and other chronic complications [2]. Metabolic risk factors, such as blood glucose level, lipid level, or blood pressure level, should be managed effectively in patients with T2DM to prevent or delay diabetic complications and reduce diabetes-related mortality rates [34]. This self-management of metabolic risk factors has been emphasized as a crucial part of medical care [5]. However, T2DM patients with a longer duration of illness may experience an increased psychological burden or barriers related to self-management of their disease when compared to those with a shorter duration of illness. For example, T2DM patients with a long duration of illness are more likely to experience depression, poor quality of life, and metabolic dysregulation and have a higher risk of morbidity and mortality [67891011]. Previous studies have also shown that these patients tend to have poorer self-management of glucose levels, blood pressure, and lipid profiles [121314]. Thus, it is crucial to identify strategies to overcome these barriers in T2DM patients with long disease duration.
Limited information is available on the recent trends of the capacity for the self-management of diet and metabolic risk factors in Korean patients with T2DM; in particular, few studies have assessed T2DM self-management by duration of illness. Most prior studies are limited to reporting statistics without adequately controlling for multiple potential confounding factors [8101115].
The aim of this study is to compare the self-management levels of diet and metabolic health biomarkers, including blood glucose, blood pressure, and blood lipid levels, in patients with T2DM according to their duration of illness, and to examine the secular trends of these patients' self-management abilities in the past 16 years, using nationally representative Korean survey data.
SUBJECTS AND METHODS
Study population
The Korea National Health and Nutrition Examination Surveys (KNHANES) is an ongoing national representative cross-sectional survey based on a complex multistage sampling design in South Korea. A detailed description of the data collection procedures and survey design are described elsewhere [16]. We used all available data from the KNHANES I (1998), II (2001), III (2005), IV (2007–2009), V (2010–2012), and VI (2013–2014) to examine how well patients with T2DM self-managed diet and metabolic risk factors. All participants signed an informed consent form, and the study was approved by the Institutional Review Board (IRB) of the Korea Centers for Disease Control and Prevention and provided formal ethics approval for the KNHANES data sets (IRB number: 2007-02-CON-04-P, 2008-04EXP-01-C, 2009-01CON-03-2C, 2010-02CON-21-C, 2011-02CON-06-C, 2012-01EXP-01-2C, 2013-07CON-03-4C, 2013-12EXP-03-5C).
In our analysis, patients with T2DM were selected based on information regarding the physician's diagnosis, hypoglycemic drug use, or administration of insulin injections. Of 51,692 KNHANES participants aged ≥ 30 years without missing sampling weight, we only included patients with T2DM, defined as aforementioned, and we excluded pregnant or lactating women (n = 550) and those with an implausible energy intake (< 500 kcal/day or > 5,000 kcal/day, n = 1,301) [17]. A total of 4,148 patients with T2DM were included in the final analysis (Fig. 1).
Demographic and lifestyle information
Information on demographic characteristics, lifestyle, and health (age, sex, household income, educational level, smoking status, alcohol consumption, physical activity, self-perceived stress levels, and diabetes care status) was collected through a self-reported questionnaire. Dietary therapy and nutrition education data were only available from the KNHANES II–VI and III–V, respectively. The education level was divided into two groups: those who did not graduate high school and those who graduated high school or higher. Smoking status was classified into current, ex-, and non-smoker. Adequate alcohol consumption was defined as drinking fewer than two glasses/day for men and one glass/day for women. Complete physical activity information (days and hours of active/moderate/walking physical activity) was available from 2008–2013 KNHANES data. Metabolic equivalents [METs (hours/week)] [18] were calculated, and participants were categorized into three groups: those with < 20 METs-hour/week, 20–39 METs-hour/week, and ≥ 40 METshour/week.
Anthropometry and dietary information
Anthropometric data and blood biomarkers were assessed during a health examination by trained medical staffs. Body weight and height were measured in light clothing with no shoes, and body mass index (BMI) was calculated as weight in kilograms divided by height squared in meters. Obesity and overweight were defined based on the World Health Organization's criteria for the Asian population, with BMI cutoff values for overweight and obesity of 23-< 25 kg/m2 and ≥ 25 kg/m2 respectively [19].
For the nutritional survey, a trained interviewer visited households and the participants were asked to recall every food item consumed at breakfast, lunch, and dinner during past 24 hours [20]. In addition, supplementary data, including mealtime and cooking conditions, were collected. The collected dietary information was coded and transformed to daily macronutrient and micronutrient intake values, which were derived from the food composition table by the Rural Development Administration [21]. In the analysis, consumption levels of vegetable and seaweed were calculated excluding kimchi and pickled vegetables. Food serving sizes were defined, on the basis of the Dietary Reference Intakes for Koreans [22].
Metabolic biomarkers
In the KNHANES I (1998) and II (2001), blood pressure was measured in the right arm twice after 10 minutes of rest in a sitting position using a mercury sphygmomanometer (Baumanometer® Desk Model 0320, WA Baum, New York, NY, USA), and the average of the 2 measurements was calculated. From the KNHANES III (2005) onwards, blood pressure measurements were performed 3 times on the right arm at 30-second intervals, and the average values of the second and third blood pressure measurements were used for blood pressure analysis. Among these data, blood pressure data from 2008 and 2009 were calibrated, controlling for measurement error due to different arm positions.
Fasting blood samples were sent to a certified laboratory to measure glucose, total cholesterol (TC), high-density lipoprotein cholesterol (HDL-C), low-density lipoprotein cholesterol (LDL-C), and triglyceride (TG) levels. Data from the KNHANES I (1998) and II (2001) were analyzed by the Korea Association of Health Promotions using the Hitachi 747 autoanalyzer (Hitachi, Tokyo, Japan), and data from 2005 to 2008 were analyzed using the ADIVIA 1650 (Tarrytown, USA) system at the Central Testing Institute (Seoul, Korea). After 2008, data were analyzed by the Neodin Medical Institute (Seoul, Korea) using the Hitachi Automatic Analyzer 7600 (Hitachi, Tokyo, Japan).
Assessment of adherence levels to dietary recommendations
Assessment of adherence level to dietary recommendations for T2DM patients was determined, on the basis of the Korean Diabetes Association-Korean Ministry of Health and Welfare (KDA-KMHW) index, mainly to evaluate the following 6 dietary components: moderate calorie consumption (recommended calorie intake for diabetes patients ± 10%), moderate carbohydrate consumption (50–60% of total energy intake), maintenance of regular meal pattern (eating at least three meals per day), sufficient vegetable/seaweed consumption [recommended consumption according to age and sex (women < 65 years, more than 8 servings per day; women older than 65 years, more than 6 servings per day; men, more than 8 servings per day)], limited sodium intake (sodium intake < 2,000 mg/day), and moderate alcohol consumption (women ≤ 1 cup per day; men ≤ 2 cups per day) [23]. Individuals were assigned a value of 1 if they adhered to each component or 0 if they did not.
Definition of metabolic disorders
Hyperglycemia was defined as fasting blood glucose level ≥ 126 mg/dL [24]. Hypertension was defined as a systolic blood pressure ≥ 140 mmHg, diastolic blood pressure of ≥ 90 mmHg, the use of antihypertensive drugs, or physician's diagnosis of hypertension [25]. Hyperlipidemia was defined as having levels of TC ≥ 240 mg/dL, HDL-C < 40 mg/dL, LDL-C ≥ 160 mg/dL, TG ≥ 200 mg/dL, the use of lipid-lowering drugs, or physician's diagnosis of hyperlipidemia [26].
Statistical analysis
Considering its distribution and prior publication [27], duration of diabetes was considered in 5-year strata, allocating the participants into three groups: < 5 years, 5–9 years, and ≥ 10 years from the time of diagnosis. The survey sampling methods of the KNHANES (multistate, stratified, and clustered sampling) were considered in all statistical analyses. In the multivariable logistic regression models, odds ratios (OR) and 95% confidence intervals (CI) were calculated for the association between the duration of illness and the prevalence of hyperglycemia, hypertension, and dyslipidemia. Potential confounding factors and effect modification were considered and examined through literature review [78910112829] and descriptive statistical analysis approaches. Using SAS PROC SURVEYREG (version 9.4, SAS Institute Inc., Cary, NC, USA), multivariable generalized linear regression analysis was conducted to estimate means and standard errors (SE) of the prevalent hyperglycemia for the three different groups of illness duration for each survey. The P for trend was calculated using the median value for the prevalent hyperglycemia for each survey round between the KNHANES I (1998) and VI (2014). All analyses were performed using SAS, and the critical value for P was set at α = 0.05 in two-tailed tests.
RESULTS
Demographic and lifestyle characteristics according to duration of diabetes
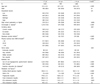
Table 1 compares the general characteristics of the 4,148 patients with T2DM according to their duration of illness. More than half of the patients had a T2DM diagnosis made at least 5 years prior. Patients with a longer duration of illness had a significantly higher mean age than those with a shorter duration of illness (61.5, 63.7, 66.4 years for a T2DM duration of <5 years, 5–9 years, and ≥ 10 years, respectively; P < 0.001). Moreover, the proportions of patients with overweight or obesity (P < 0.001) and proportions of those who graduated high school or higher (P = 0.006) tended to be lower in patients with a longer duration of illness than in those with a shorter duration of illness. The proportions of patients with moderate alcohol consumption (P < 0.001) and those undergoing oral hypoglycemic agents and insulin injection (P < 0.001) and dietary therapies (P < 0.001) were higher among patients with a longer duration of illness than among those with a shorter duration of illness.
Adherence levels to dietary recommendations for T2DM patients by duration of illness
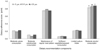
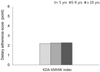
Fig. 2 depicted adjusted mean levels of adherence to the 6 components of the KDA-KMHW index among T2DM patients by duration of illness, controlling for age, sex, BMI, educational level, smoking status, and use of oral hypoglycemic agents and insulin injection. We did not observe any significant differences in adherence levels to recommended dietary recommendations according to duration of illness, except adherence to moderate alcohol consumption. Adherence to sufficient vegetable/seaweed consumption and moderate carbohydrate consumption were the poorest, showing 0.06–0.07 points and 0.07–0.11 points, respectively. The guidelines with the greatest adherence ratings were moderate alcohol consumption (0.84–0.88 points) and maintenance of regular meal pattern (0.75–0.79 points). The adjusted average levels of the KDA-KMHW index, indicating overall adherence level to 6 dietary recommendations, were compared according to the duration of illness in Fig. 3. There was no difference in adherence levels of the KDA-KMHW index between groups.
Association between duration of diabetes and prevalent metabolic abnormalities
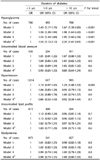
Table 2 shows the ORs for hyperglycemia, hypertension, and dyslipidemia according to disease duration. In both minimally and fully-adjusted models, we observed a higher prevalence of hyperglycemia (P for trend < 0.001) in individuals with a longer duration of illness. When compared to patients with a T2DM duration of < 5 years, those with a disease duration of ≥ 10 years had higher prevlence of hyperglycemia (OR = 2.20, 95% CI 1.61–3.01) after adjusting for multiple confounding variables, including age, sex, survey year, BMI, educational level, smoking status, alcohol consumption, use of oral hypoglycemic agents and insulin injection, blood pressure, as well as HDL-C, LDL-C, and TG levels. However, associations between the T2DM duration and hypertension/dyslipidemia were not statically significant.
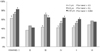
Trends in prevalences of hyperglycemia in patients with T2DM mellitus by the duration of illness and survey year
Fig. 4 presents the prevalence of hyperglycemia in patients with T2DM by duration of illness and survey year (KNHANES I–VI), adjusted for age, sex, BMI, educational level, smoking status, alcohol consumption, and use of oral hypoglycemic agents and insulin injection. Patients with a longer T2DM duration had a higher prevalence of hyperglycemia than those with a shorter duration of illness for most survey years, but particularly in the KNHANES I (P < 0.05), III (P < 0.05), IV (P < 0.05), and V (P < 0.05). We detected significant trends for a decrease in the prevalence of hyperglycemia in patients with a duration of illness ≥ 10 years (P for trend = 0.004). However, this trend was not observed in patients with a duration of illness of < 5 years and 5–9 years (P for trend = 0.5 and P for trend = 0.1, respectively).
DISCUSSION
Managing blood pressure as well as blood glucose and lipid levels is important for the prevention of diabetic complications and reduction of mortality in patients with T2DM. However, these risk factors may not be well managed as the duration of T2DM increases. Our findings showed that patients with a longer duration of T2DM tended to manage blood glucose levels more poorly than those with a shorter duration of illness, and overall levels of adherence to dietary recommendations for blood glucose management were poor, regardless of duration of illness.
In the British regional heart study, elderly men with a longer diabetes duration had a significantly greater risk of cardiovascular disease than those with a shorter duration of illness [11]. A similar observation was made in the U.S. population, where patients with a longer diabetes duration (≥ 10 years) showed an increased risk of coronary heart disease mortality compared to healthy subjects, with a hazard ratio (HR) of 2.6 (95% CI 1.5–4.7) for men and 4.8 (95% CI 3.0–7.8) for women [29]. The Northern Manhattan Study revealed that a risk of ischemic stroke increased approximately 3% per every 1-year increase in diabetes duration in patients from the U.S. with diabetes (HR 1.03, 95% CI 1.02–1.04) [9]. Furthermore, an Italian cohort study showed that a longer diabetes duration was associated with an increased risk for mortality in patients with T2DM [28]. The association between a longer T2DM duration and increased risk for mortality may be explained by several biological mechanisms. First, there is evidence that diabetes duration might be associated with reduced heart rate variability. A progressive decrease in autonomic function can occur in the early stages of diabetes, and these progressive diabetic metabolic impairments may be associated with worsening autonomic cardiac function [3031]. This could lead to cardiovascular events and sudden cardiac death [832]. Second, a longer duration of hyperglycemia may be associated with non-enzymatic glycosylation of proteins in the arterial wall, leading to the microvascular and macrovascular complications of diabetes [33]. Third, multiple metabolic dysregulation is more likely to occur in patients with a longer duration of disease. The prolonged co-existence of multiple chronic medical conditions may lead to an additive adverse impact on the risk of mortality among patients with T2DM [934]. Lastly, the long-term imbalance between abnormally increased free radicals and the simultaneous decline of antioxidant defenses in diabetes can lead to the development of complications of T2DM [835].
We observed higher prevalence of hyperglycemia among patients with a longer duration of T2DM than those with a shorter duration of illness although their management levels of blood glucose appears to have improved during the study period. The management of blood glucose is critical, but challenging, as the duration of illness prolongs, and patients become increasingly dependent on medication therapy. In a recent report, the trends in the use of antidiabetic drugs (insulin or oral hypoglycemic drug treatment) among diabetes patients increased from 29.7% in 1998 to 57.4% in 2007 [36]. These changes may explain the decreasing prevalence of hyperglycemia among diabetes patients in the current study, particularly for those with a longer duration of illness. However, hypoglycemic shock is a concern among patients with a longer duration of T2DM [37]. Patients undergoing intensive glucose management might be at a higher risk for hypoglycemia [3839] or life-threatening hypoglycemic events due to the use of intensive insulin therapy or the strict control of blood sugar and HbA1c levels. Prolonged hypoglycemia can increase the risk of vascular dysfunction such as vasoconstriction and platelet aggregation [40]. Although there is no clear mechanism explaining how insulin use is directly related to cardiovascular disease, extended use of insulin is associated with serious ischemic cardiac outcomes [41] and mortality [42]. These negative health effects of intensive glucose management were particularly observed among diabetic patients with a history of severe hypoglycemia or atherosclerosis and long diabetes duration [384344].
Adherence to healthy diet and lifestyle is important because it is safer and can enhance the effectiveness of glucose lowering drug therapy, compared to drugs alone [45]. However, we observed the trend of poor adherence to dietary and lifestyle recommendations, regardless of duration of illness. The least followed recommendations were sufficient vegetable consumption, which is particularly critical for patients with T2DM. Vegetables are rich in fiber and antioxidants, inhibiting the generation of reactive oxygen species and reducing the risk of cardiovascular disease and other diabetes complications in diabetes patients [46]. In addition, a previous meta-analysis showed that a low simple carbohydrate diet had beneficial effects including improvements in BMI, blood pressure, glycemic control and triglyceride levels [47]; moreover, moderating carbohydrate consumption should be critical for Koreans whose average intake levels of carbohydrate is approximately 73% of total energy intake [48]. Dietary recommendations should not be considered in isolation. For a more effective management, a synergistic combination of diet and lifestyle intervention with mediation therapy is required among patients with a long duration of diabetes.
This study has several limitations. In the KNHANES, the laboratory procedures for blood pressure, blood glucose, and lipid parameters changed over time [16]. However, the KNHANES maintains strict laboratory quality assurance and standardization programs to provide valid and reliable measurements [49]. Patients with T2DM were defined using self-reported information, which possibly led to diagnostic misclassification. Another limitation of the present study is its cross-sectional nature; thus, it is impossible to draw causality, and it is possible that we missed known or unknown residual confounding factors in the multivariable-adjusted estimates.
However, as we analyzed data from the KNHANES, a nationwide survey that is representative of the Korean population, our findings can be generalized to Korean adults with T2DM. In addition, to the best of our knowledge, our study is the first to examine the trends in the self-management levels of metabolic risk factors among Korean patients with T2DM, considering their duration of disease and confounding factors.
Our data indicate that overall self-dietary management was poor and about half of Korean patients with T2DM have not adequately managed their metabolic risk factors, including blood pressure, blood glucose levels, and lipid profiles, and the proportion of patients with adequate control of glucose levels decreased with a prolonged duration of T2DM. Therefore, it is crucial to develop an efficient and practical clinical education system and to provide individualized patient education programs to improve the self-management of diet and these risk factors for, the prevention or delay of diabetes complications and improvement of patients' quality of life.
 XML Download