

 PDF
PDF ePub
ePub Citation
 Print
Print


INTRODUCTION
Currently, 415 million patients worldwide are affected by diabetes, and this number is predicted to reach 642 million by 2040 as estimated by the International Diabetes Federation (IDF). Moreover, type 2 diabetes mellitus (T2DM) accounts for > 90% of the total cases. Thus, discovering a treatment for the T2DM epidemic is the urgent need. T2DM is a complex and polygenic disease attributed mainly by insulin resistance and pancreatic beta cell dysfunction, which are majorly caused by chronic hyperglycemia [1].
Worsening of insulin resistance and defect in β-cell function are the general phenomen during progression of T2DM. With increasing hyperglycemia in T2DM, the β-cell function and insulin resistance gradually deteriorate. It has conclusively been observed that the glucose-stimulated insulin secretion and β -cells are significantly reduced in pancreatic tissue [2]. Notably, in a 5-year follow-up study of patients, diagnosis of T2DM showed a 25% reduction in the mass of insulin-positive cells as compared to the non-diabetic control groups, whereas the β-cell mass of longstanding T2DM patients (> 15 year) was reduced by over 50%. Additionally, treatment with various extracts showed anti-diabetic effects that improved the insulin secretion and reduction of β-cells mass in transgenic T2DM mice [3456]. Therefore, since the β-cell dysfunction is crucial in the development of T2DM, a probable method to prevent and treat diabetes is the improvement of β-cells. Although various medicines are available for T2DM (sulfonylureas, biguanide, thiazolidinediones, and dipeptidyl peptidase-4 (DPP-4) inhibitor [789]), many undesirable side effects such as hypoglycemia, weight gain, hypersensitivity, gastrointestinal discomfort, nausea, liver and heart failure, and diarrhea, are associated with their long-term use [10]. Hence, extensive studies have been undertaken to identify a proper diet and plant-derived products for the treatment of diabetes.
Whole body glucose homeostasis is via an intricate balance of glucose production, mostly in by the liver. Hepatic glucose production (HGP) occurs due to the breakdown of glycogen, and the de novo synthesis of glucose from noncarbohydrate precursors via gluconeogenesis. The rate of gluconeogenesis is modulated by enzymes, including phosphoenolpyruvate carboxykinase (PEPCK) and glucose-6-phosphatase (G6Pase) [11]. Inhibition of hepatic glucose production contributes to the glycemic control in diabetic patients. AMPK is a serine/threonine protein kinase and is a crucial metabolic sensor of intracellular energy homeostasis. In T2DM, AMPK is often reported to be a potential therapeutic target. The activation of AMPK effectively promotes glucose utilization and insulin sensitivity [12]. Perilla frutescens (L.) Britt. var. japonica (Hassk.) Hara (PF), commonly called perilla or Korean perilla, is a species of perilla belonging to the mint family Lamiaceae. It is a well-known annual herbaceous plant, often used in foods and medicine in Asia countries such as Korea, China, and Japan. This plant is commonly known as “Dlggae” in Korea. The leaves are mainly used in various Asian foods, including sushi, garnish, salad, and soup, and the raw leaves are often used to wrap and eat grilled meat. Furthermore, the leaves have various medicinal effects useful in treating food poisoning [13]; anti-allergic, anti-inflammatory and anti-tumor promoting substances are also found in the perilla plants [141516]. Remarkably, sprouting has often been suggested as the method to improve the nutritional quality of seeds [17]. This is usually the result of breakdown of complex macromolecules such as starch and proteins into smaller, more digestible molecules, while at the same time lowering the amounts of anti-nutritional factors. PF leaves were identified by the isolation and characterization of phenolic acid, including rosmarinic acid (RA, alpha-O-caffeoyl-3, 4-dihydroxyphenyl lactic acid). RA is a natural phenolic antioxidant carboxylic acid. RA has various therapeutic effects including analgesic [18], anticancer [19], antidepressant, anxiolytic, neuroprotective [20] and anti-diabetic [21]. The present study investigated the contents of RA in PF sprout extracts, and evaluated the potential anti-diabetic activity and signaling mechanisms in vivo and in vitro.
MATERALS AND METHODS
Plant materials
Seeds of PF were washed thrice before imbedding in water for 4 h. The seeds were then transferred and grown in a rotary growth chamber (Dongseo Science, Republic of Korea) maintained at 60% relative humidity (RH), for 8 days at 22-23℃. The growth chamber was rotated 2 times/h. The collected sprouts were cold-dried immediately after sampling and stored at -20℃ until needed. All sample masses were based on dry weight.
Preparation of samples for analysis and treatment
For HPLC analysis, 0.5 g of the dried and powdered sample was extracted (with sonication) into 70% methanol (MeOH) at room temperature for 1 h. The extracts were filtered before analysis. For in vitro and in vivo studies, PF sprouts were extracted in 40% aqueous ethanol (EtOH) for 5 h at 70℃. After filtering the extracts, the solvents were rotary-vacuum evaporated and then freeze dried. The extraction yield from dry weight of PF sprouts was 15%.
High-Performance Liquid Chromatography (HPLC) analysis of PF compounds
Analysis of the compounds in the extract was performed using an Agilent 1200 series HPLC unit, equipped with a DAD. Samples were separated on Shiseido CapcellPak MGII C18 column (150 mm × 4.6 mm, i.d., 3 µm particle size), protected by a 10-mm guard column with a gradient elution system. The mobile phase consisted of two solvents: solvent A, a mixture of 0.5% formic acid/water, and solvent B, acetonitrile. A ratio of 80% A and 20% B was applied in the first and gradually increased to 70% B for 40 min. After 40 min, a ratio of 80% A and 20% B was used for next 5 min. The flow rate was maintained at 0.5 mL/min, and the column temperature was 35℃. Known phenolic or flavonoid standards were run to compare the retention times. All samples and standards were evaluated in triplicate.
Animals and treatment
Five-week-old male C57BL/6J-db/db mice weighing 20-25 g (Damul Science, Deajeon, Korea) were housed in cages with free access to food and water. Cages were maintained in temperature and light controlled rooms (23 ± 2℃, 55 ± 10%, 12/12 h light/dark cycle with lights on at 8:00) at least one week before the experiments. All experiments were approved by the Animal Care Committee of Jeonju AgroBio-Materials Institute, and strictly followed the committee guidelines (JBMI IACUC 2015002). Mice were randomly divided into six groups (n = 8 per group): DM (untreated control db/db), DM treated with RGZ (1 mg/kg body weight, Sigma-Aldrich, St Louis, MO, USA), DM treated with 100 mg/kg low-dose PF sprout extract, DM treated with 300 mg/kg middle-dose PF sprout extract, and DM treated with 1,000 mg/kg high-dose PF sprout extract. All treatments were for 4 weeks. The dose increments were determined on a logarithmic linear value. Body weight, food intake and water intake were monitored once a week. From each group, 5 mice showing average blood glucose level were selected. At the end of the study, blood and tissues were harvested from the sacrificed mice after deep anesthetization with tribromoethanol (Avertin, Sigma-Aldrich).
Measurement of blood glucose level and insulin
To study the effectiveness of PF sprout extract at different doses, a blood glucometer (ACCU-CHEK, Roche Diagnostics, Mannheim, Germany) measured the fasting (12 hours) blood glucose weekly during the treatment period, and insulin levels were determined using the enzyme-linked immunosorbent assay (ELISA) with a mouse insulin ELISA kit (ThermoFisher Scientific, Waltham, MA, USA).
Cell culture and glucose production assay
HepG2 cells were purchased from the Korean Cell Line Bank (Seoul, Republic of Korea) and cultured in DMEM supplemented with 10% FBS and antibiotics [penicillin (100 unit/mL) and streptomycin (100 µg/mL)]; cells were maintained at 37℃ in 5% CO2 humidified atmosphere. The glucose production from HepG2 was measured as previously described [22]. Briefly, cells were cultured on 24-well plates at a density of 1 × 10⁵ cells/well for 24 h and treated with or without PF sprout extracts in serum-free medium. After 24 h, the cells were washed three times with a pre-warmed glucose-free DMEM, and stimulated by cAMP (100 µM)/dexamethasone (500 nM) in the presence of PF sprout extract at various concentrations for another 24 h, in glucose-free DMEM. Cells were then washed twice with phosphate buffered saline (PBS) to remove glucose, and incubated for 2 h in a glucose production assay medium (glucose- and phenol red-free DMEM containing 2 mM sodium pyruvate, 20 mM sodium lactate). Glucose levels were measured using the glucose oxidase assay kit (BioVison, Inc., CA, USA). Glucose concentrations were normalized to the cellular protein concentration.
Oral glucose tolerance test (OGTT) and intraperitoneal insulin tolerance test (IPITT)
OGTT and IPITT were performed at the 4th week of the experiment. For OGTT experiments, all mice were fasted for 12 h before the experiment. On the experimental day, each mouse was administered D-glucose via intragastric gavage at a dosage of 2 g/kg body weight. Blood samples were drawn from the tail vein at 0, 30, 60, and 120 minutes (min) after administration of glucose, and glucose levels were measured using blood glucometer (Roche Diagonistics). For the IPITT experiments, mice were fasted for 4 h, following which they were intraperitoneally injected with insulin at 0.5 IU/kg body weight blood samples were collected at 0, 30, 60, and 120 min. to measure the glucose levels. The area-under-the-curve (AUC) value of glucose was determined using the total AUC from the sampling period ranging 0 to 120 min.
Measurement of serum metabolic parameters
Serum metabolic parameters were measured using commercial assay kits (Asan phams, Co., Ltd. Gyeonggi, Korea). Blood was collected in tubes containing EDTA2Na, and serum was obtained by centrifugation at 3,000 × g for 10 min at 4℃. Serum levels of aspartate aminotransferase (AST), alanine aminotransferase (ALT), total cholesterol (TC), and triglyceride (TG) levels were measured, as per the manufacturer's protocol.
Histology of liver and pancreas
Liver and pancreas tissue were removed and immediately placed in 10% formalin solution, embedded in paraffin and cut into 5 µm sections. Specimens were stained with hematoxylin and eosin (H & E) to identify morphological changes. Histological images were acquired by light microscopy (Nikon, Tokyo, Japan).
Immunoblotting
HepG2 cells and liver tissue were lysed in ice-cold lysis buffer [10 mM Tris-HCl (pH 7.4), 0.1 M ethylenediaminetetraacetic acid (EDTA), 10 mM NaCl, and 0.5% Triton X-100] supplemented with a protease and phosphatase inhibitor cocktail (Sigma-Aldrich). Protein concentrations were determined by bicinchoninic acid protein assay (ThermoFisher Scientific), using bovine serum albumin (BSA, Sigma-Aldrich) as a standard. Lysates (40 µg) were resolved on a 1012% sodium dodecyl sulfate-polyacrylamide gel electrophoresis (SDS-PAGE) gel, after which the proteins were transferred to PVDF membranes (BioRad, Hercules, CA, USA). After blocking with tris-buffered saline (TBS) containing 5% nonfat dry milk and 0.1% (w/v) Tween 20, membranes were probed with the primary antibody. The following specific antibodies were used to characterize protein expression: PEPCK, G6Pase, p-AMPK, AMPK (anti-rabbit, 1:2,500 dilution; Santa Cruz Biotechnology Inc., Dallas, TX, USA), and β-actin (anti-mouse, 1:5,000 dilution; Sigma-Aldrich). After overnight incubation at 4℃, the membranes were incubated with secondary antibody (anti-rabbit IgG-HRP or anti-mouse IgG-HRP). Immunoblots were visualized using Super-Signal Pico Chemiluminescent (ECL) substrate (Pierce Biotechnology Inc., Rockford, IL, USA) and autoradiography was performed using CCD imaging system (Luminograph, Atto, Tokyo, Japan). The relative band intensities were determined using Image J software.
Statistical analysis
Data are expressed as the mean ± standard deviation (SD). All data were analyzed using the commercially available software GraphPad Prism 6.0 (Graphpad Software, CA, USA). Statistical analysis was carried out using one-way analysis of variance (ANOVA) for repeated measures, followed by Tukey's multiple comparison tests. A value of P < 0.05 was considered significant.
RESULTS
Analysis of RA contents in PF sprout
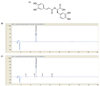
As shown in Fig 1, RA was detected as a major compound in the PF sprout extract. The amount of RA in the extract was analyzed using HPLC-DAD. The representative chromatogram of RA standard and PF sample is shown in Fig. 1B. The amount of RA in PF sprout extract was 15.239 mg/g. The minor compounds were detected as caffeic acid and apigenin-7-O-glucoside at the retention time 7.515 and 11.973 min, respectively. The quantity was found to be 0.274 mg/g and 0.057 mg/g, respectively.
PF sprout extract reduced the body weight gain in db/db mice
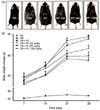
The db/db mouse model was used for T2DM. Chronic effects of the PF sprout extract on body weight was evaluated in this animal model. RGZ (1 mg/kg) was used as a positive control (PC). Non-diabetic (ND) mice showed a normal increase in body weight, whereas db/db mice exhibited rapid weight gain (Fig. 2A and Fig. 2B). Daily oral administrations of high doses of PF sprout extract (1,000 mg/kg) to db/db mice for 4 weeks significantly lowered the body weight, as compared to the vehicle-treated mice. Although the body weight of the mice treated with low and middle doses of PF sprout extract (100 and 300 mg/kg) were not significantly different from the vehicle-treated db/db mice, these groups showed slightly reduced weights as compared to the vehicle-treated group. At 4 weeks, a significant increase was observed in the body weight of db/db mice, as compared to control mice (Fig. 2B). Body weight at 4 weeks in the DM+ PC (1 mg/kg) and DM+ PF (100 and 300 mg/kg) groups were slightly less than the db/db mice. Interestingly, body weight in the DM+ PF 1,000 mg/kg group was significantly reduced as compared to the db/db mice group (Fig. 2B).
PF sprout extract improved hyperglycemia and glucose tolerance
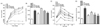
Blood glucose levels were measured in each group at the study termination. At 4 weeks, the levels were dramatically increased in db/db mice as compared to ND mice (AUC, 1,488.00 ± 47.68 vs. 569.30 ± 14.92, n = 8 mice/group, P < 0.001, Fig. 3A and Fig. 3B). However, the blood glucose level in DM + PC (1 mg/kg) and DM+ PF 1,000 mg/kg was significantly reduced compared to db/db mice (Fig. 3B). Unlike the high dose effect of PF, the lesser and middle dose of PF sprout extract (100 and 300 mg/kg) treatment did not markedly reduce the blood glucose level as compared with db/db mice (Fig. 3B). OGTT was performed to evaluate blood glucose homeostasis. As shown in Fig. 3C, glucose treatment in ND mice induced rapid increase in blood glucose levels reaching peak value at 30 min, and returned to baseline levels within 90 min. However, the blood glucose increase in PF sprout extract-treated groups were significantly lower than that of the db/db mice group (AUC, 977.80 ± 20.75, 779.60 ± 79.39 and 694.00 ± 73.76, respectively, vs 448.50 ± 23.05, P < 0.001, Fig. 3C and D) from 30 to 90 min, in a dose-dependent manner. For the positive control, the increased blood glucose level was also lower than those of the db/db mice (AUC, 713.60 ± 19.04 vs 448.50 ± 23.05, P < 0.001, Fig. 3D) from 30 to 90 min.
PF sprout extract improved the insulin resistance in db/db mice
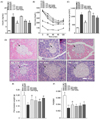
PF sprout extract administration for 4 weeks decreased the serum insulin levels compared with those of the db/db mice (Fig. 4A). To assess the effects of PF sprout extract on whole-body insulin sensitivity, an IPITT were performed. After a bolus insulin injection, the blood glucose level in the db/db mice group was higher than in the ND group (AUC, 1,081.00 ± 38.88 vs 310.6 ± 9.03, P < 0.001, Fig. 4C), as shown in Fig. 4B. However, the PF sprout extract treatment lowered the blood glucose levels significantly in the 300 and 1,000 mg/kg dose groups, from 30 to 120 min (AUC, 1,029 ± 106.20 and 893.40 ± 51.74 vs 1,081.00 ± 38.88, P < 0.05 and 0.01, respectively, Fig. 4C). These results indicate that the extract enhanced the insulin sensitivity in diabetic mice. Also, the reduction in blood glucose was more rapid in the PC group after insulin treatment than observed in the db/db mice (AUC, 624.30 ± 29.07 vs 448.50 ± 23.05, P < 0.001, Fig. 4C). The histopathological changes in pancreas are presented in Fig. 4D. The ND group showed a normal pancreatic structure, whereas the diabetic control shows degenerative and necrotic changes as well as islet shrinkage, indicating β-cell damage. The PF sprout extract treatment prevented islet destruction resulting in significantly preserved insulin levels (Fig. 4A) in a dose-dependent manner. Also, the PF sprout extract protected pancreatic weight loss compared to the db/db mice group (Fig. 4E and Fig. 4F).
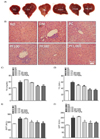
PF sprout extract decreased the serum TG and lipid accumulation in livers of db/db mice
After 4 weeks, the liver was enlarged and presented with a pale color in db/db mice (Fig. 5A). In contrast, treatment of PF sprout extract (100, 300, 1,000 mg/kg) showed regular size and normal appearance of livers (Fig. 5A). H&E staining of liver sections from the db/db group revealed excessive vacuoles in hepatocytes and derangement of liver cells (Fig. 5B), which was associated with increased serum TG and TC contents (Fig. 5C and Fig. 5D). Histopathological improvements were observed in the PF treated groups (Fig. 5B). The extract treatments (300 and 1,000 mg/kg) decreased the serum TG content (45.57 ± 0.13 and 46.33 ± 0.35 vs. 58.67 ± 1.65, P < 0.001, respectively, Fig. 5C). The serum TC level in RZG and PF sprout extract treated-group was also significantly decreased (47.87 ± 0.22, 45.34 ± 0.31, 34.24 ± 0.46 and 33.07 ± 0.16 vs. 57.82 ± 0.53, P < 0.001, respectively, Fig. 5D). The AST and ALT liver enzymes are closely associated with liver damage. Serum AST content was significantly decreased in all the treatment groups (197.40 ± 9.79, 192.70 ± 6.74, and 183.4 ± 7.23 vs. 239.90 ± 11.82, P < 0.001, respectively, Fig. 5E). Extract treatment at 100, 300 and 1,000 mg/kg also significantly decreased the serum ALT content (153.20 ± 11.74, 144.40 ± 13.28 and 146.70 ± 2.94 vs. 195.80 ± 8.21, P < 0.01 respectively, Fig. 5F). These results indicate that PF sprout extract treatment protects against liver injury in T2DM.
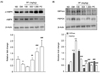
PF sprout extract induced AMPK activation and down-regulated gluconeogenesis
The liver is a primary organ involved in the regulation of blood glucose levels, and it does this by balancing the glucose uptake and storage with glucose release. The AMPK activation is important since AMPK inhibits hepatic glucose production and lipogenesis. As shown in Fig. 6, treatment with PF sprout extract (300 and 1,000 mg/kg) or RGZ markedly increased the phosphorylation levels of AMPK compared to the db/db mice group (Fig. 6A). Further investigation revealed the expression levels of G6Pase and PEPCK, which is a rate-limiting enzyme in gluconeogenesis pathway. The expression of gluconeogenic enzymes, G6Pase and PEPCK, were increased in db/db mice and were significantly reduced by the extract treatments (300 and 1,000 mg/kg) (Fig. 6B).
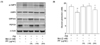
Similar inhibition of glucose production was observed in HepG2 cells after PF sprout extract treatment (Fig. 7B). Treatment of HepG2 cells with the extract showed comparable activation of AMPK and decreased the expression of gluconeogenic proteins (Fig. 7A). The production of glucose in response to the glucose production medium was also evaluated in HepG2 cells. Metformin, an AMPK activator, was used as a positive control. As a result, through AMPK activation, the PF sprout extract reduces hepatic glucose production by inhibiting the G6Pase and PEPCK expression.
DISCUSSION
T2DM is a metabolic disease that is characterized by insulin resistance, glucose uptake reduction, and hepatic gluconeogenesis. In this study, the anti-diabetic potential of PF sprout was evaluated in the T2DM mice model. To the best of our knowledge, this study demonstrated for the first time the underlying mechanism by which PF sprout alleviated the hyperglycemic conditions by activating AMPK through the inhibition of gluconeogenic signaling in T2DM mice liver as well as in HepG2 cells. The improvement of insulin resistance was estimated on by comparing the whole body and pancreas weight, insulin level in serum, histological examination of pancreas sections, OGTT and IPITT. In addition, the hepatoprotective activities of the PF sprout extracts were evaluated by liver weight, whole shape, and histology as well as biochemical analysis in serum (TG, TC, ALT and AST). We observed that the PF sprout extracts induced an increase in the phosphorylation of AMPK in liver tissues. Furthermore, PF sprout extracts suppressed the expression of key gluconeogenic proteins, such as PECK and G6Pase, in HepG2 cells and liver tissues.
In the current study, HPLC-DAD analysis revealed that RA, a diphenolic derivative of caffeic acid, was the main compound present in PF sprout extracts (Fig. 1). It has been reported that the phenylpropanoid RA exerts pronounced β-cell protection from oxidative stress caused by high-fat diet and streptozotocin in experimental animal diabetes [23]. Fruthermore, RA is suggested to exert anti-diabetic effect by α-glucosidase activity inhibition [24] and insulin resistance amelioration by decreasing the PEPCK expression in liver [21]. These reports indicate that RA could be the main effective compound in PF sprouts for anti-diabetic activity.
We also speculated that PF sprout extracts significantly decrease the TG and TC levels in diabetic mice. Valenti et al. [25] suggested that fatty liver disease had a complexly linked with T2DM development, as revealed by epidemiological, pathophysiological and molecular evidences. The elevated levels of ALT and AST appear in liver function abnormalities. In addition, their measurements are used as biomarkers for diagnosing hepatocellular injuries, since elevation of both ALT and AST levels has been shown in liver-specific damage in T2DM patients [26]. Subsequently, treatment with herbal extracts reduced the levels of ALT and AST, and blood glucose level was recovered in db/db mice [27] or patients [28]. Furthermore, complication of impaired liver function was also controlled by TG and TC levels in blood serum [26].
The AMPK system acts as a sensor of cellular energy status. It was reported that activation of AMPK stimulates insulin sensitivity. PF sprout extract treatments (300 and 1,000 mg/kg) increased the AMPK phosphorylation in liver tissues of db/db mice. The effect of PF sprout extract on AMPK is consistent with the decrease in fasting blood glucose and improvement in glucose and insulin tolerance in PF sprout extract treated diabetic mice.
AMPK is known to suppress hepatic gluconeogenesis [29], and has also been reported to repress the expression of gluconeogenesis enzymes, such as PEPCK and G6Pase [30]. The AMPK signaling pathway acts in the same direction with insulin in the liver, wherein the hepatic glucose production is suppressed. In this study, the hepatic PEPCK and G6Pase protein expressions were significantly decreased in PF sprout extract (300 and 1,000 mg/kg) treated db/db mice. In agreement, we have shown that PF sprout extract was also effective on AMPK activation and glucose production in HepG2 cells (Fig. 7).
In conclusion, we present evidence that PF sprout extracts exert beneficial effects on hyperglycemia, dyslipidemia, glucose and insulin intolerance. Treatment with the extracts also protected the histopathological alterations in pancreas and livers of db/db mice. The PF sprout extracts further improved AMPK phosphorylation in db/db mice liver tissues as well as HepG2 cells, and glucose production were attenuated by treatment in vitro. These findings suggest that PF sprouts have the potential for the prevention and treatment of T2DM.
 XML Download