

 PDF
PDF ePub
ePub Citation
 Print
Print


INTRODUCTION
Obesity remains a problem and an issue of great concern in many countries. The World Health Organization has reported that more than 1.9 billion adults were classed as being overweight and over 600 million as obese in 2014 [1]. The level of obesity can be classified by the body mass index (BMI). In the population of Asia, a normal BMI is accepted as being between 18.5-22.9 kg/m2 [2]. Being overweight or obese can increase health risks including those associated with non-communicable diseases such as diabetes, dyslipidemia, hypertension, cardiovascular disease, stroke, and some types of cancer [234]. Effective weight reduction can result in a decrease in these health risks [56].
Nutrition counseling strategies are evidence-based methods or plans of action designed to achieve behavioral changes toward a particular goal [7]. Such strategies are both a science and an art as they combine knowledge of nutrition with psychological skill [3]. The American Dietetic Association has summarized the association between nutrition counseling strategies and three behavior change theories: cognitive behavior, transtheoretical model, and social cognitive theories [8].
The core concept of the transtheoretical model (TTM) is that of stages of change (SOC), which focuses on the concept of behavioral change and the resultant move to a more healthful lifestyle. There are five stages within the SOC concept: precontemplation (no intention to change), contemplation (unsure whether to change, decisional balance between pros and cons), preparation, action, and maintenance stages [39]. However, the Cochrane review in 2014 reported that the effectiveness of the TTM in causing weight reduction in cases of obesity was unclear [10]. The small number of studies and the clinical and methodological heterogeneity among the studies reduced the likelihood of drawing effective conclusions [10]. Moreover, in Thailand, no studies designed to apply the TTM in nutrition counseling in obesity has been reported. Existing studies have been founded on other theories such as the health belief model, motivational interviewing, and self-efficacy [111213141516]. Therefore, a study into the application of nutrition counseling matched with use of the TTM in overweight and obese subjects was deemed a useful model of counseling with the aim of improving counseling effectiveness in a Thai setting. This study aimed to determine the effectiveness of an individualized program of nutrition counseling matched with the TTM in overweight and obese subjects by focusing on anthropometric measurements and SOC.
SUBJECTS AND METHODS
The subjects were recruited from the staff at Ramkhamhaeng Hospital, Bangkok, Thailand. Inclusion criteria included: age 19-60 years with a BMI of ≥ 23 kg/m2. Exclusion criteria were: BMI ≥ 40 kg/m2 or BMI ≥ 35 kg/m2 with at least one comorbidity; severe medical condition (including cancer, congestive heart failure, lung disease, chronic kidney disease, or trauma) or some other health condition (including hypothyroidism, hyperthyroidism, polycystic ovarian syndrome, or psychiatric disorder); anti-obesity drug use or having undergone bariatric surgery; use of some medications (including corticosteroids, antidepressants, or seizure medicines); smoking or heavy alcohol use; pregnancy or lactation; having spouse recruited (exclusion to prevent contamination if they are assigned to a different treatment); unable to participate in all session of the individual nutrition counseling program (appointment date can be flexible within a one week period); and failure to complete food records more than twice. All of the subjects gave consent for their participation in the study.
The study was approved by the Research Ethics Review Committee for Research Involving Human Research Participants, Health Sciences Group, Chulalongkorn University (COA No. 129/2016).
Study design
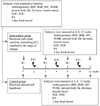
The study design was a randomized controlled trial involving two groups. The two groups were an intervention group receiving individualized nutrition counseling and a control group. The study was conducted in the outpatient department of Ramkhamhaeng Hospital, Bangkok, Thailand. Random allocation of staff from various departments in the hospital into either of the two groups was undertaken to prevent subjects working in the same department being assigned a different treatment. This was done to reduce contamination of the intervention. Next, the subjects were matched by age (not exceeding a variation of ± 3 years), BMI range (23-24.9, 25-29.9, and ≥ 30 kg/m2), and SOC by using stratified random sampling. The intervention group received individualized nutrition counseling matched with the TTM at 0, 4, and 8 weeks and a telephone call follow-up every 2 weeks between the face to face visits. The control group received an educational handbook at baseline without counseling. Assessments of anthropometrics (body weight; BMI; waist circumference; waist to height ratio; percent body fat (BF); fat mass, and muscle mass); SOC; process of change (POC); 3-day food record, and physical activity (PA) were undertaken at baseline and at each subsequent visit (4, 8, and 12 weeks) in both groups (Fig. 1).
Intervention
Counseling was based on the nutrition care process principle [37]. Three, 30-45 minute counseling sessions were conducted, each followed by telephone communication for approximately 5-10 minutes between sessions. The total follow-up period was designed based on a study with a duration of 12 weeks [15]. Since this program comprised individualized counseling matched with the subjects' readiness status, the study period was designed with a moderate duration (12 weeks), which was considered adequate for intervention. Nutrition counseling was individualized by SOC in all subjects in the intervention group based on responses to the S-Weight questionnaire [17]. The researcher assessed the SOC of each subject in the intervention group at each visit. Educational media included each of the following: subject record book, risk awareness leaflet, educational handbook, food model, pictures showing complications of obesity, and pictures illustrating good quality of life of those who achieve a normal weight during their life. All handbooks and leaflets were verified and approved for content by four experts in relevant fields (two endocrinologists and two specialized nutritionists). All subjects in the intervention group kept subject record books which contained measured anthropometric data, goals, and the weight loss plan designed by the researcher.
In the precontemplation stage, counseling aimed to increase self-awareness of the problem of being overweight, and the risk awareness leaflet was given to the subject. In the contemplation stage, the aim was to motivate initiation of a behavior change. The pros and cons of lifestyle change were discussed by using pictures showing risks of chronic disease and benefits of healthy eating. In addition, the researcher helped the subject identify and decrease barriers to making such changes and induced them to realize the positive reasons for losing weight. The risk awareness leaflet was again provided at this stage. In the preparation stage, the researcher discussed the weight loss plan with the subject, suggested some small changes for weight reduction, and asked them about their eating behaviors and physical activities. Subsequently, the researcher identified problems associated with weight gain and helped the subject make specific goals and a plan to achieve the goals. A commitment was determined to be necessary to achieve those goals, and an educational handbook was provided to subjects at this stage. This was followed by the action stage in which the researcher discussed with the subject the actions necessary for weight reduction. The researcher assessed their behavior, identified problems associated with their actions, and discussed how to revise the plan with the subject. The subjects were again given the educational handbook at the start of the action stage.
The subjects were advised to reduce their caloric intake by 500 kcal/day from their normal daily requirement (total caloric intake of approximately 1,200-1,500 kcal/day) [418]. Increased PA for at least 25-30 minutes per day on 3-5 days per week was encouraged. The activity was to occur in one session or be split into sessions lasting 10 minutes or more [418]. In the maintenance stage, the researcher helped reflect and discuss the subject's lifestyle; that is, eating behaviors, physical activities, problems or lapses that occurred. The researcher discussed positive ways of preventing and managing relapses and encouraged the subject to maintain their plan in this stage. The subject again received the educational handbook and a specific plan for the maintenance stage.
Measurements
Anthropometry outcomes included body weight (BW), BMI, percent BF, fat mass, and muscle mass which were measured by using the Body Composition Analyzer (Tanita MC-780MA). Waist circumference (WC) was measured at a horizontal line at the high point of the right iliac crest to indicate the mid-axillary line of the body by using a measuring tape (Butterfly band). Waist to height ratio (WHtR) was calculated by the division of WC by height (cm). Subject height was measured by using a measuring rod (Seca 220).
Behavior changes were assessed based on the TTM using the SOC and POC measures. The SOC and POC were measured by using S-Weight and P-Weight questionnaires that had been translated into Thai. The Thai versions of the questionnaires were approved by three experts in obesity and nutrition with the validity test being based on an index of item-objective congruence score ≥ 0.67 for all items. Questionnaire reliability was tested in ten overweight and obese subjects derived by convenient sampling by using Cronbach's alpha; the reliability score was 0.95. The S-Weight questionnaire aimed to determine the subject's stage within the five stages of change: precontemplation; contemplation; preparation; action, and maintenance. The subjects were asked to choose their current weight management stage. The P-weight questionnaire aimed to determine the processes involved in the change and included 32 items within four change processes: emotional re-evaluation; weight consequences evaluation (WCE); supporting relationships (SR); and weight management actions (WMA). The subjects answered questions on a 5-point Likert scale ranging from 1 (strong disagreement) to 5 (strong agreement). All scores were obtained and then used to calculate and identify the individuals' POC status. Subscale scores were calculated by summing up scores obtained on items belonging to the same subscale. Each subscale score was transformed into a scale from 0 to 100 (a minimum score of 0 = no use of that process to a maximum score of 100 = full use of the process). Higher use of a process is represented by scores above 50, while a lower use of a process by scores below 50 [17192021].
Food intake was calculated by summing the 3-day food record and is presented as consumptions of energy, carbohydrate, protein, and fat.
Statistical analysis
Intention-to-treat analysis was used in the study. Numerical anthropometry, POC, and food intake data were compared between groups by using an independent t-test. A repeated measures ANOVA was used for comparison within a group across the study. A Chi-squared test was used to compare ordinal data between groups, including the SOC and PA levels. Wilcoxon signed ranks test was used for comparisons within a group over the course of the study. All analyses were performed by using SPSS software, version 16.0.
RESULTS
Subject flow and characteristics
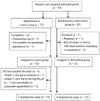
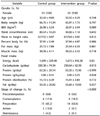
The flow of subjects through the study is shown in Fig. 2. A total of 50 subjects were enrolled in the study, and, after various exclusions, 45 subjects remained with 23 in the control group and 22 in the intervention group. Group data underwent intention-to-treat analysis. The baseline characteristics of the subjects in the two groups were compared. All subjects were female and had an average age and standard deviation of 32.87 ± 9.05 years. There were no significant differences between the two groups in any measurements at baseline (Table 1).
Anthropometry
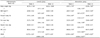
Anthropometric changes at the end of the study are summarized in Table 2. The BW in the intervention group decreased significantly by 1.98 ± 1.75 kg, compared with a decrease of 0.17 ± 1.67 kg in the control group (P = 0.001). The mean BW and BMI were significantly different from baseline at 4, 8, and 12 weeks (P < 0.001) in the intervention group, whereas there were no significant differences in the control group. At the end of the trial, there was a significant reduction in percentage weight loss (3.03%± 2.75%) in the intervention group as compared to 0.22%± 2.54% in the control group (P = 0.001). The percentage of BF in the intervention group showed a reduction of 1.54%± 2.11%, while it increased by 0.08%± 2.05% in the control group at the end of the study (P = 0.012). Fat mass decreased significantly in the intervention group compared to the control at 4, 8, and 12 weeks (P = 0.010, P < 0.001, P = 0.002, respectively). Changes in muscle mass were notable with a significant reduction in the intervention group ranging from 38.22 ± 2.32 kg to 37.93 ± 2.28 kg at 4 weeks (P = 0.009); however, there were no significant differences in the reduction of muscle mass between the groups throughout the study. The mean WC showed a reduction of 5.35 ± 3.84 cm in the intervention group, while it increased by 0.13 ± 3.23 cm in the control group at the end of the 12-week trial (P < 0.001). There were significant differences in WHtR changes between the groups at 4, 8, and 12 weeks (P < 0.001). Reduction of WHtR was 0.0336 ± 0.02 in the intervention group and 0.0004 ± 0.02 in the control group at the end of the trial.
Food intake
Food consumption by the subjects in the control and intervention groups during the trial is summarized in Table 3. There were significant reductions in energy intake within the intervention group at 4, 8, and 12 weeks compared to baseline (P = 0.005, P < 0.001, P < 0.001, respectively), while there were no significant differences within the control group. Energy intake was significantly reduced in the intervention group (by 405.09 ± 431.31 kcal/day) compared to that in the control group (74.92 ± 499.54 kcal/day) at the end of the trial (P = 0.022). Carbohydrate intake was significantly decreased within the intervention group at 4, 8, and 12 weeks when compared to baseline (P = 0.009, P = 0.001, P = 0.001, respectively), while there were no significant differences within the control group. The reduction of carbohydrate intake between the groups approached statistical significance at 12 weeks (P = 0.065). Likewise, fat intake was significantly reduced (by 16.28 ± 20.18 g/day) in the intervention group compared to the 0.91 ± 25.29 g/day reduction in the control group at the end of the trial (P = 0.030). Protein intake was slightly reduced (by 0.13 ± 0.28 g/kg/day) in the intervention group, while it was slightly increased (by 0.05 ± 0.36 g/kg/day) in the control group at the end of the trial (P = 0.064). Moreover, in the intervention group, there was a significant reduction in protein intake at 4 and 12 weeks when compared to that at baseline (P = 0.041, P = 0.037, respectively). However, the results indicate that the protein intake level in the intervention group was approximately 0.8-1.0 g/kg/day across the study.
Stages and Processes of change
The proportions of the subjects at each of the five change stages are shown in Table 4. In both groups, there was a significant improvement in the move toward a better stage at the end of the trial (P = 0.003 and P < 0.001 in the control and intervention groups, respectively), but there was no significant difference between the groups. The results were analyzed by grouping the SOC into pre-action (precontemplation, contemplation, and preparation) and action (action and maintenance) stages. At the end of the trial, the proportion of subjects in the action class reached a higher level in the intervention group than in the control group (90.9% and 65.2%, respectively, P = 0.071). The mean scores of the POC are shown in Table 5. The actual values of the total POC scores were significantly increased at 12 weeks compared to those at baseline in the intervention group (P = 0.001), but there was no significant differences between the groups. POC scores of 100 indicated that the subjects had used the processes for weight reduction. The WMA process had the lowest scores when compared to the scores for other processes in both groups at baseline. In the intervention group, the WCE, SR, and WMA scores were significantly higher at the end of the trial (P = 0.037, P = 0.013, and P < 0.001, respectively). The WCE and WMA were also significantly higher in the control group at 12 weeks (P = 0.032, P = 0.021, respectively). There was a significant increase in the WMA process in the intervention group when compared to that in the control group at 12 weeks (P = 0.046).
Physical activity
The results showed that the proportions of subjects in both groups did not differ significantly in their PA levels at baseline (65.2% low, 34.8% moderate, 0% high and 63.6% low, 27.3% moderate, 9.1% high, in the control and intervention groups, respectively, P = 0.528) or at the end of the trial (73.9% low, 26.1% moderate, 0% high and 54.5% low, 36.4% moderate, 9.1% high, in the control and intervention groups, respectively, P = 0.258).
DISCUSSION
This study applied the TTM along with a face to face individual nutrition counseling program for weight reduction. Our study included three counseling sessions in an 8-week period, and, at 12 weeks, the intervention group subjects showed a significant weight loss of 1.98 kg, a 3% loss of initial weight, resulting in a reduction of BMI. Weight loss in this study was comparable to that reported in previous studies. One study using telephone and mail consultations for 9 months showed a significant weight loss between groups of 2.12 kg at 24 months [24]. Another study using group counseling showed a significant weight loss of 0.96 kg in a 6-month period [25]. Our study showed an earlier reduction in weight loss (at the 4th week) than that observed in the 6- and 24-month studies [2425]. Various techniques for using TTM have been applied; for example, group workshops, counseling using telephone and mail, and face to face counseling. Our study, using face to face sessions, may help maximize the early weightloss effects compared to the other studies [2425]. It might also show that three counseling sessions matched with the TTM can be effective in producing a clinically significant weight loss within a 12-week period. Our results were consistent with another study using a self-efficacy program to produce weight loss in the same duration [15]. In addition, the subjects in the present study were hospital staff members, who might be more concerned about health problems and may be more likely to change their nutrition consumption behaviors. This might contribute to the significant changes observed, as well as the early effects detected.
The results of our study indicate that WC was significantly decreased, by 5.35 cm in the intervention group at 12 weeks, compared to a reduction of 1.1 cm at 6 months in another study [25]. In addition, WHtR has been reported to be important indicator of health risks associated with chronic disease [2627]. Very few studies applying TTM have addressed this indicator. A WHtR ≥ 0.5 has been associated with cardiovascular risk and mortality [262829]. The results in this study showed that WHtR was significantly reduced from 0.58 to 0.54 in the intervention group along with reductions in percent BF and fat mass while muscle mass was maintained. This reduction in WHtR is of clinical significance and is likely to reduce the health risk of the subjects who participated in this counseling program [26].
At the end of the trial, energy consumption was significantly reduced, by approximately 405 kcal/day, and there was a significant reduction in the amounts of dietary carbohydrate and fat consumption in the intervention group. These results are similar to those in other studies that have reported positive effects of TTM-based intervention including a lowered caloric intake and less consumption of fat and sugar [2530]. However, the intake of protein in this study tended to decrease in the intervention group, although the protein level remained adequate for maintenance of health [3132]. Muscle mass was slightly decreased along with the reduction of protein intake but only at week 4 and muscle mass later increased to the normal level. Therefore, to conserve muscle mass, it is noteworthy to stress to subjects the importance of maintaining protein intake during a weight reduction program. This can be done by encouraging subjects to choose lean meat instead of high-fat meat as part of their weight control plan.
There were no significant changes in the PA levels in either study group. Another study applying a motivational approach toward weight reduction in Thailand also showed no change in the subjects' mean score of exercise behavior after the trial [13]. However, one study which applied the TTM showed that exercise behavior progressed from pre-action to the action [24]. When asked, subjects in the present study who could not increase their PA level, reported they had long working hours that prevented a possible increase. The option of incorporating lifestyle changes to increase PA such as walking in the workplace, using the stairs, and doing housework were discussed. However, it was acknowledged that long working hours might be a barrier to doing more PA. It has been reported that working middleaged women have the lowest rate of exercise compared to other age groups. That survey also reported the most frequent reason for not doing exercise was lack of time [33].
The present study results show that the SOC improved to a better stage in both study groups. Grouping the SOC into pre-action and action stages indicated a tendency for the intervention group to progress in greater proportion to the action stage than that shown by the control group. Other studies applying the TTM also showed significant improvement of SOC in the action stages; however, the SOC in these studies focused on the target behaviors of eating and exercise, instead of readiness for weight loss [242530]. There have been a few TTM studies that assessed the use of POC in weight management intervention. Our findings found a significant increase in the total POC score from that at baseline in the intervention group only. Regarding the four change processes, the WMA domain of our subjects had the lowest score at baseline. However, the results showed that the counseling program helped to improve the WMA score by the end of the study. In contrast, the other three change processes were quite high at baseline. This may be explained by the fact that most subjects are medical staff and all work in a hospital. Their knowledge and working environment can help increase awareness of health problems, and they might also have a good support system for weight reduction. Another study indicated that although some obese people have good knowledge and a positive attitude about tackling their obesity, they still practice unhealthy behaviors [34]. The WCE was increased in both groups at the end of the trial, while the SR was increased in the intervention group only. This result might be due to the face to face counseling program helping to support the intervention group subjects' SR domain related to weight reduction compared to that in subjects in the control group.
A strength of this study is its randomized control trial design. Concurrent measurements of various aspects including anthropometry, behavior change, food intake, and PA across the study were undertaken. Also, behavior changes based on the TTM were assessed at all stages, as well, the four change processes were also assessed. However, there are some limitations in the present study. First, only female subjects were enrolled since most staff in this hospital setting are female. The Thai national health examination survey reported that the obesity rate in women is higher than in men, therefore, a study involving women could only help support national strategies to reduce obesity in females [35]. Second, the study was conducted by recruiting staff in a hospital setting. Therefore, results obtained may not be generalized to other sectors of the population who have different characteristics. As described above, the hospital-based participants may be more aware than other sectors of society of the dangers of being overweight or obese, and hence, they may be more willing to attempt to address the issue.
In conclusion, an individual nutrition counseling program matched with a transtheoretical model can improve weight reduction, BF, WC, and WHtR in overweight or obese middleaged women. Such a program can improve the SOC within the WMA process domain. However, further studies with long-term follow-up in different populations, including an extension to the study design that helps to enhance PA, are needed.


 XML Download