Abstract
BACKGROUND/OBJECTIVES
SUBJECTS/METHODS
RESULTS
Figures and Tables
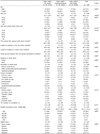
Table 1
Sociodemographic information by body weight change status of adult North Korean refugees in South Korea

KRW: Korea won
1)Frequency (%)
2)Chi-square test
3)Mean ± SD
4)Tukey's honestly significant difference test
5)One-way analysis of variance
6)Fisher's exact test
7)Date of second examination - date of leaving North Korea
8)Date of entry in South Korea - date of leaving North Korea
9)Date of second examination - date of entry in South Korea
10)Second examination - first examination
Table 2
Anthropometric measurements and weight status perception according to the weight change status over the course of relocation in adult North Korean refugees

Table 3
Food security information by the weight change status over the course of relocation in adult North Korean refugees

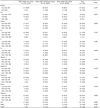
Table 4
Dietary behaviors by the weight change status of adult North Korean refugees in South Korea

1)Proportion of [the number of people who answer 'no' whether to eat meal (breakfast, lunch, dinner) or not the day before] + [the number of subjects who answer 'no' whether to eat meal (breakfast, lunch, dinner) or not the day before].
2)%: skipping meal rates were calculated from 2-day data, therefore, only average percentages are presented in the table.
3)Chi-square test
4)Rate of people generally (more than 4 days per week) eating a meal with their family
5)Frequency (%)
6)The frequency of people who answer 'How often do you eat out on average within a year?'
7)Fisher's exact test
8)The rate of people who eat functional food continuously for more than 2 weeks, within 1 year
9)The rate of people who eat vitamins & minerals continuously for more than 2 weeks, within 1 year
10)Proportion of having nutrition education or counseling within 1 year
Table 5
Food consumption frequency1) by the weight change status of North Korean refugees in South Korea

1)Average daily food consumption frequency: calculated by weekly food consumption frequency per response rate/7
Weekly food consumption frequency: 3 times per day (21 times per week), 2 times per day (14 times per week), once per day (7 times per week), 4–6 times per week (5 times per week), 2–3 times per week (2.5 times per week), once per week (once per week), 2–3 times per month (0.58 times per week), once a month (0.23 times per week), 6–11 times per year (0.16 times per week), and rarely (0 times per week)
2)Mean ± SD
3)One-way analysis of variance
4)Kruskal-wallis test
Table 6
Energy and nutrients intake levels by the weight change status of adult North Korean refugees in South Korea1,2)

EER, estimated energy requirement; EAR, estimated average requirement; RNI, recommended nutrient intake; OINC, overall insufficient nutrient consumption; OCEF, over consumption of energy and energy fat.
1)Energy, less than EER; fat, less than acceptable fat distribution ranges; other nutrients, less than estimates average requirements
2)Energy, over EER; fat, more than acceptable fat distribution ranges; other nutrients, over 125% recommended nutrient Intake
3)Frequency (%)
4)Chi-square test
5)Fisher's exact test
6)Intake of sodium is over goal intake (2.0 g/day)
7)Energy intake is under 75% EER, and intakes of calcium, iron, vitamin A, vitamin C, and riboflavin are under EAR
8)Intake of energy and fat is over 125% EER and adequate range
Table 7
Index of nutrient quality1) by the weight change status of adult North Korean refugees in South Korea

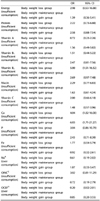
Table 8
Odds ratio for likelihood of under- or over-consumption of energy and nutrients by body weight change1-3) of adult North Korean refugees in South Korea

OR, odds ratio; CI, confidence interval; OINC, overall insufficient nutrient consumption; OCEF, over consumption of energy and energy fat.
1)Multinomial logistic regression
2)Dependent variable: energy and nutrients intake [reference: individuals who consumed over estimated energy requirement (EER) or estimated average requirement (EAR)], independent variable: body weight changes (reference: body weight maintenance group)
3)Covariates: sex, age, age upon leaving North Korea, length of residence in the 3rd nation, length of residence in South Korea, current monthly income, current occupation, education, and marital status
4)Individuals who consumed over intake goal (2.0 g)
5)Intake of energy is under 75% EER, and intakes of calcium, iron, vitamin A, and riboflavin are under EAR. Reference: not OINC
6)Intake of energy and fat is over 125% EER and in adequate range. Reference: not OCEF


 PDF
PDF ePub
ePub Citation
 Print
Print


 XML Download