

 PDF
PDF ePub
ePub Citation
 Print
Print


INTRODUCTION
The doubly labeled water (DLW) method is considered the gold standard for the measurement of total energy expenditure (TEE) [12]. The TEE can be used to obtain an individual's estimated energy requirements (EER), based on observations that for an individual to maintain energy balance and a stable body weight, energy intake should be equal to energy expenditure [34]. The DLW method has been shown to be highly accurate, and it allows the possibility of measuring energy expenditure in free-living individuals [5]. However, the number of studies using the DLW method for the measurement of TEE is limited due to various challenges, including the high cost of DLW, expensive analytical equipment, and a high level of technical expertise required to obtain analytical measurements. In addition, it has been observed that most studies using the DLW method were conducted on a limited number of subjects [3].
Nevertheless, total energy expenditure (TEE) measured by the DLW method (TEEDLW) has been used as a basis for the calculation of a population's EER in several developed countries including the USA, Canada, Australia, Germany, and Japan [3]. In 2002, the Institute of Medicine (IOM) of the National Academies established dietary reference intakes (DRI) for Americans and Canadians, and the equations for EER were developed by using pooled data from studies that had used the DLW method [3]. Since 2005, these equations have been used for establishment of EER in the Dietary Reference Intakes for Koreans (KDRI) [6].
Population characteristics such as ethnicity have been reported to be among the factors that affect energy expenditure [7]. However, the DRI predictive equations for EER, which were developed based on American and Canadian populations, have not been investigated for accuracy in the Korean population, which has different ethnic characteristics from those in other countries [3]. The purpose of this study was to assess the accuracy of DRI equations for determining EER in Korean adults by using the DLW method as a reference method.
SUBJECTS AND METHODS
Study subjects
Participants in this study were from the population of the Gangneung region in Gangwondo Province, Korea. Recruitment was done through internet advertisement and flyers that were displayed in the area. Subjects were between 20 and 49 years of age. The following inclusion criteria were applied: (1) normal weight (18.5 ≤ body mass index [BMI] <25), (2) absence of disease or taking medication that affects energy metabolism, (3) not in a weight control program, (4) not a highly exercising individual, and (5) living in the study province for 2 weeks before and during the study. The present study initially involved a total of 72 adult participants, including 36 men and 36 women. However, mid-study, one man dropped out and the final number was 71 participants.
Overview of the protocol
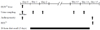
Before participating in the study, every participant signed a written informed consent. In addition, approval was received from the institutional review board of Gangneung-Wonju National University (approval GWNUIRB-2013-3). The TEE was measured over a 2 week period by using the DLW method, which has been described in detail elsewhere [2]. Briefly, the DLW dose was administered on day 0, after taking the baseline urine sample and obtaining anthropometric measurements. Subjects were then instructed to take subsequent urine samples on postdose days 1, 2, 13, and 14. During this measurement period, a 24-hour dietary recall was conducted on 3 non-consecutive days for each subject (2 weekdays and 1 weekend day). On the last day of measurement (day 15), anthropometric measurements were taken and the participant's resting energy expenditure (REE) was measured. The study protocol is presented in Fig. 1.
Anthropometric measurements
Subjects' anthropometric measurements were taken on the first and last days of testing, to assess whether there was a body weight change during the testing period. Height was measured using an automatic extensometer (BSM 330, Biospace, Korea) with subjects standing upright with light clothing and without shoes. In addition to obtaining body weight, the percentage of body fat and fat-free mass were measured by using the body composition analyzer (InBody 720, Biospace, Korea), which is based on a bioelectrical impedance method.
Resting energy expenditure
The subject's REE was assessed by performing indirect calorimetry with a ventilated hood system (TrueOne2400, Parvo Medics, USA). To achieve accurate assessment of REE, participants were instructed to fast for at least 12 hours before measurement and to abstain from exercise during a pre-test period of 24 hours. On the morning of measurement day, they were instructed to refrain from physical activities as much as possible. After arriving at the laboratory, the subject was told to lie on a bed and rest for at least 10 minutes, after which the subject's head was covered by the calorimetry canopy. During measurement, subjects breathed comfortably for 15 minutes and the volumes of consumed oxygen and produced carbon dioxide were measured. These measured volumes were applied in an abbreviated Weir's formula [89] for the calculation of REE: where VO2 is the volume of consumed O2 and VCO2 is the volume of produced CO2.
Dietary data
The participants' dietary data were collected within the two weeks of the DLW measurements by using a 24-hour dietary recall method. This was done for 3 non-consecutive days (2 weekdays and 1 weekend day) for each subject. On the day of dietary data collection, all foods and drinks consumed on the previous day were recorded. To minimize possible sources of error (recall bias) in the information on food intake, food models were used during the subject interview. Nutritional analysis of the recorded foods and drinks was performed by using the CAN-PRO 4.0 software, which was developed by the Korean Nutrition Society.
Measurement of TEE
TEE was assessed over a 14 day period by using the DLW method. The principles of this method have been extensively discussed elsewhere [2]. Briefly, the DLW was prepared by mixing 0.18 g of 18O (10%) per kilogram of total body water and 0.12 g of 2H (99.9%) per kilogram of total body water. The 18O was purchased from Taiyo Nippon Sanso, Japan, while the 2H was purchased from Sigma-Aldrich, USA. Subject's total body water (TBW) was estimated as 60% of body weight [2]. Before DLW dose administration, subjects' baseline urine samples were collected. Subsequently, every subject ingested 1.1 g of the DLW dose per kilogram of body weight. To avoid any loss of the dose, subjects were requested to drink with caution. In addition, the cup used for dose administration was rinsed with 100 mL of tap water, which was then ingested by the subject. Subjects were then instructed to take further urine samples on the following day (day 1), as well as on days 2, 13, and 14. The urine samples collected on day 0 were taken at the laboratory, whereas those collected on subsequent days were taken by subjects at their residences. To ensure the accuracy of results, every subject collected their urine samples at the same time of the day and collection times were recorded. In the morning of the urine sample collection day, the subject discarded the first urine voided after waking up, and the study sample was collected at least 2 hours later.
For urine sample analysis, 2H equilibration was done with platinum catalyst, and 18O was equilibrated by using CO2 gas. The 2H and 18O isotopes in urine samples were measured by using an isotope ratio mass spectrometer (Finnigan Delta Plus, Thermo Fisher Scientific, USA). The rates of 2H and 18O elimination from the body (kh and ko, respectively) were calculated using the natural logarithm of the isotope concentrations in the urine samples. The rate of CO2 production (rCO2) was calculated by using the following equation [210]:
DRI predictive equation for EER
In the present study, EER was calculated by using the DRI predictive equations developed by the IOM of the National Academies in 2002 [3]. In these equations, a physical activity (PA) coefficient was applied according to the subjects' PAL. The IOM DRI equations for EER are given below: where where
Data analysis
Data analysis was performed by using IBM SPSS software, version 21.0 (IBM, USA). The difference between gender groups was assessed by using independent Student's t-test. To assess the accuracy of the DRI predictive equation, EERDRI was compared with TEEDLW. A prediction of EERDRI between 90% and 110% of the TEEDLW was considered an accurate prediction, a prediction <90% of the TEEDLW was classified as an underprediction, and a prediction >110% of the TEEDLW was classified as an overprediction [1213]. The percentage of participants that had a predicted EERDRI within ±10% of the TEEDLW was considered a measure of accuracy on an individual level [14]. To evaluate how well the model predicted when using our DLW data, we determined the root mean squared prediction error (RMSE), which is a measure of precision [15]. This measure determines how close the predicted value for each subject (EERDRI) was to the measured value (TEEDLW) [16]. The following formula was used for calculation [17]:
Correlation analysis was performed to evaluate similar tendencies between two methods. To assess the agreement between the EERDRI and TEEDLW, the Bland-Altman test was performed. Limits of agreement between the two methods (mean difference±2SD) were calculated. Narrow limits of agreement indicate that the equation could be used with confidence as an alternative to undertaking DLW studies to determine EER [18]. All results are expressed as mean±standard deviation (SD) values, and statistical significance was set at P<0.05 for all tests.
RESULTS
Characteristics of the subjects
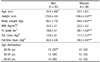
A total of 71 healthy adults (35 men and 36 women) aged 20-49 years old participated in this study. Characteristics of the subjects are summarized in Table 1. Height and body weight were significantly higher in men than in women (172.6±5.9 cm vs. 159.4±5.9 cm and 69.1±7.0 kg vs. 56.5±8.5 kg, respectively) (P<0.001). The average BMI was in the range of normal weight for both men and women (23.2±2.1 kg/m2 and 22.2±3.2 kg/m2, respectively), while the percentage of body fat was significantly higher in women (30.1%±5.6%) than in men (18.6%±5.1%) (P<0.001). Women had also a higher body fat mass than men (17.3±5.3 kg and 12.9±4.1 kg, respectively, P<0.001). In contrast, the fat-free mass (FFM) was higher in men (56.2±5.8 kg) than in women (39.2±4.6 kg) (P<0.001).
Energy expenditure of the subjects
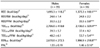
The results of subjects' energy expenditures are shown in Table 2. The REE was significantly higher in men (1,695.3±118.2 kcal/day) than in women (1,375.3±160.1 kcal/day) (P<0.001). However, there was no significant difference between gender groups in the REE adjusted for body weight (REE/BW). Regarding the REE adjusted for fat-free mass (REE/FFM), it was significantly higher in women than in men (35.5±3.8 kcal/kg/day and 30.3±2.2 kcal/kg/day, respectively) (P<0.001). The TEEDLW was significantly higher in men compared to women (2,706.0±418.8 kcal/day and 2,091.4±322.2 kcal/day respectively, P<0.001). Concerning the PAL, it was significantly higher in men (1.55±0.19) than in women (1.46±0.16) (P<0.05).
Accuracy of the DRI predictive equations
Table 3 presents the results of the DRI predictive equation accuracy assessment. The IOM DRI predictive equations underestimated EER by 36.3±266.1 kcal/day (percentage bias of -1.3%±9.8%) in men and by 104.5±193.5 kcal/day (percentage bias of -4.9%±9.3%) in women. The percentages of accurate prediction were 77.1% in men and 62.9% in women. Concerning the RMSE, it was 188.1 kcal/day in men and 173.8 kcal/day in women. The maximum negative error was -23.4% in men and -20.4% in women, while the maximum positive error was 17.4% in men and 13.6% in women.
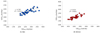
A scatter plot of TEEDLW compared with EERDRI is shown in Fig. 2. There was a strong correlation between TEEDLW and EERDRI (r=0.783, P<0.001 in men; r=0.810, P<0.001 in women).
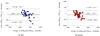
The Bland-Altman plot for evaluation of agreement between EERDRI and TEEDLW is presented in Fig. 3. The subjects' average bias between EERDRI and TEEDLW was closer to zero in men than in women (-36.3 kcal/day and -104.5 kcal/day, respectively). The limits of agreement were smaller in women than in men (interval widths: 758.4 kcal/day for women and 1043.3 kcal/day for men).
DISCUSSION
In this study, TEE was measured in 71 non-obese Korean adults aged 20-49 years by using the DLW method. The objective was to validate the IOM DRI predictive equation for EER by comparing its results with those of TEEDLW. In both men and women participants, the PAL was that of “low active” people as defined in the IOM DRI report [3]. Our results are in agreement with the pooled results reported for different studies on Koreans' PAL [192021222324], which were used as a basis for the development of KDRI [5]. In those previous studies, the PAL was reported to be in the “low active” range (1.40-1.59).
Consistent with our expectations and results in previous reports [2526], the subjects' TEEDLW and REE were significantly higher in men than in women (P<0.001). This gender difference appears to be due to the higher body weight and higher FFM in men compared to women. As has been reported before [272829], a person's energy expenditure increases in proportion to the body weight and FFM. The higher TEEDLW and REE in men compared to women were also reported in the Observing Protein and Energy Nutrition (OPEN) study, which was conducted by Tooze et al. [30]. In their study, the DLW method was used to assess TEE in 450 subjects aged 40-69 years in the USA. Similar to our findings, their results showed that men had a higher TEEDLW than that in women (2,899±30 kg/day and 2,308±33 kg/day, respectively, P<0.0001). Their findings on REE were also similar to our results, with men having a higher REE than that in women (1,716±12 kg/day and 1,328±13 kg/day, respectively, P<0.0001). After adjusting the TEEDLW and REE for body weight, we observed no significant gender difference (P >0.05); a difference that has been reported elsewhere [25]. In contrast, women had significantly higher TEEDLW/FFM and REE/FFM than those in men. A similar reversal of gender difference in TEE after adjustment for FFM was observed in the OPEN study reported by Tooze et al. [30]. In contrast, Carpenter et al. [31] reported higher TEEDLW and resting metabolic rates (RMR) in men than in women, even after adjusting for FFM. This difference in study results could be due to the women in their study being older than the women in our study.
Studies on the measurement of TEE by applying the DLW method have been conducted in various countries [3233343536], though the number of studies is limited. Among these, we have compared our results with two studies conducted in Japan, a population that has similar ethnic characteristics to those of Koreans. A study conducted by Ishikawa-Takata et al. [32] used the DLW method to assess TEE in 226 Japanese participants aged 20-83 years. Their results showed that TEEDLW was 11.21 MJ/day (2,679.3 kcal/day) in men and 8.42 MJ/day (2,012.4 kcal/day) in women; results that are not dissimilar to our findings (2,706.0 kcal/day in men and 2,091.4 kcal/day in women). Another study using the DLW method for the measurement of TEE was performed by Ishikawa-Takata et al. [33] on 150 Japanese participants (74 males and 76 females) aged 20-59 years. Their results showed that TEEDLW was 10.78±1.67 MJ/day (2,576.5±399.1 kcal/day) in men and 8.37±1.30 MJ/day (2,000.5±310.7 kcal/day) in women; values that are comparable to our study results.
In the present study, the accuracy of the IOM DRI predictive equations for EER was assessed by comparing the EERDRI with the TEEDLW, and by analyzing the correlation between the results from the two methods. The percentage bias between EERDRI and TEEDLW was -1.3% in men and -4.9% in women, implying an acceptable level of accuracy when using the IOM DRI predictive equations for EER [12]. The criterion of a predicted value within ±10% of the measured value as the definition of an accurate prediction has been used in other validation studies for prediction equations, including a study conducted by Frankenfield et al. [13] and another by Marra et al. [14]. In the OPEN study [30], which reported the DRI predictive equations for EER to be accurate and supported their use, the percentage bias between EERDRI and TEEDLW was -7.5% in men and -5.9% in women. Similar to the tendency observed in our bias results, the equations tended to underestimate the EER.
In our study, the percentage of accurate predictions, which is defined as the percentage of subjects predicted by the DRI predictive equations within 10% of TEEDLW, was 77.1% in men and 62.9% in women. Similar results were obtained in the OPEN study [30], in which the percentage of accurate predictions was 68% in men and 64% in women, indicating that the equations' predictive accuracy is higher in men than in women. The percentage of accurate predictions observed in the present study is comparable to the results in other studies that have confirmed the accuracy of predictive equations for the estimation of energy expenditure. In a study conducted by Siervo et al. [37], which evaluated the accuracy of predictive equations for resting energy expenditure (REE) in older adults, the aggregate algorithm was confirmed to be accurate with an accurate prediction percentage of 63%. Another study reported by De la Torre et al. [25] assessed the accuracy of predictive equations for REE in healthy Puerto Rican adults. Their findings indicated the validity of the Harris-Benedict and Mifflin-St Jeor equations for the prediction of REE and reported accurate prediction percentages of 69% and 60%, respectively.
To further assess the accuracy of the IOM DRI predictive equations for EER, we performed a correlation analysis between EERDRI and TEEDLW. The results showed a strong correlation between the two methods (r=0.783, P<0.001 in men; r=0.810, P<0.001 in women), indicating the accuracy of the DRI equations. The OPEN study [30] also found the EERDRI to be highly correlated with TEEDLW with the Pearson's r of 0.93. In addition to the high correlation, we observed small RMSE values (188.1 kcal/day in men and 173.8 kcal/day in women), further indicating the accuracy of the DRI equations for EER [16]. The maximum negative error and maximum positive error also showed an acceptable range, considering the results reported elsewhere regarding the accuracy of predictive equations for determining energy expenditure [9].
A limitation of the present study is the small number of subjects. Second, the study only focused on participants aged 20-49 years, which limits its generalizability to other age groups. Nevertheless, the present study is significant as it establishes a database for energy expenditure in Koreans with the data obtained via the DLW method.
In conclusion, our findings support the use of IOM DRI prediction equations for EER in Korean adults. More studies are needed to confirm our findings and to assess the validity of DRI equations in other population groups, including children, adolescents, and older adults.

 XML Download