

 PDF
PDF ePub
ePub Citation
 Print
Print


INTRODUCTION
Overconsumption of instant noodles has recently received special attention, owing to its association with obesity and cardiometabolic syndrome among adults in South Korea [1]. The high-calorie content and the high concentration of refined carbohydrates, fats, and sodium [2] in instant noodles, contribute to an increased risk of metabolic disease [1]. Consumption of instant noodles as a staple food source is rising in many Asian countries [3] but South Korea is ranked the world's number one per capita in instant noodle consumption (72.8 servings of instant noodles per annum) [4]. A recent survey [5] reported that college students consume instant noodles more frequently than adults in other age groups because of the convenience of preparing instant noodles on school premises.
The fact that college students with unhealthy dietary habits frequently eat instant noodles and may be at increased risk of negative health outcomes should receive special attention because of a recent survey that reported an increasing trend of early premature cardiovascular diseases (CVD) death among adults as young as 20-49 years of age in Korea [6]. There is also an increasing trend in the proportion of individuals in the same group of young adults with increased cardiometabolic risk factors, such as overweight or obesity, hypertension, and elevated blood levels of glucose and lipids [7].
Many cardiometabolic risk factors are known to be modified by lifestyle behaviors including diet. Among many diet-related behaviors, avoiding instant foods and/or fast food and increasing the intake of basic and unprocessed foods, is considered a simple but pivotal strategy. Cultivation of healthy lifestyle behaviors including good dietary practices among young adults, such as college students, is crucial for health promotion and disease prevention on both an individual and national level. Among young adults, modification of undesirable dietary habits and a reduction in CVD risk factors, is becoming more important for the prevention of CVD.
Recent studies that report a positive relationship between instant noodles and obesity and cardiometabolic syndrome among Korean adults [18], have focused on the general population, including all adult age groups. Despite an increasing trend in the proportion of young Korean adults in their 20s and 30s, with elevated metabolic markers, no study, to our knowledge, has previously investigated this association, by specifically targeting young adults, such as college students [9], which are known to be the most frequent consumers of instant noodles. Therefore, the current study was conducted to investigate the association between instant noodle consumption and cardiometabolic risk factors among young college students in Korea.
SUBJECTS AND METHODS
Study subjects
A student health checkup was conducted at the health center of a university located in Seoul, Korea. A total of 3,481 students, aged 18-29 years, participated in the health checkup program from 24/04/2013–16/05/2013. Of the 3,481 subjects, 81 students who did not respond to a food questionnaire were excluded from the analysis. Three other students were excluded because they were receiving treatment for chronic disorders such as hypertension, dyslipidemia, or diabetes. In total, 3,397 subjects (1,782 male; 1,615 female) were included in the analysis. The study protocol was approved by the 2012 Seoul National Bioethics Committee and the 2013 Institutional Review Board of Seoul National University College of Medicine/Seoul National University Hospital (No. C-1304-062-481). All individuals provided informed consent to participate in the study.
General characteristics and instant noodle consumption survey
All of the students completed an online survey that ascertained demographic and socioeconomic factors, and health-related behaviors including age, height, weight, family income, alcohol consumption, smoking behavior, and physical activity. Family monthly income was classified into < $2000 USD, $2000-4000 USD, and > $4000 USD. Alcohol consumption was categorized as non-drinker, moderate drinker [weekly alcohol consumption < 14 drinks (males) or < 7 drinks (females), where 1 drink constitutes 14 g pure alcohol], and heavy drinker [weekly alcohol consumption > 14 drinks (males) or > 7 drinks (females)]. Smoking behavior was classified as non-smokers, ex-smokers, or current smokers, depending on current smoking status. Physical activity was classified as highly active (1500 MET-min/week, for any strenuous physical activity practiced > 3 d/week or 3000 MET-min/week, for any activity conducted daily), moderately active (intense physical activity for > 20 min/week or moderate activity or walking 5 d/week for > 30 min/d), or no physical activity/inactive (below a moderate level of physical activity).
Information on instant noodle consumption was obtained from the participants' answers to a question about their average frequency of instant noodle intake over the 1 year period prior to the survey. The questionnaire listed several potential candidate foods important for cardiometabolic risk in addition to instant noodles (fruits [110], vegetables [110], milk and dairy products [11], high-fat fish [112], high-fat and processed meats [113], sweets and confectionery [114], and carbonated beverages [115]), which was divided into nine frequency categories: barely eat, once/month, 2–3 times/month, 1–2 times/week, 3–4 times/week, 5–6 times/week, once/day, twice/day, and 3 times/day. Those food groups were fruits, vegetables (except Kimchi), milk and dairy products (yogurt/cheese, etc.), high-fat fish (mackerel/sardines/tuna/herring/salmon, etc.), high-fat and processed meats (fresh bacon/beef ribs/charcoal grilled meat/tripe/ham/sausage/bacon), instant noodle/cup noodle, sweets and confectionery (cakes/cookie/pies/candies/chocolates), and carbonated beverages (coke/sprite/soft drinks/fruit-flavored drinks except 100% fruit juice). In this study, the consumption of these foods as well as instant noodle was divided into 4 categories (≤ 1 time/month, 2–3 times/month, 1–2 times/week, and ≥ 3 times/week) according to frequency distribution.
Anthropometric and clinical examination
Anthropometric measurements were taken by a trained nurse. Standing height was measured to the nearest 0.1 cm with a stadiometer (BSM 330, Biospace Co. Seoul, South Korea). Body weight was measured to the nearest 0.1 kg using an Inbody 520 (Biospace Co., Ltd., Seoul, Korea). Body mass index (BMI) was calculated as weight (kg) divided by the square of the height (m2). Waist circumference was measured at the midpoint between the top of the iliac crest and the lowest rib, without any garments on. Blood pressure was taken when participants had been at rest for > 5 min, using an automatic blood pressure measurement system (CK-301, Spirit Medical Co., Taiwan). The second measured value was recorded for above-normal range blood pressure. When two preceding measurements were within the normal range, another measurement was conducted manually. Blood samples were drawn after a minimum 12-h overnight fast, collected in EDTA-containing tubes, and centrifuged at 3,000 rpm, at 4℃, for 20 min (Hanil Science Industrial Co., Ltd., Seoul, Korea). Fasting plasma levels of glucose, triglycerides, total cholesterol, and high density lipoprotein (HDL) cholesterol were assessed with an autoanalyzer (Cobas 6000, Roche Diagnostics International Ltd., Rotkreuz, Switzerland). Low density lipoprotein (LDL) cholesterol levels were calculated using the following equation, proposed by Friedwald [16] and Lauer [17]:
Definition of metabolic syndrome
Metabolic syndrome was diagnosed based on the Adult Treatment Panel III of the National Cholesterol Education Program's (NCEP ATP III) standard diagnostic criteria [18]. Central obesity was defined as an absolute waist circumference > 90 cm (males) or > 85 cm (females), based on the guidelines of the Korean Society for the Study of Obesity [19]. The criteria for metabolic syndrome were as follows: (1) abdominal obesity: waist circumference > 90 cm (males) or > 85 cm (females), (2) high blood pressure: systolic blood pressure ≥ 130 mmHg or diastolic blood pressure ≥ 85 mmHg, (3) impaired fasting glucose: fasting blood sugar ≥ 100 mg/dL, (4) high triglycerides: triglycerides ≥ 150 mg/dL, and (5) low HDL-cholesterol: < 40 mg/dL (males) or < 50 mg/dL (females). Subjects who met three or more of these criteria, were diagnosed with metabolic syndrome.
Statistical analysis
Data were expressed as the mean and standard deviations (SD) or as percentages (categorical), where appropriate. Differences in sociodemographic and behavioral characteristics among the instant noodle intake groups were analyzed using the Chi-square (χ2) test. General characteristics, such as age and BMI, were compared by one-way analysis of variance (ANOVA). The χ2 test was applied to determine differences in the distribution of the number of metabolic syndrome components, according to instant noodle consumption. Potential confounders in this study included age, BMI, gender, family income (< $2000 USD/month, $2000–4000 USD/month, > $4000 USD/month), alcohol consumption (non-drinker, moderate drinker, heavy drinker), smoking behavior (non-smoker, ex-smoker, current smoker), physical activity (low, moderate, high), and consumption frequency of fruits, vegetables, milk and dairy products, high-fat fish, high-fat and processed meats, sweets and confectionery and carbonated beverages (≤ 1 time/month, 2-3 times/month, 1-2 times/week, ≥ 3 times/week). After adjusting for these confounders, a general linear model (GLM) was constructed to examine the differences in the metabolic parameters among the instant noodle consumption groups. Multiple logistic regression analysis was also performed to estimate the odds ratios (ORs) and 95% confidence intervals (CIs) for the cardiometabolic risk factors depending on instant noodle consumption. While performing the GLM or multiple logistic regression analyses, subjects with missing data for alcohol consumption (N = 187), smoking behavior (N = 52), and physical activity (N = 103) were excluded. All statistical analyses were performed using SAS 9.4 (SAS Inc., Cary, NC, USA). The significance level was set at P < 0.05.
RESULTS
Characteristics of study participants according to the frequency of instant noodle consumption
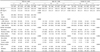
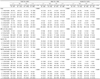
The mean age of all subjects was 22.4 ± 2.9 years, and did not differ among the instant noodle intake groups. Males were more likely to frequently consume instant noodles (≥ 3 times/week) than females. Subjects who frequently consumed instant noodles, had a lower family income level than infrequent consumers. Frequent consumers of instant noodles, drank more alcohol, were more likely to be current smokers, and were more physically active (Table 1). Frequent consumers of instant noodles also frequently consumed high-fat fish, high-fat and processed meats, sweets and confectionery, and carbonated beverages, and had less frequent consumption of fruits and vegetables (Table 2).
Metabolic parameters according to the frequency of instant noodle consumption
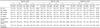
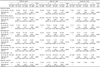
For all subjects, plasma triglyceride levels (P = 0.0016), diastolic blood pressure (P = 0.0216), and fasting blood glucose levels (P = 0.0238) were higher in the frequent instant noodle consumer group (≥ 3 times/week) than the infrequent consumer group (≤ 1 time/month) after adjusting for the covariates of age, BMI, gender, family income, alcohol consumption, smoking behavior, physical activity, and other dietary factors important for cardiometabolic risk. In female students, triglyceride levels (P = 0.0198) and diastolic blood pressure (P = 0.0167) were higher among the frequent consumers of instant noodles. In male students, triglyceride levels (P = 0.0482) were also higher among the frequent consumers (Table 3).
Association between the frequency of instant noodle consumption and cardiometabolic risk factors
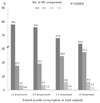
College students who consumed instant noodles frequently were more likely to have multiple cardiometabolic risk factors (Fig. 1) (P < 0.0001). The proportion of subjects with three or more risk factors was 0.8% among those who consumed instant noodles ≤ 1 time/month and 2.5% among those who consumed instant noodles ≥ 3 times/week.
As shown in Table 4, multiple logistic regression analysis with covariates revealed that frequent consumption of instant noodles was associated with a higher prevalence of hypertriglyceridemia. Compared to the group with the lowest frequency of instant noodle consumption (≤ 1 time/month), the OR for hypertriglyceridemia was significantly higher in the groups with a frequency consumption of 1-2 times/week (OR: 2.163, 95% CI: 1.229–3.805) and ≥ 3 times/week (OR: 2.693, 95% CI: 1.393–5.000) (P for trend = 0.0192) in all subjects. This association was also observed for males alone (OR: 2.149, 95% CI: 1.045–4.419) and females alone (OR: 5.992, 95% CI: 1.859–21.824), with a frequency of instant noodle consumption ≥ 3 times/week compared to ≤ 1 time/month. The OR for a high LDL-cholesterol was significantly lower in the group with a consumption frequency of 1-2 times/week (OR: 0.580, 95% CI: 0.347-0.968) compared to the group with the lowest frequency of instant noodle consumption (≤ 1 time/month) in female students only.
DISCUSSION
In this study, we found a positive association between the frequency of instant noodle consumption and plasma triglyceride levels, diastolic blood pressure, and fasting blood glucose levels in Korean college students. Study subjects with a higher frequency of instant noodle consumption were more likely to have multiple cardiometabolic risk factors. The OR for hypertriglyceridemia was significantly higher in the group that consumed instant noodles ≥ 3 times/week compared to the group with the lowest consumption frequency (≤ 1 time/month). This association existed in male and female students respectively, as well as in the combined subjects.
The positive association between instant noodle consumption and triglyceride levels that we observed among college students is supported by the results of another recent study conducted on Korean adults aged 19–64 years. Yeon & Bae [8] showed that the group with high instant noodle consumption (≥ 1 serving/week) had significantly higher triglyceride levels compared with the low instant noodle consumption group (< 1 serving/week). We also found that college students who reported consuming instant noodles ≥ 3 times/week were at a higher risk for hypertriglyceridemia. We are unable to provide a mechanistic interpretation of these findings but it is probably due to the large amounts of carbohydrates and fat contained in instant noodles. Excess carbohydrate intake is known to increase triglyceride levels [20].
In our study, diastolic but not systolic blood pressure was increased, according to the frequency of instant noodle consumption and the effect was more apparent in female students. Diastolic blood pressure is considered an index of salt sensitivity [21]. Instant noodles made in Korea contain a significant amount of sodium in one serving (600-2,770 mg) [22]. According to the Korea National Health and Nutrition Examination Survey [23], noodles are one of the main sources of sodium intake in Korea, and instant noodles comprised the largest proportion of noodles eaten by South Korean adults in their 20s. If diastolic blood pressure is an index of salt sensitivity, our data indicate a gender difference in salt sensitively, such that women may be more salt-sensitive than men. This needs to be verified though further studies.
In the present study, a positive association was observed between instant noodle consumption and fasting blood glucose levels. This observation is partially consistent with a previous report [8], which found that instant noodle consumption was associated with an increased prevalence of hyperglycemia in Korean women only. Instant noodles are generally high in refined carbohydrates but low in fiber [2]. This correlates with the high glycemic index (GI) or the high glycemic load of instant noodles. Some studies [2425] have reported that the instant noodles produced in Korea have a GI of 71–87 and instant noodles are categorized as a high-GI food.
Although there was no difference in the proportion of subjects with metabolic syndrome between groups, students with a higher frequency of instant noodle consumption were more likely to have multiple cardiometabolic risk factors. Significant differences were observed in the proportion of subjects with two risk factors (17.7 vs. 27.6%) and three or more risk factors (0.7 vs. 2.5%), and between those who consumed instant noodles ≤ 1 time/month vs. ≥ 3 times/week. Our findings suggest that instant noodle consumption might be associated with the presence of multiple risk factors, even if metabolic syndrome has not yet manifested because the study subjects consisted of relatively young individuals.
In this study, we found unexpectedly that the OR for a high LDL-cholesterol was significantly lower in female students who consumed instant noodle 1–2 times/week than ≤ 1 time/month. At this point, we do not know whether this is a chance observation or artifact, therefore, it needs to be explored further in other studies with different study subjects. Blood levels of LDL-cholesterol, a well-established cardiometabolic risk factor, however, has been reported to be influenced by both genes and the environment, with the genetic factor being stronger than environmental variables, such as diet [26]. This is one of the reasons why LDL-cholesterol level is excluded from the diagnostic criteria of metabolic syndrome.
Researchers at Harvard University reported a 68% higher risk of metabolic syndrome among women who consume instant noodles ≥ twice/week [1], but not in men. We found that frequent consumption of instant noodles was associated with increased diastolic blood pressure in women. These gender discrepancies might result from differences in food group compositions in the dietary intake patterns between males and females [2728] and the biological differences between males and females, such as sex hormones and metabolism [2729]. Previous authors suggested an interaction between bisphenol A and the estrogen receptor, as a possible contributor to the gender difference. Bisphenol A is known to be a selective modulator of estrogen receptors that can accelerate adipogenesis [30]. Considering that women may be more sensitive to instant noodle-associated metabolic changes is intriguing. Whether this is due to bisphenol A found in packaging or to other substances in instant noodles, warrants further investigation. Meanwhile, it is advisable to guide young women to minimize their instant noodle consumption to decrease future CVD metabolic risk.
Unlike fresh ramen noodles, most instant noodles are deep-fried to dry them, so they are high in calories, refined carbohydrates, saturated fat, and sodium [2]. The most consumed [9] type of instant noodles in Korea, for example, contains 505 kcal and provides 24, 31, 53, and 90% of the recommended daily values for carbohydrates, fat, saturated fat and sodium, respectively [2]. Several studies have suggested that the high energy density, glycemic load (due to the refined carbohydrates), saturated fat content, and sodium content of instant noodles, may contribute to increased cardiometabolic risk factors. South Korea leads the world in per capita consumption of instant noodles, at 72.8 servings/year, which is almost six times higher than the world average of 13.5 servings in 2015 [31], with per capita consumption showing an increasing trend [32]. The convenience and low price of instant noodles have intensified their popularity in recent decades [32]. The preference for instant noodles is particularly strong among college students, with time or financial constraints. It has been reported that among adults of all age groups, younger adults aged 20-49 years, consume greater amounts of instant noodles (22.2 g/d) than those aged 50-64 years (7.6 g/d) [33].
The limitations of this study are as follows: first, it was impossible to define causal associations with this data set because of the cross-sectional study design. Further prospective studies are warranted to investigate the causal associations between instant noodle consumption and cardiometabolic risk factors. Second, there is a possibility that those who often consumed instant noodles as a snack, also consumed more calories overall, which may have led to a higher risk of metabolic syndrome. However, a previous study [34] observed that most adults consume instant noodles at lunch or dinner time as a substitute for a meal instead of a snack. For more accurate results, controlling participants' total daily caloric intake and determining the percentage of total caloric intake fulfilled by instant noodles is necessary. Despite these limitations, this study is significant, as it presents homogeneous data collected over a short duration, which includes data on a large number of young adults. Although various studies have been conducted on unhealthy eating habits developed over a long duration in subjects or patients in their late 40s [35] regarding an increased risk of cardiometabolic syndrome, insufficient studies have been conducted to show whether the same results will be seen when investigating instant noodle intake in younger individuals.
In conclusion, we found that frequent consumption of instant noodles may be associated with increased cardiometabolic risk factors among apparently healthy college students aged 18-29 years. Considering the significant, harmful association of multiple risk factors with increased CVD risk and later development of CVD, this issue requires immediate attention. It is necessary to encourage reduced consumption of instant noodles but there is also a need to educate individuals and for the food industry to improve the nutritional quality of instant noodles or develop healthy instant noodles.
 XML Download