Journal List > Nutr Res Pract > v.11(1) > 1050874

Kang, Lee, Kim, and Han: Gelidium amansii extract ameliorates obesity by down-regulating adipogenic transcription factors in diet-induced obese mice

Abstract

BACKGROUND/OBJECTIVES

In this study, we investigated whether Gelidium amansii extract (GAE) ameliorates obesity in diet-induced obese (DIO) mice.

MATERIALS/METHODS

The mice were maintained on a high-fat diet (HD) for 5 weeks to generate the DIO mouse model. And then mice fed HD plus 0.5% (GAE1), 1% (GAE2) or 2% (GAE3) for 8 weeks.

RESULTS

After the experimental period, GAE-supplemented groups were significantly lower than the HD group in body weight gain and liver weight. GAE supplemented groups were significantly lower than the HD group in both epididymal and mesenteric adipose tissue mass. The plasma leptin level was significantly higher in the HD group than in GAE-supplemented groups. The leptin level of HD+GAE3 group was significantly lower than that of the HD+conjugated linoleic acid (CLA) group. In contrast, plasma adiponectin level of the HD group was significantly lower than those of HD+GAE2 and HD+GAE3 groups. The expression levels of adipogenic proteins such as fatty acid synthase, sterol regulatory element-binding protein-1c, peroxisome proliferator-activated receptor γ, and CCAAT/enhancer binding protein α in the GAE supplemented groups were significantly decreased than those in HD group, respectively. In addition, the expression levels of HD+GAE2 and HD+GAE3 groups are significantly decreased compared to those of HD+CLA group. On the contrary, the expression levels of hormone-sensitive lipase and phospho-AMP-activated protein kinase, proteins associated with lipolysis, were significantly increased in the GAE supplemented groups compared to those in the HD group. HD+GAE3 group showed the highest level among the GAE supplemented groups.

CONCLUSIONS

These results suggested that GAE supplementation stimulated the expressions of lipid metabolic factors and reduced weight gain in HD-fed C57BL/6J obese mice.

INTRODUCTION

Obesity is not defined by a single factor, rather it is a complex condition with multiple factors including hypertension, cardiovascular disease, insulin resistance, dyslipidemia, inflammation, and fatty liver [12]. Lipid accumulation induces the process of adipogenesis (the programmed differentiation of pre-adipocytes), which is involved in a number of stages related to obesity. Controlling adipogenesis is a potential strategy for obesity prevention because adipocyte differentiation plays a key role in fat mass growth [34]. The master adipogenic transcription regulators are CCAAT/enhancer binding protein α (C/EBP α) and peroxisome proliferator-activated receptor γ (PPARγ) [5]. These factors modulate adipogenesis-related gene expression and lipid storage in adipocytes [6]. Sterol regulatory element-binding protein (SREBP-1) also plays a role by upregulating many lipogenic genes, such as fatty acid synthase (FAS). On the contrary, hormone-sensitive lipase (HSL) [7] is the major enzymes regulating the process of lipolysis. Thus, there are many studies aimed at ameliorating obesity by focusing on reducing pre-adipocyte differentiation and proliferation, inhibiting lipogenesis, and inducing lipolysis [8].
Obesity results from a disorder of energy balance in terms of energy intake and energy expenditure [9]. To date, many different approaches have been suggested to control obesity, including drugs to suppress appetite, induce weight loss, or inhibit nutrient absorption [10]. Currently available therapeutic agent is orlistat [11]. However, orlistat causes serious adverse effects such as insomnia, asthenia, constipation, emesis, headache, and stomachache [12]. Thus, natural compounds that may be beneficial in reducing obesity have been investigated as alternatives [13].
Seaweed is rich in polyphenols, carotenoids, vitamins, phycobilins, and sulfated polysaccharides, many of which are known to have beneficial effects on human health [14]. Gelidium amansii, a well-known red alga, has been consumed since ancient times. Several studies have reported that G. amansii possesses anti-oxidative, immunomodulatory, anti-tumor, and cytotoxic effects resulting from the activity of phenolic compounds in its extract [151617]. The study was also reported that G. amansii extract showed the inhibitory effect of weight gain in mice fed a high-fat diet added with G. amansii extract for 12 weeks [18]. However, there is not any study on the effect of weight loss of G. amansii extract in obese mice that fed only a high fat diet for a few weeks. Therefore, in this study, we investigated the effects of G. amansii extract on body weight gain, fat mass, plasma and hepatic lipid profiles, adipokine secretion, and expression of lipid metabolic factors in obese C57BL/6J mice.

MATERIALS AND METHODS

Preparation of Gelidium amansii extract

Samples of G. amansii were collected in Jeju Island, Korea from May to June 2014. The plant samples were washed three times to remove salt and sand, after which they were dried at room temperature and ground into powder. The powder was extracted with 80% ethanol for 24 h at 40℃. The resulting G. amansii extract (GAE) was concentrated in a rotary vacuum evaporator (40℃) and freeze-dried into powder form for use in animal experiments. The yield of GAE was 5.6 %. The GAE was analyzed to have a total polyphenolic content of 0.26 ± 0.08 mg/ml and a total flavonoid content of 1.55 ± 0.16 mg/ml.

Animals and diets

Male, 5-week-old C57BL/6J mice (n = 48) were purchased from Jung-Ang Lab Animal Inc. (Seoul, Korea). The mice were housed in a temperature-controlled room (24℃) with a 12-h light/dark cycle. After one week of adaptation, eight mice were fed normal diet (ND) and forty mice were fed a high-fat diet (HD, providing 60 kcal% fat; Jung-Ang Lab Animal Inc.) for 5 weeks to induce obesity. Eight mice of ND supplemented group continued to be fed the normal diet and then others divided into 5 groups (n = 8) that were fed a diet of HD, HD plus 0.5, 1.0, and 2.0 g GAE/100 g diet (HD+GAE1, HD+GAE2, and HD+GAE3, respectively), and HD plus 0.75 g conjugated linoleic acid (CLA, Novarex Co., Cheongju, Chungcheongbukdo, Korea)/100 g diet (HD+CLA) for 8 weeks. During the experimental period, animals had free access to water and food, and their body weight and food intake were measured weekly. At the end of the experimental period, the mice were sacrificed with ether after fasting for 12 h, and blood samples were taken from the inferior vena cava for assessment of plasma lipid, leptin, and adiponectin levels. Thereafter, the livers, kidneys, epididymal, and mesenteric adipose tissues were collected, rinsed, weighed, and stored at −80℃. The animal handling and care procedures used in this study were in accordance with current international laws and policies (PNU Guide for the Care and Use of Laboratory Animals; PNU-20150905).

Plasma lipid, leptin and adiponectin levels

Plasma levels of total cholesterol (TC), high-density lipoprotein cholesterol (HDL-C), and triglycerides (TG) were determined using commercial assay kits (Asan Pharm., Seoul, Korea) according to the manufacturer's instructions, while low-density lipoprotein cholesterol (LDL-C) levels were calculated using the Friedewald formula: LDL-C = TC - HDL-C - (TG/5) [19].
Also, Plasma free fatty acid (FFA) was determined using commercial assay kits (NEFA kit, Wako, Japan). Plasma leptin and adiponectin levels were measured using a mouse/rat leptin quantikine enzyme-linked immunosorbent assay (ELISA) kit (R&D Systems, Minneapolis, MN, USA) and a mouse/rat high-molecular-weight adiponectin ELISA kit (Shibayagi Co. Ltd, Gumma, Japan), respectively.

Assay for hepatic lipids

Hepatic lipids were extracted using a procedure described by Folch et al. [20], and hepatic cholesterol and triglyceride concentrations were analyzed using the enzymatic kits used for the plasma analyses.

Western blot analysis

Epididymal adipose tissue and liver homogenates in lysis buffer were centrifuged at 14,000 × g (4℃, 15 min), and the protein concentrations of the resulting supernatants were measured using a protein assay kit (Bio-Rad, Hercules, CA, USA). Protein samples (30 µg) were separated on 12% sodium dodecyl sulfate-polyacrylamide gel electrophoresis (SDS-PAGE) gels. Separated proteins were transferred to nitrocellulose membranes that were blocked with 5% skim milk in Tris-buffered saline (0.1% Tween-20) for 1 h at room temperature. Blocked membranes were incubated overnight with primary antibodies against FAS, SREBP-1c, PPARγ, C/EBPα, HSL, and phospho-AMPKα (p-AMPK) (Cell Signaling Technology, Beverly, MA, USA) at 4℃. The membranes were then washed and incubated with secondary antibodies for 1 h at room temperature, after which each antigen-antibody complex was visualized using ECL Western blotting detection reagents and detected by chemiluminescence using a LAS-1000 plus analyzer (Fujifilm, Tokyo, Japan). Band densities were determined using an image analyzer (Multi Gauge V3.1; Fujifilm, Tokyo, Japan) and were normalized to β-actin levels.

Data and statistical analyses

Data are reported as mean ± standard deviation (SD) and statistical analyses were carried out using SAS software (SAS Ins-1titute, Inc., Cary, NC, USA). Differences among groups were evaluated by one-way analysis of variance (ANOVA) followed by Duncan's multiple range tests. Differences of P < 0.05 were considered statistically significant.

RESULTS

Effects of GAE supplementation on body weight, food intake, and food efficiency ratio

After inducing obesity with HD for five weeks, the body weight of HD-fed mice (29.07 ± 3.44 g) was significantly higher than that of ND-fed mice (24.70 ± 0.95 g) (Fig. 1). To determine whether GAE supplementation for eight weeks has a regulatory effect on obesity, the body weights of the animals were measured (Table 1). Body weight gains of HD, HD+GAE1, HD+GAE2, HD+GAE3, and HD+CLA groups were 12.48 ± 2.42, 8.30 ± 2.90, 3.93 ± 1.44, 3.18 ± 1.79 and 4.35 ± 2.23 g for 8 weeks, respectively. The weight gains of GAE-supplemented groups were significantly lower than that in the HD group after the 8 weeks. Among the GAE-supplemented groups, HD+GAE2 and HD+GAE3 showed significantly lower body weight gain than HD+GAE1. Gains in body weight of mice in the HD+GAE2 and HD+GAE3 groups were not significant with the HD+CLA group.
Food intakes of the HD, HD+GAE1, HD+GAE2, HD+GAE3, and HD+CLA groups were 2.45 ± 0.17, 2.49 ± 0.52, 2.39 ± 0.26, 2.33 ± 0.21, and 2.39 ± 0.29 g/day, respectively. The difference among them was not significant. Food efficiency ratio (FER) of the HD, HD+GAE1, HD+GAE2, HD+GAE3, and HD+CLA groups were 9.10 ± 0.42, 5.96 ± 0.24, 2.84 ± 0.32, 2.44 ± 0.37 and 3.25 ± 0.27, respectively. The FER of GAE-supplemented groups showed significantly lower than that of HD group. HD+GAE3 group was significantly the lowest among the GAE-supplemented groups.

Effects of GAE supplementation on liver, kidney, and adipose tissue mass

Liver weights of the of the HD, HD+GAE1, HD+GAE2, HD+GAE3, and HD+CLA groups were 1.35 ± 0.02, 1.16 ± 0.07, 0.96 ± 0.02, 0.95 ± 0.01 and 1.17 ± 0.03 g, respectively. The liver weights of GAE supplemented groups were significantly lower than that in the HD group. In particular, the liver weights in the HD+GAE2 and HD+GAE3 groups were significantly lower than those in the HD+GAE1 and HD+CLA group (Table 2). In addition, epididymal adipose tissue of the HD, HD+GAE1, HD+GAE2, HD+GAE3, and HD+CLA groups were 2.04 ± 1.00, 1.86 ± 0.56, 1.28 ± 038, 1.30 ± 0.14 and 1.37 ± 0.15 g, respectively. Mesenteric adipose tissue mass of the HD, HD+GAE1, HD+GAE2, HD+GAE3, and HD+CLA groups were 0.94 ± 0.38, 0.93 ± 0.45, 0.67 ± 0.30, 0.67 ± 0.12 and 0.61 ± 0.22 g, respectively. HD+ GAE2 and HD+GAE3 groups were significantly lower than HD group in both epididymal and mesenteric adipose tissue mass. Also, the adipose tissue masses of the HD+GAE2 and HD+GAE3 were similar to those of HD+CLA group.

Effects of GAE supplementation on plasma and hepatic lipid levels

The effects of GAE supplementation on plasma and hepatic lipid levels were also examined. Compared with the GAE-supplemented groups, the HD group exhibited higher levels of TG, TC, LDL-C, and FFA but lower level of HDL-C (Table 3). TG, TC, LDL-C, and FFA levels of HD+GAE2 were 199.73 ± 10.71, 249.79 ± 3.40, 164.58 ± 4.92, and 0.61 ± 0.14 mg/dL, respectively. Those of HD+GAE3 were 187.55 ± 4.91, 241.50 ± 2.52, 156.77 ± 3.82, and 0.61 ± 0.15 mg/dL, respectively. TG, TC, LDL-C, and FFA levels of HD+GAE2 and HD+GAE3 groups were significantly decreased compared with those of HD group which were 232.57 ± 5.78, 267.89 ± 3.06, 189.48 ± 4.38, and 1.22 ± 0.30 mg/dL, respectively. Furthermore, HDL-C levels of the HD, HD+GAE1, HD+GAE2, HD+GAE3, and HD+CLA groups were 31.90 ± 4.63, 39.08 ± 2.80, 45.26 ± 2.37, 47.22 ± 2.89 and 47.45 ± 3.53 mg/dL, respectively. The level of HD+GAE3 was the highest among the GAE groups and was similar with HD+CLA group.
The hepatic TC and TG levels of HD-fed mice were significantly increased compared with those of mice fed with ND. On the other hand, hepatic TG and TC levels of HD+GAE2, HD+GAE3 groups were significantly lower than those of HD group and HD+CLA group. The TG level of HD, HD+GAE1, HD+GAE2, HD+GAE3, and HD+CLA groups were 38.32 ± 2.14, 31.56 ± 0.99, 22.06 ± 1.12, 21.32 ± 0.87 and 33.21 ± 0.36 mg/g tissue, respectively. TC levels of HD, HD+GAE1, HD+GAE2, HD+GAE3, and HD+CLA groups were 15.32 ± 1.68, 14.17 ± 1.42, 11.02 ± 2.12, 9.87 ± 0.95 and 13.91 ± 2.26 mg/g tissue, respectively. The TC level of HD+GAE3 group was significantly the lowest among the groups.

Effects of GAE supplementation on plasma leptin and adiponectin levels

The plasma leptin level was significantly higher in the HD group (62.88 ± 1.49 ng/mL) than in both ND and GAE-supplemented groups (Fig. 2A). Among the GAE supplemented groups, the leptin level of HD+GAE3 group exhibited the lowest level. In addition, the plasma leptin level of the HD+GAE3 group (13.29 ± 0.58 ng/mL) was also significantly lower than that of the HD+CLA group (16.02 ± 0.92 ng/mL). In contrast, plasma adiponectin level of the HD group (5.99 ± 0.30 µg/mL) was significantly lower than those of HD+GAE2 (7.96 ± 0.19 µg/mL) and HD+GAE3 (8.08 ± 0.14 µg/mL) groups. Also, the levels of HD+GAE2 and HD+GAE3 group were significantly higher than that of the HD+CLA group (7.52 ± 0.38 ng/mL) (Fig. 2B).

Effects of GAE supplementation on FAS, SREBP-1c, PPARγ, C/EBPα, HSL, and pAMPK expression

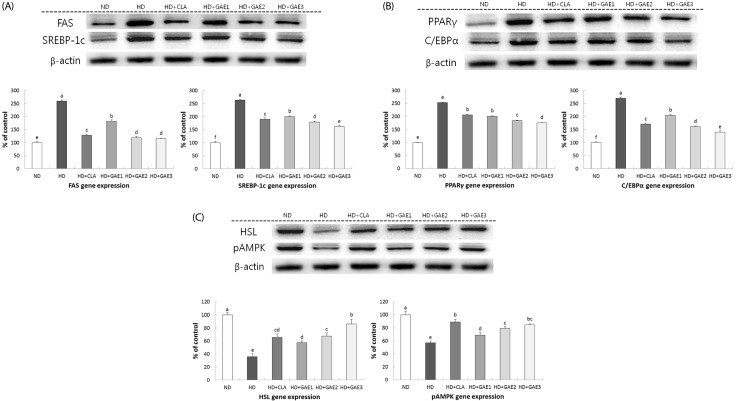
The expression levels of SREBP-1c, PPARγ, C/EBPα, and HSL in the adipose tissue, and FAS and pAMPK in the liver were analyzed along with that of their genes to investigate effect of GAE on mice. The expression levels of FAS, SREBP-1c, PPARγ, and C/EBPα in the GAE supplemented groups were significantly decreased than those in HD group, respectively (Fig. 3A and 3B). Especially, the expression levels of the genes in the HD+GAE2 and HD+GAE3 groups were significantly decreased compared to those of HD+CLA group. Among the GAE supplemented groups, the levels of SREBP-1c, PPARγ, C/EBPα in HD+GAE3 group were significantly lower than those of HD+GAE1 and HD+GAE2 groups. The results showed that GAE supplementation significantly reduced the expression levels of the adipogenesis-related genes.
On the contrary, the expression levels of HSL and pAMPK, proteins associated with lipolysis, were significantly increased in the GAE supplemented groups compared to those in the HD group. HD+GAE3 group showed the highest expression levels of HSL and pAMPK, among the GAE supplemented groups.

DISCUSSION

This study is aimed at investigating the anti-obesity effects of GAE in diet-induced obesity (DIO) mice model. Obesity is caused by an energy imbalance between energy intake and expenditure [21]. Weight gain and FER in the all GAE supplemented groups were significantly lower than those in the HD group when measured after 13 weeks. These results are consistent with previous studies [18]. In previous study, G. amansii extract showed the inhibitory effect of weight gain in C57BL/6J mice fed a high-fat diet added with G. amansii extract for 12 weeks. These studies indicated that GAE supplementation suppressed the weight gain in both DIO model obese mice and C57BL/6J mice fed a high-fat diet. However, DIO model obese mice inhibited weight gains when they fed high fat diet added with 1% of G. amansii extract, whereas C57BL/6J mice inhibited weight gains when they fed high fat diet added with 3% of G. amansii extract. These results suggested that inhibition effects of weight gain may be appeared in lower concentration of G. amansii extract supplementation in obese mice such as DIO model mice than that in C57BL/6J mice. The reduction of epididymal and mesenteric adipose tissue mass of the HD+GAE2 and HD+GAE3 groups are significantly lower than those of HD group. Also, the adipose tissue masses of the HD+GAE2 and HD+GAE3 were similar to those of HD+CLA group. The reduction of weight gain in GAE-supplemented groups might be due to reduced epididymal and mesenteric fat mass; it was previously reported that reduced body weight gain can be associated with reduced fat mass [22]. In addition, Seo et al. [23] reported that GAE inhibited lipid accumulation in 3T3-L1 adipocytes.
Plasma levels of TG, TC, and LDL-C, considered as the main risk factors for dyslipidemia, were related to accumulation of fat in the abdominal viscera [24] and cardiovascular diseases [25]. Plasma TG, TC and LDL-C levels were significantly lower in the GAE-supplemented groups than in the HD group, while the opposite is true for HDL-C levels. Especially, HD+GAE3 group was the lowest among the GAE groups and was similar with HD+CLA group in TG, TC and LDL levels. Hepatic TG and TC levels exhibited similar tendencies to those in the plasma. HD+GAE2 and HD+GAE3 groups were significantly lower than HD and HD+CLA groups in hepatic TG and TC levels. TG is synthesized in the liver and released into the blood as very low-density lipoprotein (VLDL) before being transported to the adipose tissue [26]. GAE supplementation improved lipid profile levels in the plasma and liver, which may be associated with reduced body weight and adipose tissue weight. Bioactive compounds such as polyphenols and flavonoids possess antioxidant and cholesterol-lowering activities [27]. It was reported that seaweed extract containing polyphenols and flavonoids inhibited adipocyte differentiation and lipid accumulation [28]. The GAE used in this study contained 260 µg/mL of polyphenols and 1,550 µg/mL of flavonoids. Thus, it is possible that the effects of GAE on reducing adipose tissue weight and improving lipid profile levels in the plasma and liver originated from the actions of polyphenols and flavonoids contained in GAE.
Adipokines are proteins involved in cell signaling that are secreted by fat cells and have profound effects on obesity [29]. Leptin, a type of adipokine, is one of the main regulators of fat metabolism and is associated with triglyceride accumulation in adipocytes [30]. Leptin levels are positively correlated with weight gain. Moreover, leptin levels increase in response to high calorie and decrease proportionally to reduction in adipose tissue mass [3132]. In this study, leptin levels significantly decreased in GAE supplemented groups compared with the HD group. The plasma leptin level of HD+GAE3 group was significantly lower than those of the HD+GAE1, HD+GAE2 and HD+CLA groups. These findings suggest that GAE may decrease leptin secretion by reducing adipose tissue weight. Adiponectin, another adipokine secreted by fat cells, is a protein hormone related to insulin sensitivity and fatty acid catabolism that induces the activation of AMPK [33]. Plasma adiponectin levels are known to have an inverse correlation with obesity, diabetes, and atherosclerosis [34]; adiponectin tends to be secreted more in healthy animals and less in obese animals [35]. In the current study, adiponectin levels in HD+GAE2 and HD+GAE3 mice were significantly higher than that of the HD group mice. Also, the levels of HD+GAE2 and HD+GAE3 group were higher than that of the HD+CLA group. Increase in adiponectin level is related to weight loss [36]. Thus, increase in the level of this protein in HD+GAE mice may be due to weight loss of the mice when their diet was supplemented with GAE. Taken together, the present findings suggest that GAE supplementation could lower adipose tissue weight and body weight, thereby regulating plasma adipokine levels in obese mice.
Lipogenic transcriptional genes including PPARγ, C/EBPα, and SREBP-1c have an important role in the lipid metabolism of adipocytes during adipogenesis [37]. A key transcription gene in adipocyte differentiation and lipid storage [38], PPARγ induces adipogenesis by binding to the C/EBPα promoter region that stimulates the expression of C/EBPα [39]. Both C/EBPα and PPARγ are critical transcriptional factors in adipocyte differentiation and promotion of lipid storage [40]. Another transcription factor that PPARγ interacts with is SREBP-1c, which induces the production of lipophilic molecules that increase the activity of PPARγ [41]. In addition, PPARγ and SREBP-1c play key roles in regulating the expression of FAS, the enzyme involved in the rate-limiting step of fatty acid synthesis [42]. In our study, the expressions of adipogenesis-related genes such as PPARγ, C/EBPα, SREBP-1c, and FAS were significantly decreased in the HD+GAE groups compared with the HD group, indicating that GAE supplementation was effective in reducing the expressions of these genes. Among the GAE supplemented groups, the levels of SREBP-1c, PPARγ, C/EBPα in HD+GAE3 group were significantly lower than those in HD+GAE1, HD+GAE2 and HD+CLA groups. Kang et al. [18] reported GAE inhibits adipocyte differentiation and lipid accumulation in 3T3-L1 adipocytes. Furthermore, it has been also reported that polyphenolic compounds in natural products may regulate signaling pathways that involve PPARγ, C/EBPα, and SREBP-1c [43]. Plant-derived polyphenols such as flavonoids exert their anti-obesity effects by interacting with fat mass and obesity-associated genes [44]. Seaweeds are also known to be a rich source of phenolic compounds with various important biological activities such as phlorotannins. It was recently reported that treatment with phlorotannins results in decreased adipogenesis and decreased lipogenesis in 3T3-L1 preadipocytes [45]. The GAE in this study was analyzed to contain polyphenols and flavonoids. These compound classes may therefore be responsible for the anti-obesity effect of GAE observed in this study, suggesting that GAE contains relatively enriched anti-obesity polyphenol compounds. Based on these results, the reduction of adipogenesis-related gene expression in HD+GAE group mice may be also attributed to polyphenols and flavonoids contained in GAE.
A major role of AMPK is to regulate the lipid biosynthesis pathway and energy metabolism in adipocytes [46] Its activation suppresses the expression of PPARγ and FAS during adipogenesis [47] Furthermore, AMPK stimulates mitochondrial fatty acid oxidation and adipocyte lipolysis [48]. It is also activated by adiponectin, which provides the mechanistic link between adiponectin levels and fatty acid oxidation [47]. The expression of HSL is maintained in the face of AMPK activation in the adipose tissue [49]. It is a key lipase that degrades triglycerides by splitting the ester bonds, thus controlling the lipolysis pathway in adipose tissue [50]. This study showed that pAMPK and HSL expressions in the HD+GAE groups were significantly higher than those in the HD group. These results indicate that GAE inhibits hepatic lipid accumulation through the activation of AMPK, thereby suppressing the lipogenic enzymes and increasing hepatic fatty acid oxidation. In addition, GAE elevated HSL expression and decreased lipid accumulation by stimulating lipolysis. Among the GAE supplemented groups, HD+GAE3 group showed the highest levels in pAMPK and HSL expressions. Especially, the level of HSL in HD+GAE3 group was significantly higher than that in HD+CLA group. Polyphenols such as flavonoids have been reported to inhibit adipocyte differentiation by activating AMPK [51], and may therefore be responsible for the anti-obesity effects of GAE observed in this study.
In conclusion, this study demonstrated that GAE ameliorates obesity by inhibiting adipogenesis in HD-fed obese mice. The results showed that GAE supplementation significantly decreased body weight gain, adipose tissue mass, leptin concentration, and the levels of TG and TC in the plasma and liver. Furthermore, GAE was also shown to decrease the expression levels of the adipogenic transcription factors SREBP-1c, FAS, PPARγ, and C/EBPα, and increase pAMPK expression. Therefore, GAE has the potential to be developed as a source of anti-obesity therapeutic agents.

Notes

This research was a part of the project titled “Development of an Individual Case-Authorized Functional new Biomaterial from Marine organism resources, 2013300911”, funded by the Ministry of Oceans and Fisheries, Korea.

CONFLICTS OF INTEREST: The authors declare no potential conflicts of interests.

References

1. Nieves JW, Komar L, Cosman F, Lindsay R. Calcium potentiates the effect of estrogen and calcitonin on bone mass: review and analysis. Am J Clin Nutr. 1998; 67:18–24. PMID: 9440370.
crossref
2. Kopelman PG. Obesity as a medical problem. Nature. 2000; 404:635–643. PMID: 10766250.
crossref
3. Wang T, Wang Y, Kontani Y, Kobayashi Y, Sato Y, Mori N, Yamashita H. Evodiamine improves diet-induced obesity in a uncoupling protein-1-independent manner: involvement of antiadipogenic mechanism and extracellularly regulated kinase/mitogen-activated protein kinase signaling. Endocrinology. 2008; 149:358–366. PMID: 17884939.
crossref
4. Choi H, Eo H, Park K, Jin M, Park EJ, Kim SH, Park JE, Kim S. A water-soluble extract from Cucurbita moschata shows anti-obesity effects by controlling lipid metabolism in a high fat diet-induced obesity mouse model. Biochem Biophys Res Commun. 2007; 359:419–425. PMID: 17548058.
5. Giri S, Rattan R, Haq E, Khan M, Yasmin R, Won JS, Key L, Singh AK, Singh I. AICAR inhibits adipocyte differentiation in 3T3L1 and restores metabolic alterations in diet-induced obesity mice model. Nutr Metab (Lond). 2006; 3:31. PMID: 16901342.
crossref
6. Rosen ED, Walkey CJ, Puigserver P, Spiegelman BM. Transcriptional regulation of adipogenesis. Genes Dev. 2000; 14:1293–1307. PMID: 10837022.
crossref
7. Sztalryd C, Kraemer FB. Regulation of hormone-sensitive lipase in streptozotocin-induced diabetic rats. Metabolism. 1995; 44:1391–1396. PMID: 7476323.
crossref
8. Lefterova MI, Lazar MA. New developments in adipogenesis. Trends Endocrinol Metab. 2009; 20:107–114. PMID: 19269847.
crossref
9. Wasan KM, Looije NA. Emerging pharmacological approaches to the treatment of obesity. J Pharm Pharm Sci. 2005; 8:259–271. PMID: 16124937.
10. Lee YS, Cha BY, Saito K, Choi SS, Wang XX, Choi BK, Yonezawa T, Teruya T, Nagai K, Woo JT. Effects of a Citrus depressa Hayata (shiikuwasa) extract on obesity in high-fat diet-induced obese mice. Phytomedicine. 2011; 18:648–654. PMID: 21216135.
crossref
11. Hofbauer KG, Nicholson JR. Pharmacotherapy of obesity. Exp Clin Endocrinol Diabetes. 2006; 114:475–484. PMID: 17115344.
crossref
12. Bray GA. Medical therapy for obesity. Mt Sinai J Med. 2010; 77:407–417. PMID: 20960545.
crossref
13. Choi KM, Lee YS, Shin DM, Lee S, Yoo KS, Lee MK, Lee JH, Kim SY, Lee YM, Hong JT, Yun YP, Yoo HS. Green tomato extract attenuates high-fat-diet-induced obesity through activation of the AMPK pathway in C57BL/6 mice. J Nutr Biochem. 2013; 24:335–342. PMID: 22974972.
crossref
14. Kadam SU, Prabhasankar P. Marine foods as functional ingredients in bakery and pasta products. Food Res Int. 2010; 43:1975–1980.
crossref
15. Yan X, Nagata T, Fan X. Antioxidative activities in some common seaweeds. Plant Foods Hum Nutr. 1998; 52:253–262. PMID: 9950086.
16. Fu YW, Hou WY, Yeh ST, Li CH, Chen JC. The immunostimulatory effects of hot-water extract of Gelidium amansii via immersion, injection and dietary administrations on white shrimp Litopenaeus vannamei and its resistance against Vibrio alginolyticus. Fish Shellfish Immunol. 2007; 22:673–685. PMID: 17194604.
crossref
17. Yuan H, Song J, Li X, Li N, Dai J. Immunomodulation and antitumor activity of kappa-carrageenan oligosaccharides. Cancer Lett. 2006; 243:228–234. PMID: 16410037.
18. Kang MC, Kang N, Kim SY, Lima IS, Ko SC, Kim YT, Kim YB, Jeung HD, Choi KS, Jeon YJ. Popular edible seaweed, Gelidium amansii prevents against diet-induced obesity. Food Chem Toxicol. 2016; 90:181–187. PMID: 26911551.
crossref
19. Friedewald WT, Levy RI, Fredrickson DS. Estimation of the concentration of low-density lipoprotein cholesterol in plasma, without use of the preparative ultracentrifuge. Clin Chem. 1972; 18:499–502. PMID: 4337382.
crossref
20. Folch J, Lees M, Sloane Stanley GH. A simple method for the isolation and purification of total lipides from animal tissues. J Biol Chem. 1957; 226:497–509. PMID: 13428781.
crossref
21. Yamashita Y, Okabe M, Natsume M, Ashida H. Prevention mechanisms of glucose intolerance and obesity by cacao liquor procyanidin extract in high-fat diet-fed C57BL/6 mice. Arch Biochem Biophys. 2012; 527:95–104. PMID: 22465028.
crossref
22. Lee J, Chae K, Ha J, Park BY, Lee HS, Jeong S, Kim MY, Yoon M. Regulation of obesity and lipid disorders by herbal extracts from Morus alba, Melissa officinalis, and Artemisia capillaris in high-fat diet-induced obese mice. J Ethnopharmacol. 2008; 115:263–270. PMID: 18023310.
crossref
23. Seo MJ, Lee OH, Choi HS, Lee BY. Extract from edible red seaweed (Gelidium amansii) inhibits lipid accumulation and ROS production during differentiation in 3T3-L1 cells. Prev Nutr Food Sci. 2012; 17:129–135. PMID: 24471074.
crossref
24. Hokanson JE, Austin MA. Plasma triglyceride level is a risk factor for cardiovascular disease independent of high-density lipoprotein cholesterol level: a meta-analysis of population-based prospective studies. J Cardiovasc Risk. 1996; 3:213–219. PMID: 8836866.
crossref
25. Miller M, Stone NJ, Ballantyne C, Bittner V, Criqui MH, Ginsberg HN, Goldberg AC, Howard WJ, Jacobson MS, Kris-Etherton PM, Lennie TA, Levi M, Mazzone T, Pennathur S. American Heart Association Clinical Lipidology, Thrombosis, and Prevention Committee of the Council on Nutrition, Physical Activity, and Metabolism. Council on Arteriosclerosis, Thrombosis and Vascular Biology; Council on Cardiovascular Nursing. Council on the Kidney in Cardiovascular Disease. Triglycerides and cardiovascular disease: a scientific statement from the American Heart Association. Circulation. 2011; 123:2292–2333. PMID: 21502576.
26. den Boer M, Voshol PJ, Kuipers F, Havekes LM, Romijn JA. Hepatic steatosis: a mediator of the metabolic syndrome. Lessons from animal models. Arterioscler Thromb Vasc Biol. 2004; 24:644–649. PMID: 14715643.
crossref
27. Ferri M, Bin S, Vallini V, Fava F, Michelini E, Roda A, Minnucci G, Bucchi G, Tassoni A. Recovery of polyphenols from red grape pomace and assessment of their antioxidant and anti-cholesterol activities. N Biotechnol. 2016; 33:338–344. PMID: 26705904.
crossref
28. He ML, Wang Y, You JS, Mir PS, McAllister TA. Effect of a seaweed extract on fatty acid accumulation and glycerol-3-phosphate dehydrogenase activity in 3T3-L1 adipocytes. Lipids. 2009; 44:125–132. PMID: 18982374.
crossref
29. Körner A, Blüher S, Kapellen T, Garten A, Klammt J, Kratzsch J, Kiess W. Obesity in childhood and adolescence: a review in the interface between adipocyte physiology and clinical challenges. Hormones (Athens). 2005; 4:189–199. PMID: 16613817.
crossref
30. Staiger H, Tschritter O, Machann J, Thamer C, Fritsche A, Maerker E, Schick F, Häring HU, Stumvoll M. Relationship of serum adiponectin and leptin concentrations with body fat distribution in humans. Obes Res. 2003; 11:368–372. PMID: 12634431.
crossref
31. Jéquier E. Leptin signaling, adiposity, and energy balance. Ann N Y Acad Sci. 2002; 967:379–388. PMID: 12079865.
32. Lee Y, Wang MY, Kakuma T, Wang ZW, Babcock E, McCorkle K, Higa M, Zhou YT, Unger RH. Liporegulation in diet-induced obesity. The antisteatotic role of hyperleptinemia. J Biol Chem. 2001; 276:5629–5635. PMID: 11096093.
33. Wu X, Motoshima H, Mahadev K, Stalker TJ, Scalia R, Goldstein BJ. Involvement of AMP-activated protein kinase in glucose uptake stimulated by the globular domain of adiponectin in primary rat adipocytes. Diabetes. 2003; 52:1355–1363. PMID: 12765944.
crossref
34. Hu E, Liang P, Spiegelman BM. AdipoQ is a novel adipose-specific gene dysregulated in obesity. J Biol Chem. 1996; 271:10697–10703. PMID: 8631877.
crossref
35. Siegrist M, Rank M, Wolfarth B, Langhof H, Haller B, Koenig W, Halle M. Leptin, adiponectin, and short-term and long-term weight loss after a lifestyle intervention in obese children. Nutrition. 2013; 29:851–857. PMID: 23422541.
crossref
36. Bruun JM, Lihn AS, Verdich C, Pedersen SB, Toubro S, Astrup A, Richelsen B. Regulation of adiponectin by adipose tissue-derived cytokines: in vivo and in vitro investigations in humans. Am J Physiol Endocrinol Metab. 2003; 285:E527–E533. PMID: 12736161.
37. Park J, Rho HK, Kim KH, Choe SS, Lee YS, Kim JB. Overexpression of glucose-6-phosphate dehydrogenase is associated with lipid dysregulation and insulin resistance in obesity. Mol Cell Biol. 2005; 25:5146–5157. PMID: 15923630.
crossref
38. Schoonjans K, Staels B, Auwerx J. The peroxisome proliferator activated receptors (PPARS) and their effects on lipid metabolism and adipocyte differentiation. Biochim Biophys Acta. 1996; 1302:93–109. PMID: 8695669.
crossref
39. Rosen ED, Hsu CH, Wang X, Sakai S, Freeman MW, Gonzalez FJ, Spiegelman BM. C/EBPalpha induces adipogenesis through PPARgamma: a unified pathway. Genes Dev. 2002; 16:22–26. PMID: 11782441.
40. Kamei R, Kitagawa Y, Kadokura M, Hattori F, Hazeki O, Ebina Y, Nishihara T, Oikawa S. Shikonin stimulates glucose uptake in 3T3-L1 adipocytes via an insulin-independent tyrosine kinase pathway. Biochem Biophys Res Commun. 2002; 292:642–651. PMID: 11922615.
crossref
41. Kim JB, Wright HM, Wright M, Spiegelman BM. ADD1/SREBP1 activates PPARgamma through the production of endogenous ligand. Proc Natl Acad Sci U S A. 1998; 95:4333–4337. PMID: 9539737.
42. Evans RM, Barish GD, Wang YX. PPARs and the complex journey to obesity. Nat Med. 2004; 10:355–361. PMID: 15057233.
crossref
43. Wang S, Moustaid-Moussa N, Chen L, Mo H, Shastri A, Su R, Bapat P, Kwun I, Shen CL. Novel insights of dietary polyphenols and obesity. J Nutr Biochem. 2014; 25:1–18. PMID: 24314860.
crossref
44. Mohammed A, Al-Numair KS, Balakrishnan A. Docking studies on the interaction of flavonoids with fat mass and obesity associated protein. Pak J Pharm Sci. 2015; 28:1647–1653. PMID: 26408884.
45. Zhang BB, Zhou G, Li C. AMPK: an emerging drug target for diabetes and the metabolic syndrome. Cell Metab. 2009; 9:407–416. PMID: 19416711.
crossref
46. Jung HA, Jung HJ, Jeong HY, Kwon HJ, Ali MY, Choi JS. Phlorotannins isolated from the edible brown alga Ecklonia stolonifera exert anti-adipogenic activity on 3T3-L1 adipocytes by downregulating C/EBPα and PPARγ. Fitoterapia. 2014; 92:260–269. PMID: 24334103.
crossref
47. Vingtdeux V, Chandakkar P, Zhao H, Davies P, Marambaud P. Small-molecule activators of AMP-activated protein kinase (AMPK), RSVA314 and RSVA405, inhibit adipogenesis. Mol Med. 2011; 17:1022–1030. PMID: 21647536.
crossref
48. Hardie DG. AMPK: a key regulator of energy balance in the single cell and the whole organism. Int J Obes (Lond). 2008; 32(Suppl 4):S7–S12. PMID: 18719601.
crossref
49. Watt MJ, Holmes AG, Pinnamaneni SK, Garnham AP, Steinberg GR, Kemp BE, Febbraio MA. Regulation of HSL serine phosphorylation in skeletal muscle and adipose tissue. Am J Physiol Endocrinol Metab. 2006; 290:E500–E508. PMID: 16188906.
crossref
50. Bezaire V, Mairal A, Ribet C, Lefort C, Girousse A, Jocken J, Laurencikiene J, Anesia R, Rodriguez AM, Ryden M, Stenson BM, Dani C, Ailhaud G, Arner P, Langin D. Contribution of adipose triglyceride lipase and hormone-sensitive lipase to lipolysis in hMADS adipocytes. J Biol Chem. 2009; 284:18282–18291. PMID: 19433586.
crossref
51. Son Y, Nam JS, Jang MK, Jung IA, Cho SI, Jung MH. Antiobesity activity of Vigna nakashimae extract in high-fat diet-induced obesity. Biosci Biotechnol Biochem. 2013; 77:332–338. PMID: 23391927.
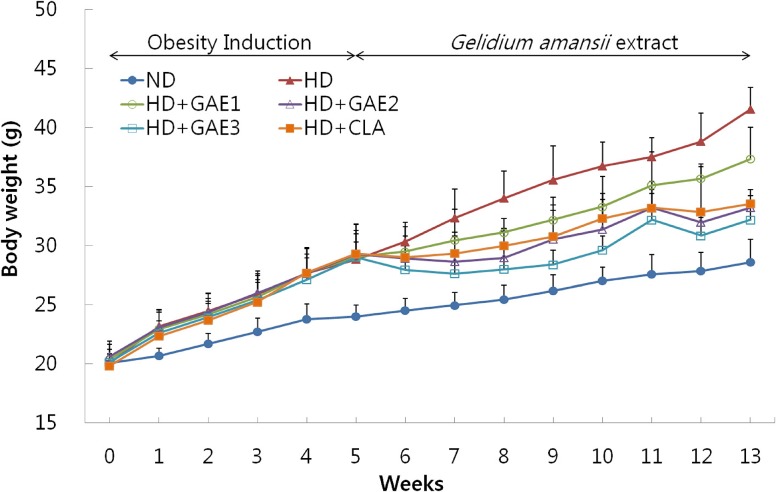
Fig. 1

Changes in body weight of C57BL/6J mice fed with experimental diets for 13 weeks.

After one week of adaptation, eight mice were fed normal diet and forty mice received a high-fat diet for 5 weeks to induce obesity. The mice were divided into 6 groups that were fed with specific diets for a period of 8 weeks. ND, normal diet-fed mice; HD, high-fat diet-fed mice; HD+GAE1, high-fat diet plus GAE (0.5 g/100 g diet)-fed mice; HD+GAE2, high-fat diet plus GAE (1 g/100 g diet)-fed mice; HD+GAE3, high-fat diet plus GAE (2 g/100 g diet)-fed mice; HD+CLA, high-fat diet plus CLA (0.75 g/100 g diet)-fed mice. Values represent the mean ± SD (n = 8).
nrp-11-17-g001
Fig. 2

Effects of GAE supplementation on plasma leptin and adiponectin levels

ND, normal diet-fed mice; HD, high-fat diet-fed mice; HD+CLA, high-fat diet plus CLA (0.75 g/100 g diet)-fed mice; HD+GAE1, high-fat diet plus GAE (0.5 g/100 g diet)-fedmice; HD+GAE2, high-fat diet plus GAE (1 g/100 g diet)-fed mice; HD+GAE3, high-fat diet plus GAE (2 g/100 g diet)-fed mice. Values represent the mean ± SD (n = 8). a-f Values denoted by different letters are significantly different among groups (P < 0.05).
nrp-11-17-g002
Fig. 3

Effects of GAE supplementation on FAS, SREBP-1c, PPARγ, C/EBPα, HSL, and pAMPK expressions.

Western blot signal intensities were determined by densitometric analysis using Multi Gauge V3.1 software. Representative blots of FAS, SREBP-1c, PPARγ, C/EBPα, HSL, and pAMPK protein expression are shown with protein expression levels quantified relative to the expression level observed in the ND group. ND, normal diet-fed mice; HD, high-fat diet-fed mice; HD+CLA, high-fat diet plus CLA (0.75 g/100 g diet)-fed mice; HD+GAE1, high-fat diet plus GAE (0.5 g/100 g diet)-fedmice; HD+GAE2, high-fat diet plus GAE (1 g/100 g diet)-fed mice; HD+GAE3, high-fat diet plus GAE (2 g/100 g diet)-fed mice. Values represent mean ± SD of experiments performed in triplicate. a-f Values denoted by different letters differ significantly (P < 0.5) among one another (Duncan's multiple range test).
nrp-11-17-g003
Table 1

Effects of GAE supplementation on body weight gain, food intake, and food efficiency ratio

nrp-11-17-i001

1) Values represent the mean ± SD (n = 8).

2) a-d Values denoted by different letters are significantly different among groups (P < 0.05).

3) NS: not significant.

4) FER: Food efficiency ratio = [weight gain (g)] / [total food intake (g)] × 100.

ND, normal diet-fed mice; HD, high-fat diet-fed mice; HD+CLA, high-fat diet plus CLA (0.75 g/100 g diet)-fed mice; HD+GAE1, high-fat diet plus GAE (0.5 g/100 g diet)-fed mice; HD+GAE2, high-fat diet plus GAE (1 g/100 g diet)-fed mice; HD+GAE3, high-fat diet plus GAE (2 g/100 g diet)-fed mice.

Table 2

Effects of GAE supplementation on liver, kidney, and adipose tissue mass

nrp-11-17-i002

1) Values represent the mean ± SD (n = 8).

2) a-d Values denoted by different letters are significantly different among groups (P < 0.05).

3) NS: not significant.

4) AT: adipose tissue.

ND, normal diet-fed mice; HD, high-fat diet-fed mice; HD+CLA, high-fat diet plus CLA (0.75 g/100 g diet)-fed mice; HD+GAE1, high-fat diet plus GAE (0.5 g/100 g diet)-fed mice; HD+GAE2, high-fat diet plus GAE (1 g/100 g diet)-fed mice; HD+GAE3, high-fat diet plus GAE (2 g/100 g diet)-fed mice.

Table 3

Effects of GAE supplementation on plasma and hepatic lipid levels

nrp-11-17-i003

1) Values represent the mean ± SD (n = 8).

2) a-d Values denoted by different letters are significantly different among groups (P < 0.05).

3) FFA: free fatty acid.

ND, normal diet-fed mice; HD, high-fat diet-fed mice; HD+CLA, high-fat diet plus CLA (0.75 g/100 g diet)-fed mice; HD+GAE1, high-fat diet plus GAE (0.5 g/100 g diet)-fed mice; HD+GAE2, high-fat diet plus GAE (1 g/100 g diet)-fed mice; HD+GAE3, high-fat diet plus GAE (2 g/100 g diet)-fed mice. Values represent the mean ± SD (n = 8).

TOOLS
Similar articles