

 PDF
PDF ePub
ePub Citation
 Print
Print


INTRODUCTION
Nutritional intake, which affects one's physical growth and development and health, is established by desirable dietary habits. Individual dietary habits can be influenced by gender, age, parents, and regional factors, and also under the control of social factors such as occupation, family members, socioeconomic level, and nutrition information [1].
College students are in a period of transition from adolescence to adulthood. It is an important period in which they have increased physical and mental activities and should be responsible for their nutritional intakes while enjoying free life without the control of parents and schools [2]. Also, proper dietary habits and balanced nutritional intakes during this period are important because it continues through adulthood [3]. However, studies on college students reported several dietary problems due to irregular meals, skipping meals, overeating, imbalanced diet, night snacking, overconsumption of convenience foods, excessive smoking and alcohol drinking, frequent eating-out, and intakes of foods with excessive calories and fats [4].
Such inappropriate dietary habits can develop several health problems including obesity and cardiovascular diseases. A study reported that 36.6% of male college students was obese [5], and 2013 KNHANES [6] reported that the prevalence of obesity for individuals with 20-29 years of age was 29.3% in males and 14.4% in females. Excess body fat was closely related to the development of hyperlipidemia, hypertension, arteriosclerosis, type 2 diabetes, and cancer [7], and higher degree of obesity was related to the increase of triglycerides and total cholesterol and the decrease of HDL-cholesterol [8]. Smoking, one of wrong habits of college students, is a representing risk factor for coronary heart disease; it increases total cholesterol, triglycerides, and LDL-cholesterol and reduces HDL-cholesterol in the blood [9]. Smoking not only affects blood lipids but also helps heavy metals be absorbed and bound to the tissues with minimal disposal, causing health problems with ages [10]. A study reported the difference in cadmium and mercury concentrations by smoking history [11].
Also, the relationships between BMI or body weight and blood heavy metal concentrations were reported [1213]. Aluminum is one of common elements scattered on earth and has been known as a potential toxic substance harmful to humans and animals. Human body injuries due to the exposure to highly concentrated aluminum include aluminosis of lung, neurotoxicity including aluminum encephalopathy, osteomalacia, myelotoxicity, and anemia [14]. Aluminum can be absorbed from water, food additives, foods, aluminum cooking utensils and containers, about 30-50 mg a day [15].
Mercury is a harmful substance accumulated in the body without any physiological functions and has serious toxicity to damage the nerve systems in humans and animals [16]. Methyl mercury, a major form of organic mercury, can be accumulated in the body by microorganisms through seafoods, freshwater fish and shellfish [17]. Urinary mercury was significantly related to total cholesterol and LDL-cholesterol [18], and mercury was reported to affect heart rate variability, heart disease, and blood pressure, suggesting the risk for heart disease in women and children who ate fish containing high concentration of mercury [19].
Thus, this study was performed in college students in Gyeonggi-do to provide basic data for proper health education by measuring anthropometric measurements, blood lipid profiles, blood aluminum and mercury, and the relationships among them.
Go to : 
SUBJECTS AND METHODS
Study subjects
The subjects were healthy college students, 43 males and 37 females, in Gyeonggi-do. Data were collected from November 6, 2011 to November 8, 2011. The subjects were instructed to directly answer for questions including gender, age, family members, monthly income, and allowance, and surveyed for lifestyles such as exercise, smoking, and alcohol drinking.
Anthropometric measurements
The height and weight of the subjects were measured using an automatic body measuring machine (Fatness measuring system, DS-102, JENIX, Korea). The body mass index (BMI), for the degree of obesity, was calculated from height and weight measurements. Systolic and diastolic blood pressures were measured in a relaxed state using automatic blood pressure gauge (Automatic blood pressure monitor, FT-500R, Korea). All anthropometric measurements of the subjects were directly measured by trained investigators.
Analysis of blood lipid profiles and heavy metals
After at least 10 hours of overnight fasting, 15 mL of venous blood was drawn. For total cholesterol, triglycerides, HDL-cholesterol, SGOT, SGPT, and aluminum measurements, 10mL of venous blood was placed in SS Tube and left at room temperature for 30 minutes for blood coagulation, and then centrifuged at 3,000 rpm for 15 minutes, and stored in the refrigerator. Triglyceride was measured using Triglycerides Reagents kit, total cholesterol using Cholesterol Reagents kit, HDL-cholesterol using HLD-C II Regent kit, SGOT using AST (GOT) Regents kit, and SGPT using ALT (GPT) Regents kit and analyzed by automatic biochemistry analyzer (ADVIA 1650, Japan), and aluminum was analyzed using atomic absorption spectrophotometer (AAS 4100ZL). For mercury measurement, 5mL of venous blood was placed in EDTA Tube and mixed well and stored in the refrigerator, and analyzed using atomic absorption spectrophotometer (AAS 4100ZL). LDL cholesterol was calculated using Friedewald formula, and the atherogenic index (AI) was calculated as below.
Statistical analysis
All data were analyzed using SPSS (Statistical Package for the Social Science, version 17.0).
χ2-test was performed for general characteristics, socioeconomic characteristics, and BMI of the subjects. Mean and standard deviation were calculated for anthropometric characteristics, blood pressure, and blood indexes, and Student's t-test was performed to find significance among them. The significance for the relationship between anthropometric indexes and blood indexes was verified using Pearson's correlation coefficient analysis. Level of significance was set at α = 0.05.
Go to :
RESULTS
General and socioeconomic characteristics
The general and socioeconomic characteristic of the subjects are shown in Table 1. The highest ratio was 32.6% each for 23-24 years and over 25 years in males and 45.9% for 21-22 years in females. The average monthly income of over 3 million won was 62.8% in males and 75.7% in females, and the monthly allowance of over 300 thousand won was 44.2% in males and of 200-290 thousand won was 56.8% in females.
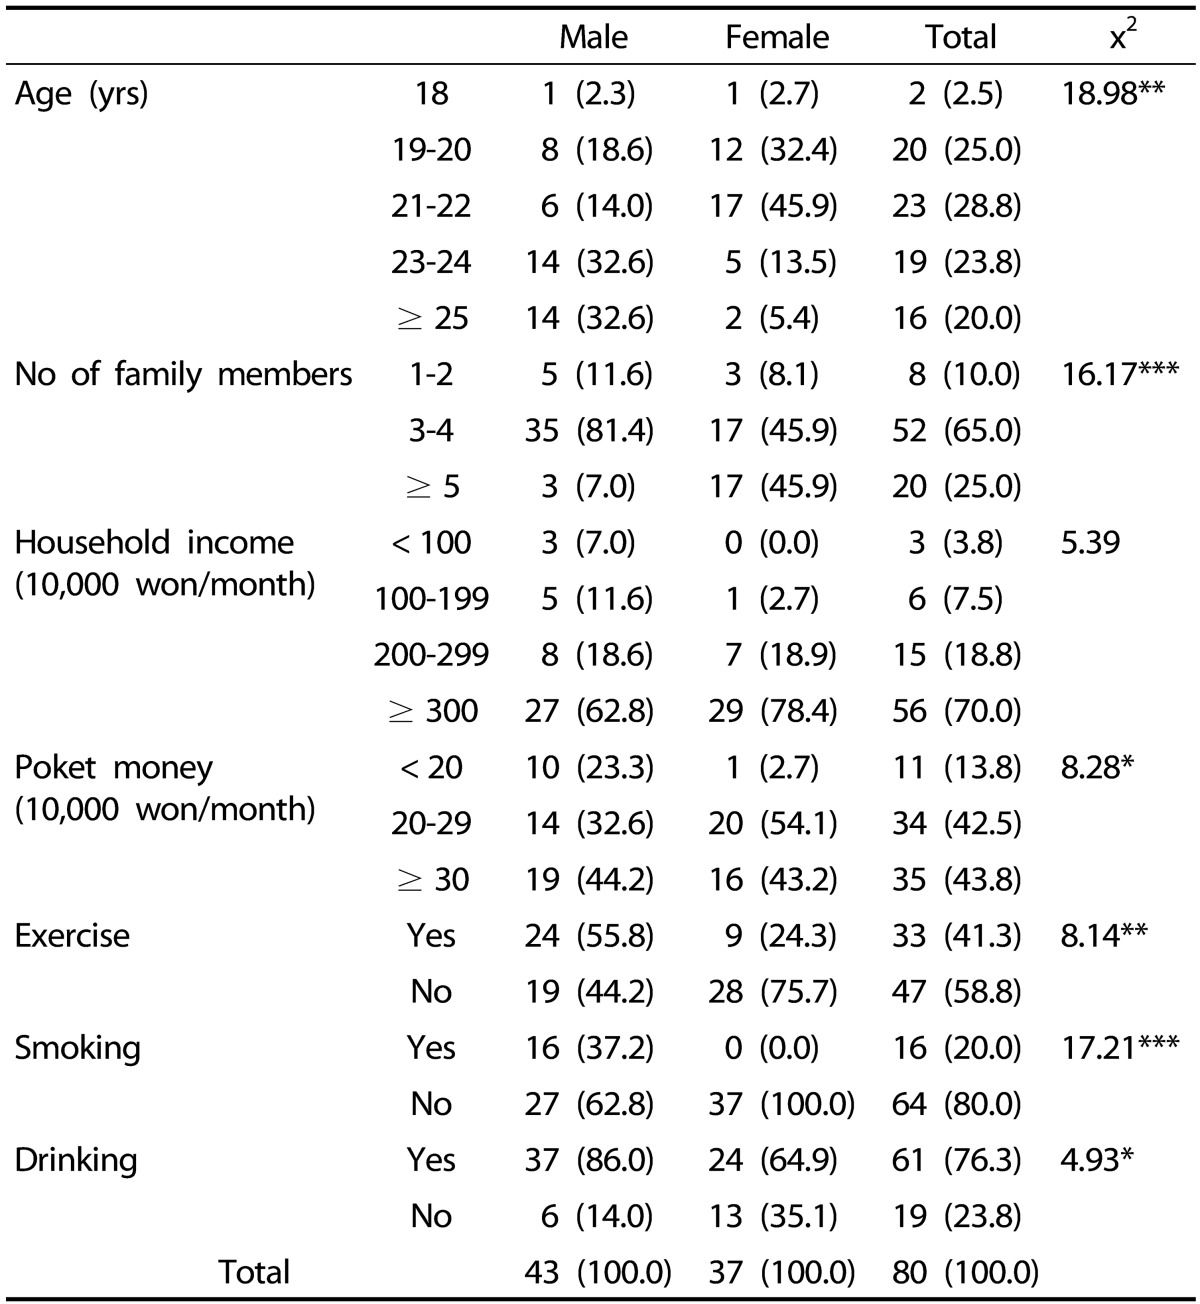
For lifestyles, regular exercise rate was significantly higher in males, 55.8%, than in females, 24.3% (P < 0.01). Smoking rate was significantly higher in males, 37.2%, than in females, 0% (P < 0.001), and alcohol drinking rate was significantly higher in males, 86.0%, than in females, 64.9% (P < 0.05).
Anthropometric measurements and blood pressure
The average anthropometric measurements and blood pressure of the subjects are shown in Table 2. The average BMI was significantly higher in males, 23.69 ± 3.20 kg/m2, than in females, 20.38 ± 2.37 kg/m2 (P < 0.001). According to the BMI standard established for Asian adults by the Korean Society for the Study of Obesity, the normal weight group was 44.2% in males and 70.3% in females, and the overweight and obese group in males and females was 53.5% and 13.5%, respectively. The underweight group was higher in females, 16.2%, than in males, 2.3%.
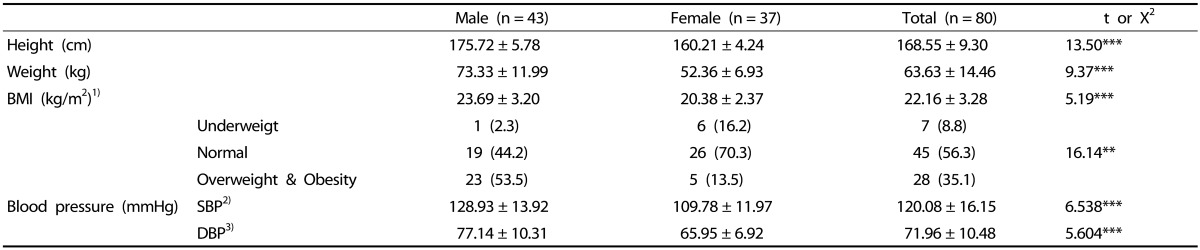
The systolic blood pressure was 128.93 ± 13.92 mmHg in males and 109.78 ± 11.97 mmHg in females; the diastolic blood pressure was 77.14 ± 10.31 mmHg in males and 65.95 ± 6.92 mmHg in females. Male students showed significantly higher systolic and diastolic blood pressure compared to female students (P < 0.001).
Blood lipid profiles and Plasma aluminum and mercury levels
The blood lipids of the subjects are shown in Table 3. Total cholesterol was 174.81 ± 38.61 mg/dL in males and 167.43 ± 22.99 mg/dL in females, and triglycerides was 107.95 ± 55.28 mg/dL in males and 76.95 ± 29.99 mg/dL in females (P < 0.01). HDL cholesterol was 61.88 ± 13.06 mg/dL in males and 64.73 ± 12.16 mg/dL in females. LDL cholesterol was significantly higher in males, 134.52 ± 41.66 mg/dL, than in females, 118.09 ± 27.86 mg/dL (P < 0.05).
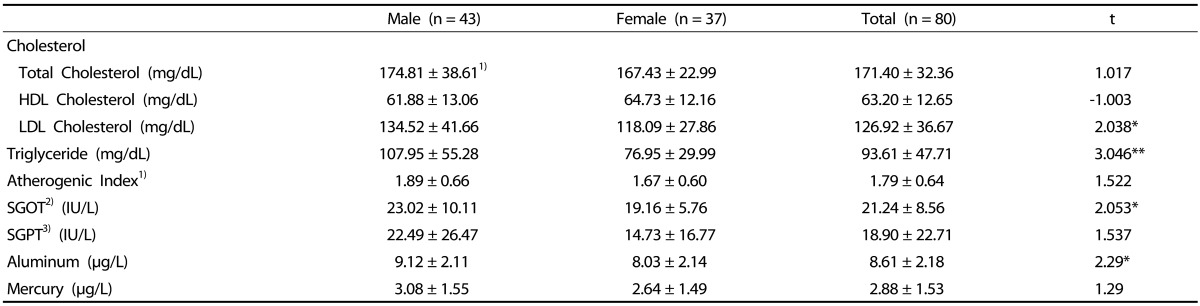
The atherogenic index was 1.89 ± 0.66 in males and 1.67 ± 0.60 in females. SGOT was significantly higher in males, 23.02 ± 10.11 U/L, than in females, 19.16 ± 5.76 U/L (P < 0.05). SGPT was 22.49 ± 26.47 U/L in males and 14.73 ± 16.77 U/L in females.
Plasma aluminum and mercury levels are shown in Table 3. Plasma aluminum was significantly higher in males, 9.12 ± 2.11 µg/L, than in females, 8.03 ± 2.14 µg/L (P < 0.05); plasma mercury was 3.08 ± 1.55 µg/L in males and 2.64 ± 1.49 µg/L in females.
Correlation of anthropometric indices and clinical indices
The relationship between anthropometric indices and blood indices of the subjects was shown in Table 4. In males, total cholesterol was positively correlated with body weight, BMI, systolic and diastolic blood pressure (P < 0.01). Triglycerides was positively correlated with body weight (P < 0.05), BMI (P < 0.01), and diastolic blood pressure (P < 0.01). LDL-cholesterol was positively correlated with body weight (P < 0.01), BMI (P < 0.01), systolic blood pressure (P < 0.05), and diastolic blood pressure (P < 0.01). The atherogenic index was positively correlated with body weight and BMI (P < 0.01). Both SGOT and SGPT was positively correlated with body weight, BMI, systolic and diastolic blood pressure (P < 0.01). Mercury was positively correlated with age (P < 0.05).
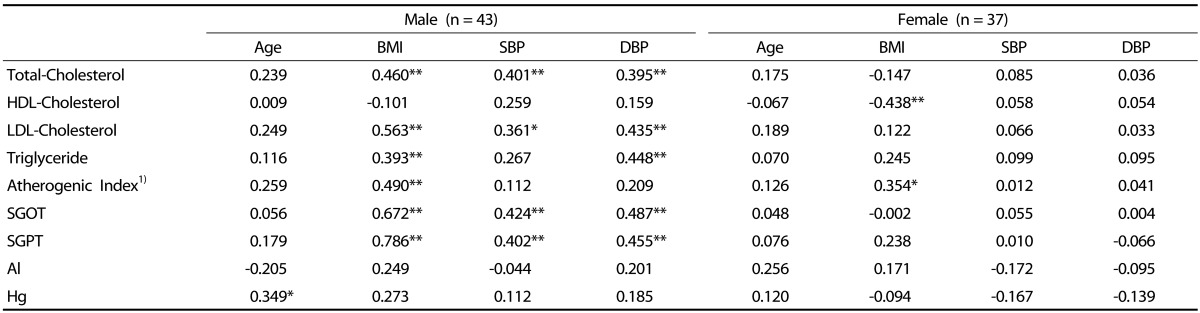
In females, HDL-cholesterol was negatively correlated with body weight and BMI (P < 0.01). The atherogenic index was positively correlated with body weight (P < 0.01) and BMI (P < 0.05).
Go to :
DISCUSSION
The study measured anthropometric characteristics, blood lipids and blood heavy metals in male and female college students to investigate the relationship among them, with healthy college students (43 males and 37 females) in Gyeonggi-do.
The age of 23-24 years and over 25 years was each 32.6% in males and that of 21-22 years was 45.9% in females. Male students were higher in regular exercise rate, smoking and alcohol drinking rates.
The average BMI was significantly higher in males, 23.69 ± 3.20 kg/m2 than in females, 20.38 ± 2.37 kg/m2 (P < 0.001). According to 2013 KNHANES [6], the BMI for 20-29 years of age was 24.2 kg/m2 in males and 23.2 kg/m2 in females; the average BMI of this study was lower in both males and females.
According to the BMI standard by the Korean Society for the Study of Obesity [20], 44.2% of males and 70.3% of females were in the range of normal weight, but male students showed higher overweight rate, 53.5% (overweight 30.2%, obese 23.3%), compared to 13.5% in females. However, the rate was lower than the obesity prevalence for the 20-29 years group reported as 29.3% in males and 14.4% in females in 2013 KNHANES [6], and than the study result of 36.6% obesity rate in male college students [5].
The underweight ratio in female students was 16.2%, which was similar to 15.1% in 2013 KNHANES [6]. Previous studies [2122] also reported that young women preferred underweight. Thus, nutrition education for proper weight control and dietary habits is needed for female students.
Both systolic and diastolic blood pressure were significantly higher in males than in females (P < 0.001). Male students showed higher systolic blood pressure than reported 2013 KNHANES results for 20-29 years males [6], systolic blood pressure 120.1 mmHg and diastolic blood pressure 78.5 mmHg, and female students showed lower values than reported results for 20-29 years females, systolic blood pressure 116.6 mmHg and diastolic blood pressure 73.4 mmHg. Since individuals in the pre-hypertension stage have higher risks for progressing hypertension and for cardiovascular diseases compared to those with normal blood pressure [23], it is suggested to provide the blood pressure management for male students.
For blood lipids, total cholesterol was 174.81 ± 38.61 mg/dL in males and 167.43 ± 22.99 mg/dL in females, and triglycerides was 107.95 ± 55.28 mg/dL in males and 76.95 ± 29.99 mg/dL in females, all of which were in the normal range and significantly higher in males (P < 0.01). HDL-cholesterol was 61.88 ± 13.06 mg/dL in males and 64.73 ± 12.16 mg/dL in females, both were slightly higher than 60 mg/dL. LDL-cholesterol was 134.52 ± 41.66 mg/dL in males and 118.09 ± 27.86 mg/dL in females, with male students significantly higher than females showing the marginal values (P < 0.05). Byun & Chio [24] reported that total cholesterol and LDL-cholesterol were significantly higher in female students, and Kwon et al. [25] also reported significantly higher total cholesterol, LDL-cholesterol, and triglycerides in female students, which were different from our results. On the other hand, Chang [5] reported similar results that the triglycerides level was significantly higher in male students. Part of the reasons for higher triglycerides and LDL-cholesterol levels in male students in the study was higher rate of obese student and smoking rate in males. It has been reported that higher obese rate was related to increased blood triglycerides and total cholesterol and decreased HDL-cholesterol [816], and also increased TC/HDL ratio in male college students [5]. Smoking increased total cholesterol, triglycerides, and LDL-cholesterol and decreased HDL-cholesterol in the blood [5], and triglycerides level was significantly higher in smoking group than in non-smoking group of male college students [26].
SGOT was significantly higher in males (P < 0.05) and SGPT was not different between males and females. Jang et al. [27] reported that the average SGOT of males in their 20s was 22.27 ± 9.22 U/L and SGPT was 28.38 ± 22.91 U/L, which was similar to the results of our study.
Blood aluminum was significantly higher in males, 9.12 ± 2.11 µg/L, than in females, 8.03 ± 2.14 µg/L (P < 0.05). Kim et al. [28] reported in the adult study that blood aluminum was 0.59 ± 0.35 µg/L, and Rahbar et al. [29] reported in the newborn study that the level was 4.4 µg/L.
It is difficult to interpret the study results due to the lack of domestic reference for blood aluminum levels. Although our study results were not higher than those of Alfrey's [30] that normal adults maintain their average blood levels under 10 µg/L, our results were very high compared to previous studies, suggesting that continuous observation is needed. Human body injuries due to the exposure to highly concentrated aluminum include aluminosis of lung, neurotoxicity including aluminum encephalopathy, osteomalacia, myelotoxicity, and anemia [14]. As blood aluminum concentrations increase, neuropathy damage significantly occurs [31].
Aluminum can be absorbed from water, food additives, foods, aluminum cooking utensils and containers, about 30-50 mg a day. Relatively large amount of aluminum is contained particularly in the additives used in cakes, juices, and beer [15].
Blood mercury was 3.08 ± 1.55 µg/L in males and 2.64 ± 1.49 µg/L in females, without significant difference. Our study results were similar to 3.00 µg/L reported in 2008 National Human Exposure Assessment Survey by the Ministry of Environment, and the level was lower than the recommended level for sensitive individuals, 15 µg/L, by CHBM (Commission on Human Biological Monitoring) of Germany or the recommended blood range 1-8 µg/L by WHO, but higher than reported 1.56 µg/L in the USA and 0.58 µg/L in Germany [32]. Some reported that cadmium and mercury concentrations in the body can be different by smoking [1133], but others reported no difference in mercury in the hair [3435] and in the blood [36] by smoking.
Although smoking rate was higher in males, our results showed no significant difference in blood mercury between males and females, suggesting minimal influence of smoking on mercury levels. A study reported no significant difference in mercury levels in the hair of male and female college students in the Jeonnam area [34]. Most of mercury present in the body is thought as organic mercury absorbed from the intake of fish, and blood mercury is increased by higher intake of fish [3637].
The correlation among anthropometric measurements and blood indices was higher in males than in females. In males, total cholesterol, triglycerides, LDL-cholesterol, atherogenic index, SGOT, and SGPT showed positive correlations with obesity, and all indices except the atherogenic index also showed positive correlations with blood pressure. Therefore, higher degree of obesity can increase the possible incidence of cardiovascular diseases. While in female students, HDL-cholesterol showed negative correlation with the degree of obesity, and the atherogenic index showed positive correlation with obesity. These results were similar to those of Lee & Song [38] that total and LDL cholesterol were increased and HDL cholesterol was decreased as the degree of obesity increased in males, but no association in females.
Mercury showed positive correlation with age only in male students. Oh & Lee [12] also reported in the adult study that age is related to blood heavy metals. Differed from the previous studies [1213], blood aluminum and mercury were not correlated with the degree of obesity.
From the above results, about half of males belonged to the overweight and obese group. Student's blood lipid profiles and mercury were in the normal range, but blood aluminum was higher than previously reported levels. The degree of obesity, blood pressure, triglycerides, LDL cholesterol, and aluminum were higher in males, and the blood lipids showed positive correlation with obesity and blood pressure. Thus, male students will possibly have higher risks for chronic disease incidence such as hyperlipidemia and hypertension, and it is considered that a systematic health education is needed for college students, especially for males. Also, additional investigation on blood aluminum concentration is needed.
Go to :
 XML Download