

 PDF
PDF ePub
ePub Citation
 Print
Print


INTRODUCTION
Metabolic syndrome (MetS) is a cluster of interrelated metabolic risk factors that increase the risk of cardiovascular morbidity and mortality [12]. Frequently documented factors include insulin resistance or glucose intolerance, central/abdominal obesity, hypertension and dyslipidemia, particularly decreased high density lipoprotein cholesterol (HDL-C) and hypertriglyceridemia (high blood triglycerides (TG)) [13]. Although its pathogenesis has not been clearly determined, MetS is essentially regarded as a product of interaction between multiple genetic and environmental factors [4]. Interest in MetS has increased worldwide because of its increasing prevalence [5]. The prevalence of MetS varies considerably within and across different populations and increased with years [2678910], irrespective of the definition used [1112]. However, there is an overwhelming ethical, medical, and economic imperative to identify individuals with MetS as early as possible, so that interventions and prognosis of new biomarkers may be helpful in preventing development of its complications including diabetes and cardiovascular disease (CVD).
Leptin, a 16-kDa peptide hormone produced by the obese (ob) gene, is primarily expressed and secreted by adipocytes [13]. It plays a key role in the long-term regulation of body weight by suppressing appetite, stimulating thermogenesis, and increasing energy expenditure [1415]. Elevation of plasma leptin has been suggested to play a role in the pathogenesis of MetS and its various components [16]. Hyperleptinemia involves activation of the hypothalamic-pituitary-adrenal axis, and/or increasing the levels of lipolytic hormones (glucocorticoids and catecholamines), thereby producing some components of MetS, including dyslipidemia, central obesity, and insulin resistance [1617]. In addition, due to resistance to the activity of leptin in the pancreas, leptin fails to inhibit glucose-stimulated insulin secretion, which contributes to the development of hyperinsulinemia, insulin resistance, and type 2 diabetes mellitus (T2DM) [1617181920]. Wallace et al. [21] and Li et al. [22] reported an association of higher leptin concentrations with increased risk of CVD, independent of BMI, age, lipids, blood pressure, and CRP levels. Association of elevated concentrations of circulating leptin with CVD risk factors, including hypertension, obesity, insulin resistance, and T2DM, has been reported [2223].
Increased levels of uric acid (UA) have been reported with abdominal obesity [24]. Elevated serum insulin levels are thought to cause hyperuricemia in MetS, stimulating renal re-absorption of UA [2425]. Conversely, one study reported that lowering UA levels also improves insulin sensitivity as well as hypertriglyceridemia, hypertension, and obesity [26]. Strong association of hyperuricemia with MetS has been reported in many studies [242728293031], and it could be a good marker for MetS [32]. Strong association of elevated serum UA with the occurrence of individual components of MetS including obesity, hyperinsulinemia, impaired glucose tolerance, dyslipidemia, hypertension, and diabetes as well as pro-inflammatory markers has been reported [263334353637]. This association between hyperuricemia and MetS raised the possibility that UA may have a role in the pathogenesis of the syndrome [26313637]. Hyperuricemia could have a role in the development of insulin resistance through urate-induced inhibition of endothelial nitric oxide, which may also result in endothelial dysfunction, hypertriglyceridemia, atherosclerosis, hypertension, and renal disease [263436]. Hyperuricemia also blocks acetylcholine-mediated arterial dilation, further impairing endothelial function [37], and plays a role in the formation of free radicals and oxidative stress, as well as in platelet adhesiveness [24].
In Jordan, several studies have focused on estimating the prevalence of the major risk factors for CVD and have shown a high prevalence of diabetes mellitus, obesity, hypertension, and dyslipidemia [3839404142]. To the best of our knowledge, there are only four available studies investigating MetS in a sample of Jordanians, which reported a high prevalence of MetS [38434445]. However, studies on the clustering of the metabolic risk factors in the form of MetS and comparing the different definitions in Jordanian groups are limited. Specificity and sensitivity of serum leptin and UA levels as predictors of MetS have not been evaluated. Accepted cut-off points for serum levels of leptin and UA have yet to be established. There is still a need to find a simple, practical, specific, and sensitive diagnostic and clinical tool to define those at greater risk of MetS. Therefore, the aim of this study was to evaluate serum levels of leptin and UA in terms of their specificity and sensitivity as predictors of MetS in the studied group.
SUBJECTS AND METHODS
Subjects
This study was conducted in the endocrinology clinics at King Hussein Medical Center (KHMC) in Amman, Jordan. In this study, 630 adult subjects (308 men and 322 women) aged between 20-70 years were recruited from visitors to the clinics, their companions and other volunteers. Pregnant and lactating women, subjects under 20 years or over 70 years of age, women with polycystic ovary syndrome, and subjects with type I diabetes mellitus were excluded. This study was approved by the Royal Medical Services Ethical Committee (ethical approval number TF3-1-7290-2009) and used the Helsinki Declaration. Informed consent was obtained from each participant at the start of the study by signing their own information sheets. Each subject was asked to complete a questionnaire about his/her personal, social, and health history.
Methods
The diagnosis of MetS was made according to the International Diabetes Federation (IDF) criteria-2005 [46]; subjects considered as having MetS had waist circumference (WC) ≥ 94 cm for men, and ≥ 80 cm for women, plus any two of the following risk factors: (1) TG ≥ 150 mg/dL, (2) high density lipoprotein cholesterol (HDL-C) < 40 mg/dL for men, and < 50 mg/dL for women, (3) blood pressure (BP) ≥ 130 mm Hg systolic BP or ≥ 85 mmHg diastolic BP, (4) fasting blood glucose (FBG) ≥ 100 mg/dL. Anthropometric measurements were performed and recorded following standard procedures [4748]. The following anthropometric classifications were used: WC: normal < 94 cm for men, and < 80 cm for women, or high ≥ 94 cm for men, and ≥ 80 cm for women [46]. Blood pressure was measured using a standard mercury sphygmomanometer (Riester, Germany), after seating the subjects for at least 15 min. BP was considered normal if systolic BP < 130 mmHg and diastolic BP < 85 mmHg, or high if systolic BP ≥ 130 mmHg and/or diastolic BP ≥ 85 mmHg [46].
Blood samples were collected after overnight fasting for 10-12 hours and serum was obtained for biochemical analysis of blood variables using standard biochemical kits at the Princess Iman Center for Laboratory Research and Science/KHMC. The following laboratory measurements were performed and recorded for each subject and their values were taken in subsequent calculations: FBG, fasting blood insulin (FBI), leptin, serum UA, total cholesterol (TC), TG, and HDL-C. The insulin sensitivity was then calculated using Homeostasis Model Assessment (HOMA) according to the following formula [49]: .
Statistical analysis
Statistical analyses were performed using Statistical Program for Social Studies (SPSS), version 15.0 for Windows (SPSS Inc., Chicago, USA). Partial correlations were performed between the study variables and were expressed as correlation coefficients and probabilities, after controlling for age. Receiver operating characteristic (ROC) curves were used to determine the efficacy of biochemical indices as screening measures for correct identification of subjects with MetS and for selection of appropriate cut-off points for variables [50]. The optimal cut-off point for each index for men and women was determined using the Youden index, calculated as: Youden index =maximum (sensitivity + specificity -1) [50]. P-value of < 0.01, < 0.05, and < 0.001 was considered statistically significant.
RESULTS
General baseline characteristics of the study group
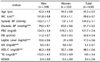
Table 1 shows means and standard error of mean (SEM) of anthropometric and clinical indices by gender for the study group. The study group included 630 subjects; 308 men (49%) and 322 women (51%). The study subjects ranged in age from 20 to 70 years, with a mean age of 43.26 ± 0.5 years (42.2 ± 0.8 years in men and 44.3 ± 0.8 years in women). Men had significantly (P < 0.05) higher values of WC, UA, and TG, while women had significantly (P < 0.05) higher values of diastolic BP, leptin levels, and HDL-C. Age, systolic BP, FBG, FBI, and HOMA index were not statistically significant between men and women.
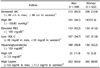
Prevalence of MetS risk factors plus leptin and uric acid in the study group
The distribution of MetS risk factors by gender is shown in Table 2. High leptin level was the most prevalent of biochemical indices in the total sample in approximately 73.3% (65.6% in men and 80.8% in women). Prevalence of the other indices in the total sample was 71.6% for increased WC, 46% for high BP, 42.4% for elevated FBG, 43.5% for low HDL-C, 50.2% for hypertriglyceridemia, and 8.1% for high uric acid levels.
Association between leptin and uric acid and MetS components
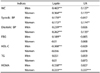
Partial correlation coefficients between leptin and uric acid and risk factors for metabolic syndrome according to gender are shown in Table 3. Leptin level showed significant (P < 0.05) correlation in men and women with WC (men: r = 0.463, P < 0.001; women: r = 0.364, P < 0.001), systolic BP (men: r = 0.170, P < 0.01; women: r = 0.173, P < 0.01), diastolic BP (men: r = 0.239, P < 0.001; women: r = 0.262, P < 0.001), and HOMA index (men: r = 0.338, P < 0.001; women: r = 0.223, P < 0.001), while it showed significant (P < 0.05) correlation with FBG (r = 0.189, P < 0.01) and HDL-C (r = -0.308, P < 0.001) only in men, and did not show significant correlation with TG in either gender. Uric acid level showed significant (P < 0.05) correlation with WC in men and women (men: r = 0.127, P < 0.05; women: r = 0.173, P < 0.01), and showed significant (P < 0.05) correlation with systolic BP (r = 0.174, P < 0.01), diastolic BP (r = 0.135, P < 0.05), and HOMA index (r = 0.227, P < 0.001) only in women, and did not show significant correlation with FBG, HDL-C, and TG in either gender.
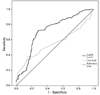
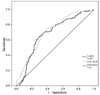
ROC curves for identification of subjects with MetS
For determining the efficacy in identification of subjects with MetS of leptin and uric acid levels, ROC curves demonstrated optimal cut-off points, AUC, sensitivity, specificity, and P-value (Fig. 1 and 2). For identification of men with MetS, AUC from the clinical and biochemical indices was highest for HDL-C (0.913), followed by FBG (0.869), systolic BP (0.853), diastolic BP (0.842), HOMA (0.841), TG (0.796), and leptin (0.721). AUC was low for UA and the P-value was not significant in men. Regarding women with MetS, AUC from the clinical and biochemical indices was highest for systolic BP (0.930), followed by diastolic BP (0.920), FBG (0.826), TG (0.823), HOMA (0.776), HDL (0.744), UA (0.706), and leptin (0.683).
The optimal cut-off points of clinical and biochemical indices, for identifying MetS, were as follows: for systolic BP 135 mmHg in men and 125 mmHg in women, for diastolic BP 82.5 mmHg in both men and women, for TG 181 mg/dl in men and 143 mg/dl in women, for FBG 102.5 mg/dl in men and 100.5 mg/dl in women, for HDL-C 51.5 mg/dl in men and 49.5 mg/dl in women, for HOMA 2.56 in men and 2.98 in women, for leptin 7.55 ng/ml in men and 21.50 ng/ml in women, for UA 6.35 mg/dl in men and 4.35 mg/dl in women.
DISCUSSION
Extensive literature search did not find other studies using ROC analysis for prediction of MetS using serum leptin levels, and, to the best of our knowledge, the current study is the first to report sensitivity, specificity, and cut-off points for leptin and uric acid as predictors and risk factors of MetS in Arab countries.
In the current study significantly (P < 0.05) higher mean serum leptin levels were observed in women than men, 24 ng/ml and 10.6 ng/ml, respectively (Table 1), with a P-value < 0.001. This is in agreement with previously published studies [23515253]. This gender variation is possibly due to testosterone effect in men to suppress leptin production in adipocytes [225253]. In the current study, the prevalence of high leptin level (> 5.6 ng/ml in men, > 11.1 ng/ml in women) was 65.6% in men and 80.8% in women, Table 2.
Serum leptin level showed significant (P < 0.05) correlation with risk factors for MetS in men, except for TG, Table 3. After controlling for age, partial correlation coefficients in men were highest between leptin levels and HOMA index, followed by low HDL-C, diastolic BP, FBG, and systolic BP. This is in accordance with other studies [151853], which found that serum leptin levels showed the highest correlation with insulin resistance in men. In women, serum leptin level showed significant (P < 0.05) correlation with systolic BP, diastolic BP, and HOMA index only. After controlling for age, partial correlation coefficients in women were highest between leptin levels and diastolic BP, followed by HOMA and systolic BP. There was no significant correlation with FBG, HDL-C, and TG. In their study, Lyoussi et al. [52] found no relationship between leptin levels and serum lipids, which coincides with the results of the current study. Conversely, Ingelsson et al. [23] reported that sex-adjusted leptin levels showed significant (P < 0.05) positive correlation with all metabolic risk factors in the following descending order: TG, FBG, diastolic BP, and systolic BP, and low HDL-C. Yun et al. [16] and Hamed et al. [53] also reported high correlation of serum leptin level with triglycerides, in contrast with the results of the current study where serum leptin levels showed no significant correlation with TG.
The results of the current study (in both men and women) show a positive correlation between leptin levels and hypertension and insulin resistance, possibly due to its preserved effects on the kidneys and their sympathetic nervous system (leading to sodium retention) in addition to the effects on the hypothalamic-pituitary-adrenal axis (exaggerating insulin resistance) [20375455]. Similar results were obtained from several studies showing elevation of plasma leptin levels in individuals with insulin resistance and hypertension, independent of obesity levels [15235253]. Serum leptin levels could be a useful marker for evaluation of the risk of MetS independent of baseline obesity and other metabolic risk factors [161821]. Similar results were obtained in the current study.
For identification of subjects with MetS, AUC from leptin ROC curves was 0.721 in men and 0.683 in women (Fig. 1 and 2), with a P-value < 0.001 for both genders. The sensitivity of the test was 72% in men and 64% in women, and the specificity value was 72.1% in men and 70.8% in women. The optimal cut-off point for leptin level was 7.55 ng/ml in men and 21.50 ng/ml in women. In a Chinese study including 2046 subjects of both genders, AUC for leptin was 0.754 in men and 0.707 in women [56]. Unfortunately, this study did not report values for sensitivity, specificity, and cut-off points. A more recent Taiwanese study reported that AUC for leptin was 0.676 in men and 0.627 in women [22].
Significantly higher mean serum UA levels were observed in men than in women, 5.5 mg/dl vs. 4.8 mg/dl, respectively, with a P-value < 0.001. This is in agreement with previously published studies [343557], possibly due to the effects of estrogen or other steroid hormones [31]. However, many studies [2930313457] demonstrated that hyperuricemia was a more significant biomarker in women than in men as a risk factor for MetS. In the current study, the prevalence of high UA levels (> 7.0 mg/dl) was 11.4% in men and 5% in women, Table 2. In women, UA levels were most significantly (P ≤ 0.05) correlated with HOMA index, followed by systolic BP and diastolic BP. However, UA levels did not show significant correlation with FBG, HDL-C, and TG. In men, UA levels did not show significant correlation with any MetS risk factor, Table 3. These results illustrate a positive correlation between hyperuricemia and insulin resistance and hypertension in women only, possibly due to its effects on the kidneys and the interaction between estrogen and other hormones has been suggested as a possible cause for gender differences [2631]. This association has also been reported by other researchers [242653]. Other studies reported positive correlation between hyperuricemia and other MetS components besides insulin resistance and hypertension [3435585960]. In a prospective study including 9689 men and women, hyperuricemia also showed positive and significant association with higher risk of incident MetS, independent of age, obesity, and other MetS components and could be considered a solid predictor for the development and incidence of MetS [29]. A 1.6-fold increase in risk of MetS was reported in men with serum UA concentrations ≥ 6.5 mg/dl [2937], while in women the risk of MetS was more than 2-folds higher when serum UA concentrations were ≥ 4.6 mg/dl [29]. Hyperuricemia has been shown to predict the risk of MetS independently of baseline obesity and other metabolic risk factors in many cross sectional studies [2427283061], which was shown in the study results.
For identification of subjects with MetS, AUC from UA ROC curves was 0.56 in men and 0.706 in women (Fig. 1 and 2), with a P-value < 0.001 only in women. In men, AUC was low and the P-value was not significant. The sensitivity of the test was 37.8% in men and 75.3% in women. The specificity value was 84.4% in men and 59.7% in women. The optimal cut-off point for UA level was 6.35 mg/dl in men and 4.35 mg/dl in women. In several studies hyperuricemia was more significant as a risk factor for MetS in women than in men [293034355762]. Similar results were obtained in the current study, which showed that hyperuricemia had a good diagnostic value in predicting the risk of MetS in women only. In addition, hyperuricemia had no significant predictive power for identification of MetS in men. Cut-off points for UA serum levels in predicting MetS have not been studied. Rho et al. [62] reported that women with UA levels > 5.7 mg/dl had a significantly increased risk for MetS. Other studies adopted levels reported to have significance in inducing gout to be the higher limits of normal or used normal ranges used in clinical practice. For example, hyperuricemia was defined in men as UA more than 7.0 mg/dl and in women as UA more than 6.0 mg/dl [3439].
In conclusion, serum leptin levels can be a useful biomarker for evaluation of the risk of MetS independent of baseline obesity and other metabolic risk factors in both men and women. Serum UA level in men did not show significant correlation with any MetS risk factors and had no significant predictive power for the identification of MetS. In women serum UA levels showed significant positive correlation with insulin resistance and hypertension and appeared to be a good diagnostic tool in predicting the risk of MetS. Therefore, women with hyperuricemia should be screened for components of MetS. Hyperuricemia could replace insulin resistance as a cheap and easy test marker for MetS in women.
Due to small sample number and because studies reporting sensitivity, specificity, and cut-off points for leptin in predicting the risk of MetS are limited, the significance of the results of this study requires further investigations mainly in Arab countries.
 XML Download