

 PDF
PDF ePub
ePub Citation
 Print
Print


Introduction
Obesity is considered to result from the imbalance between energy intake and energy expenditure. Reducing food intake, altering metabolism and/or increasing energy expenditure will be used for treating obesity. In general, weight control medication is done with appetite suppressants, lipolysis stimulant and thermogenesis inducer. Their anorectic effects are considered to induce the efficacy via brain monoamines, especially noradrenergic or serotonergic neurotransmission. The effectiveness of some medications is supposed to work only when they are used and to have addictive properties probably related to the dopaminergic neurotransmission. Moreover, it was reported that most medications were not reached even the level of expected 15% weight loss, compared to 30% weight loss by gastric-bypass surgery (Bray, 2001). Recently alternative/complementary functional foods for antiobesity are available for many therapeutic herbs containing phytochemicals which have far fewer side effects in comparison to pharmaceutical agents. But much caution is needed to use them because many of them are produced without proper quality control and standardization.
It is known that a realistic goal of weight loss is to reduce current weight by 5 to 10% which improves the overall health (NIH, 2000). Most reasonable and safest weight loss strategy is choosing nutritious foods in moderation and increasing expenditure by daily physical activity. Aside from their lower energy densities, food such as whole grain, legumes, nuts, fruits, and vegetables offer many micronutrients and fibers. In these foods, fiber tends to have great volumes, thus helping people feel full and satisfied. The expansion of stomach in response to the food volume provides a powerful satiety signal, which relays the information to the brain via neural system, inhibiting further intake of food. Nutritionists recommend consuming dietary fiber, nutrient as well as phytochemicals, 5-6 times per day as possible to prevent obesity, cancer, cardiovascular disease and diabetes mellitus. Dietary fibers are indigestible because of their beta-glycosidic bonds, but are fermentable by bacteria in the intestine. Insoluble fiber increases stool weight and fecal volume and in turn stimulates peristaltic contraction of the colon, propelling the material forward and helping to prevent and alleviate constipation. These intestinal contraction and movement are controlled by parasympathetic nervous system (Martini et al., 1995). On the other hand, soluble fiber has water-holding capacities and binding capacity of cholesterol-containing bile to inhibit enterohepatic circulation. Normalizing blood glucose and cholesterol levels, it is important for people at risk for diabetes and/or cardiovascular disease (Mcguire et al., 2007). In fact, these metabolic diseases are closely related to the obesity, and there is an attractive hypothesis that a defect may exist in controlling the mobilization of lipids from fat depots of obese subjects. Lipolysis is under intense hormonal control. In human, catecholamines play a major role as they are the only hormone with a pronounced and acute lipolytic effect in adipose tissue of adult subjects. Lipolysis in human fat cells can be stimulated by catecholamine through β1- and β2-adrenoreceptors and inhibited through α2-adrenoreceptors (Reynisdottir et al., 1994).
Pectin, soluble dietary fiber, is one of the plant polysaccharide in the apple skin or herb like ginseng. In Korea, apple is usually consumed for not only favorite fruit but also weight control of female and ginseng is ergogenic aids for athletes and male adults. It was speculated that lipolysis might be related to the efficacy of both foods. Would dietary fiber induce to release neurohormone such as norepinephrine centrally or peripherally? This study was conducted to investigate pectin administration and /or high fat diet on catecholamine profiles in serum and brain of Sprague-Dawley rats.
Materials and Methods
Animals and diets
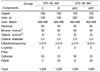
Male, 3-wk-old Sprague-Dawley rats (n=28, average initial weight 61.4±2.2g) were obtained from Animals Co. (Daehan, Korea). After three days of acclimatization, rats were divided into four groups which were respectively given 10% fat diet (C) as control group, 10% fat plus pectin diet (P), 20% fat diet (HFC) and 20% fat plus pectin diet (HFP) for four weeks. The diets were the modified AIN 76 diet (Reeves et al., 1993). For dietary fiber source, 5% cellulose was administered in C and HFC diets, and 2.5% cellulose plus 2.5% pectin were added in P and HFP diets (Table 1). All ingredients for diet were purchased from Labanimal Co. (Dyets, Bethleham, PA). The animals were housed individually in stainless steel wire-bottom cage in an automatically light controlled (06:00-18:00h) and temperature controlled (20-22℃) room with relative humidity (50-60%). They were fed each diet and tap water ad libitum. Food intake was recorded daily and the body weight was recorded weekly. Feces were collected weekly. From the food Intake, energy intake and body weight gain of rats, food efficiency ratio (FER) and energy efficiency ratio (EER) were calculated. After 4 weeks of feeding, the animals were anesthetized with ethyl ether and blood from the carotid and the tissue samples were collected. Blood samples were stored in the refrigerator overnight and centrifuged at 3,000rpm for 20 min. Serum was stored at -70℃ until analysis. All animal procedures conformed to "Guide for the Care and Use of Laboratory Animals" (National Research Council, 1996). On the ice, the brain was removed immediately after sacrificing the animals. Frontal, parietal, and temporal portions of forebrain and left/right portions of midbrain of rats were stored in 1% perchloric acid at -70℃ until analysis. The weight of brain, liver, adrenal gland and epididymal fat pad were recorded.
Biochemical analysis
The serum and brain norepinephrine, epinephrine and dopamine were analyzed with a HPLC system, consisted of pump (Model 930, Younglin, Anyang, Korea), electrochemical detector (464 pulsed ECD, Waters, USA) and Nova-Pak C18 (3.9×150 mm, Waters, USA). Brain homogenates were centrifuged at 15,000rpm at 4℃ for 10 min and supernatants were filtered and injected onto HPLC column immediately. Serum norepinephrine, epinephrine and dopamine purified by an alumina extraction was quantitated by ECD detection (Pesce & Kapla, 1987). Mobile phase was composed with 0.15mM chloroacetic acid, 250mg Na2 EDTA, 80mg octylsulfate in 1L of distilled water with 5% methanol (pH 3.5), and flow rate of mobile phase was 1.0ml/min (Morier-Teissier et al., 1984). All reagents for analysis and standard reagents used were the product of Sigma Co. (St. Louis, USA). The total- and HDL-cholesterol, triglyceride and glucose in serum were determined enzymatically by using a commercial kit (Asan Pharmaceutical, Seoul Korea). Serum LDL-cholesterol was calculated from the equation of Friedewald et al. (1972). The fecal lipid excretion was measured using the method of Bligh et al. (1959).
Statistical analysis
The data were expressed as means±standard deviation. Data were evaluated through two-way ANOVA to test for main effects of dietary fat level and pectin administration at a=0.05 level. The significance of difference between groups was analyzed by one-way analysis of variance (ANOVA) and Duncan's multiple range test at the p<0.05 significance level using SPSS PC v.12 Program.
Results
Food intake & body weight gain
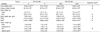
As shown in Table 2, the food intake of rats fed 10% fat diet (C & P) was significantly higher than that of 20% fat diet (HFC & HFP) (p<0.05). Rats fed 20% fat plus pectin diet (HFP) consumed the lowest amount among all groups. Body weight gain of rats fed 20% fat plus pectin diet (HFP) was significantly lower (p<0.05) than that of rats fed the other diets. As a result, food efficiency ratio (FER) of rats fed 20% fat diet (HFC) was the highest, while that of rats fed 20% fat plus pectin diet (HFP) was the lowest (p<0.05). However, there was no significant difference between FER of rats fed 10% fat diet (C) and that of rats fed 10% fat plus pectin diet (P).
Weight of epididymal fat mass and organs
There were no significant differences in brain, epididymal fat pad and adrenal gland weights of rats according to the fat level in diets or pectin administration, even though epididymal fat mass of rats fed diets with pectin (P & HFP) tended to be lower than that of rats fed diet without pectin (C & HFC). However, liver weight of rats fed 20% fat plus pectin diet (HFP) was the lowest significantly among all groups (Table 2).
Fecal and serum lipids
As shown in Table 3, daily fecal excretion of rats fed diet with pectin (P & HFP) was significantly lower than that of rats fed without pectin (C & HFC). Compared with the rats fed 10% fat diet plus pectin diet (P), rats fed 20% fat plus pectin diet (HFP) excreted less feces significantly (p<0.05). There were no significance differences in total lipid contents per gram of feces among groups. However, rats fed 20% fat diet (HFC & HFP) tended to excrete more feces than those fed 10% fat diet (C & P).
Serum total cholesterol and LDL-cholesterol did not show any significant differences among all groups. Unfortunately, serum HDL-cholesterol of rats fed 20% fat plus pectin diet (HFP) was significantly lower than that of rats fed 10% (C) or 20% fat diet (HFC). However, serum triglyceride and glucose concentrations of HFP group were the lowest among all groups (p<0.05).
Catecholamine concentration of serum and brain
Generally norepinephrine contents in brain did not show any significant differences among the groups. However, in the right portion of midbrain, norepinephrine contents of rats fed 10% fat diet group (C) were significantly higher than those of rats fed the other diets (p<0.05)(Table 4). Epinephrine contents were not detected at all in the frontal portion of brain in all groups. Even though epinephrine contents were detected in the left midbrain, there were no significant differences. Especially dopamine contents were not detected in most samples except the frontal portion or right portion of midbrain.
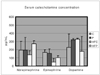
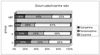
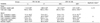
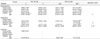
Serum norepinephrine and dopamine concentrations did not show any significant differences among all groups. As shown in Figure 1, epinephrine concentration was significantly higher in 10% fat diet group (C) than 20% fat diet group (HFC) regardless of pectin administration (p<0.05). In 20% fat plus pectin diet group (HFP), serum norepinephrine tended to be higher, but dopamine concentration tended to be lower compared to those of the other groups. The ratios of norepinephrine level versus epinephrine level in 20% fat diet groups (HFC & HFP) were twice higher than those of 10% fat diet groups (C & P). However, the ratio of dopamine level versus epinephrine level of 20% fat diet group (HFC) was three or four times higher than those of the other groups (Figure 2).
In conclusion, dietary fat level significantly influenced food intake, body weight gain, FER, EER and liver weight, while pectin administration affected serum HDL-cholesterol, serum glucose, norepinephrine in the right portion of midbrain and epinephrine in the temporal portion of midbrain. Epinephrine in the right portion of midbrain and fecal excretion was significantly affected by both pectin administration and dietary fat level.
Discussion
Today, one of the most popular types of diets is high fat, low carbohydrate diet. It is considered the main cause of metabolic imbalance that underlies obesity. Traditionally in Asia, most energy comes from carbohydrates, and fat has contributed only 10%~20% of total energy, even though in recent times the percentage of dietary fat has reached 25% of total energy. However, high carbohydrate intake may not be entirely neutral with respect to chronic diseases when it is ingested for a long period of time (Grundy SM, 1999). The source of dietary carbohydrates is an issue of some potential importance. Especially in non-digestible forms of carbohydrates, dietary fiber is the edible parts of plants that are resistant to digestion and absorption in the human intestine. Among dietary fibers, functional fiber has promoted beneficial physiological effects including laxation, and/or blood cholesterol attenuation, and/or glucose attenuation (FNB/IOM, 2002).
Some reviews have focused on the effects of dietary supplements including the commonly consumed fibers on the human body weight reduction (Howarth et al., 2001; Pittler & Ernst, 2004). They suggested that addition of 14 g/d of either soluble or insoluble fiber increased post-meal satiety and caused a modest decrease in body weight, but there is little evidence that the commonly available fiber supplements, such as chitosan, have any beneficial effects on human health. Artiss et al. (2006) reported that a new soluble dietary fiber, a-cyclodextrin (4%) induced the effect in reducing body weight gain and improving metabolic syndrome in 40% fat diet, that is, it elicited a reduction in plasma triglyceride level of 30%, total cholesterol of 9%, and increasing fecal lipid content as well as decreasing plasma leptin significantly.
In this study, the effects of dietary soluble fiber and pectin on the lipid parameter in feces or serum, and neurohormone profiles in serum and brain were examined in rats fed diets with different fat contents. In 20% fat diets (HFC & HFP), pectin administration significantly induced the reduction of food intake, body weight gain and serum triglyceride and glucose level. However, there was an undesirable result of decreasing serum HDL-cholesterol significantly due to the decrease of total cholesterol and the increase of LDL-cholesterol even though it was slight. As shown in Figure 2, the ratios of norepinephrine level versus epinephrine level in 20% fat diet groups (HFC & HFP) were twice higher than those of 10% fat diet groups (C & P). However, the ratio of dopamine level versus epinephrine level of 20% fat group (HFC) was three or four times higher than those of the other groups. Surprisingly, serum norepinephrine level of HFP group was the highest, but relatively low in the right portion of midbrain among all groups. From these results, it was suggested that the smaller adipose tissue mass and body weight gain in rats fed with the 20% fat plus pectin diet might be related to serum and midbrain norepinephrine levels and pectin administration might regulate the catecholamine balance in high fat diet which relatively increased the dopamine level in serum.
There are only two FDA approved long-term use antiobesity drugs, olistat and sibutramine. The former acts to inhibit pancreatic lipase activity in small intestine and induce modest weight loss and maintenance (Heck et al., 2000). The latter is known to inhibit the reuptake of norepinephrine and serotonin which reduces body weight by suppressing appetite (Bray, 2001). Actually, it was reported that some food components, such as caffeine, can increase urine and plasma catecholamine concentration (McKevoy, 1998; Bell et al., 2001). Especially catechins in green tea were considered to induce thermogenic effect by increasing the level of norepinephrine, because catechin polyphenols are known to inhibit catechol-O-methyltransferase, the enzyme that degrades norepinephrine (Cooper et al., 2005).
Biogenic amines, small molecules made in the body from single amino acids, serve a number of roles as hormones, neurotransmitters, tissue humors, and others. Two chemical classes of biogenic amine act as hormones, the catecholamine and indolamines. The catecholamine, primarily epinephrine and to a lesser extent, norepinephrine play multiple roles in humans and animals, depending on the species and circumstances. They are secreted into the bloodstream by the chromaffin cells of the adrenal medulla and have diverse actions as hormones on the effector cells. Norepinephrine occurs primarily within the nervous system, as a neurotransmitter rather than a hormone (Quay et al., 1995). When norepinephrine is injected into the brain paraventricular nucleus (PVN) or ventromedial nucleus (VMN) of satiated rats, it stimulates food intake by α2-adrenoreceptors and is preferentially manifested by higher carbohydrate intake (Leibowitz, 1986). Conversely, injection of norepinephrine into the perifornical-lateral hypothalamus (LH) reduces food intake through β-adrenoreceptor. The changes in norepinephrine in both VMH and LH are opposite to those which would be expected to stimulate food intake in either area, suggesting that they may change as a result of counterregulation intended to suppress food intake (Shimizu & Bray, 1989). Peripherally, norepinephrine and epinephrine stimulate α1-, and β1-adrenoreceptor and accelerate cellular energy utilization and mobilization of energy reserves. In skeletal muscle, they trigger the glycogen reserve and accelerate the breakdown of glucose to provide ATP. In adipose tissue, stored fat are broken down to fatty acids and the fatty acid are released into the circulation for use by other tissues, and in the liver, glycogen molecules are broken down into glucose to be released into the bloodstream, primarily for use by neural tissues. In the heart, stimulation of β1-adrenoreceptor triggers an increase in the rate and force of cardiac muscle contraction. In the brain, norepinephrine is distributed widely from cerebral cortex to brain stems, while epinephrine is found in thalamus, hypothalamus and midbrain, and dopamine is in hypothalamus and limbic system (Martini et al., 1995). It was not surprising that brain dopamine contents were not detected in samples except the right portion of midbrain in this study.
Conclusively, it is suggested that dietary pectin consumption as a kind of stressor may affect norepinephrine metabolism diversely depending on dietary fat levels in rats. In the future, more researches will be necessary to investigate the change of neurohormone profiles in blood and brain in animals consumed different levels of dietary components and soluble functional fibers.
 XML Download