

 PDF
PDF ePub
ePub Citation
 Print
Print


Introduction
Nutrient intakes, health behaviors and quality of life are interrelated and are of particular importance among rural residents. Rural areas exhibit a variety of dietary habits and food-intake patterns (Lee et al., 2002; Ministry of Health & Welfare, 2002) with food intake and food selection being lower, consequently nutrient intakes being lower than urban areas. This results in deficiencies in certain nutrients still being prevalent among rural Koreans. Dietary diversity is a fundamental concept of dietary guidance internationally (Katanoda et al., 2006; Kennedy, 2004; WHO, 1996), since increasing the diversity of foods is thought to ensure an adequate intake of essential nutrients and to promote good health (Ruel, 2003). A low dietary diversity is a particularly severe problem among vulnerable populations of the poor (Ruel, 2003) and elderly (Bernstein et al., 2002; Marshall et al., 2001) populations. Adequate nutrient intake is essential to health promotion. Hence increasing nutrient intakes as well as the dietary diversity of rural Koreans is a potential way to improve their nutritional, and consequently, their health status and quality of life. Moreover, Krebs-Smith et al. (1987) reported that variety among and within major food groups was associated with diet quality assessed by the mean adequacy ratio (MAR) of 11 nutrients. Evaluating the dietary diversity score (DDS) and MAR are, therefore, a good way to predict quality of diet and the entirety of dietary habits.
In this study, we examined the dietary intakes and health behaviors of Asan residents in order to improve health status and consequently the quality of life of Asan residents, especially those who live in a rural area. Asan is a medium-sized city with the unique feature with three distinctive regions since there are some areas with various kinds of industrial factories such as semi-conductor factories or automobile, air-conditioner and refrigerator manufacturing factories. Additionally, other areas are mostly composed of rice farms or other kinds of rural farms in the boundaries of Asan. Some areas with a largely populated urban area (On-yang si) are also within the district of Asan. Therefore, Asan can be easily differentiated into three distinctive regions of rural, factory and urban areas. The purpose of this study was to examine and compare nutrient intake, DDS, MAR and health behaviors of Asan residents by the three distinctive regions.
Subjects and Methods
Subjects
Volunteers were recruited from residents of Asan during January 2003 and the purposes and content of the study were explained to all participants, who provided their written, informed consent. A total of 930 subjects (351 men and 579 women), aged 61.4 ± 13.8 (mean ± SD; range 20-96) years correctly completed a 24-hour recall interview and were finally selected as participants.
Data collection
Information on individual characteristics such as demography and socioeconomic status and health related behaviors was obtained using pre-coded questionnaires. Dietary-intake data using a one-day 24-hour recall method were obtained by one-to-one interviews from the 5th to the 26th of January 2003. Detailed descriptions of all foods and beverages consumed and estimated food portion sizes were recorded by trained interviewers using food models, standard household measures, and full-sized colored photographs as memory aids.
Dietary intakes
Food records were converted to nutrient intakes using a computerized nutrient analysis program (CAN-pro, v2.0, The Korean Society of Nutrition, Seoul, Korea). All nutrient intakes were adjusted for total energy intake in order to minimize extraneous errors in estimating dietary intake due to individual differences in total food intake. The energy-adjusted nutrient intake for each individual was computed by taking the residual from the regression model in which total caloric intake was the independent variable and the observed nutrient intake was the dependent variable, plus a constant equal to the expected intake of the nutrient for the mean caloric intake of the study population (Willett, 1990). Dietary diversity score (DDS) of each individual was calculated from QUANTIDD, which is the proportion of 17 food groups (cereals or grains, potato and its products, simple carbohydrates or sugars, beans and its products, nuts or seeds, vegetables and their products, mushrooms, fruits and their products, meat or pork or poultry, eggs and the products, fish or shellfish and their products, seaweed and its products, milk and dairy products, fats or oils, beverages, seasonings and others) contributing to the total amount of food intake after all the food ingredients from mixed dishes were decomposed. The highest possible DDS from QUANTIDD is 1.00. Information on the 17 food groups to calculate DDS from QUANTIDD is available elsewhere (Katanoda et al., 2006). The mean adequate ratio (MAR) is a mean nutrient adequate ratio (NAR) of 12 nutrients (protein, vitamins A, C, E and B6, thiamin, riboflavin, niacin, folic acid, calcium, iron and zinc) and NAR of each nutrient was calculated by dividing actual nutrient intakes by recommended intakes (RI) of KDRI (Dietary Reference Intakes for Koreans, Korean Nutrition Society, 2005). Nutrients without RI values defined in KDRI, such as energy, fat, carbohydrate, sodium, fiber and cholesterol, were excluded in the NAR calculation.
Statistics
All statistical analyses were performed using SPSS (version 12.0). Frequency distributions for continuous variables were used to identify and validate the outliers. Differences among regions were assessed by ANOVA and Tukey's post-hoc analysis for continuous variables and by the χ2 test for categorical variables. Since regions showed different social economic status (SES) such as income and education levels and age distributions were also different by regions, analysis of covariance (ANCOVA) was conducted to detect true differences among regions after controlling age and income levels as covariates. Statistical significance was defined at the p<0.05 level.
Results
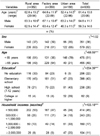
The fundamental characteristics of the participants and comparisons by regions are presented in Table 1. For the total participants, mean age was 61.4 ± 13.8 years, with the men being older (64.8 ± 11.7 years; p<0.001) than the women (59.3 ± 14.6). For the men, factory area residents were significantly older than those living in other areas whilst for the women, urban residents were significantly younger than those living in other areas. The education levels were significantly different by regions (p<0.001), with more college graduates in the urban area. Forty-five percent of the participants earned less than 500,000 won per month, which is less than half the Korean average wage. Income levels were also significantly different among different regions (p<0.001).
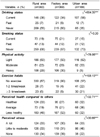
Table 2 shows health related behaviors of the participants. Current drinkers were significantly more in the urban area while never-drinkers were more in the rural or factory areas (p<0.001). However, proportions of current, past and never smokers were not significantly different by regions. Physical activity levels were significantly higher in rural or factory areas than in the urban area (p<0.001), whereas urban residents exercised more frequently than both rural and factory area residents (p<0.001). There were more people who consider themselves less healthy than others with similar age in the rural and factory areas (p<0.001). On the other hand, more urban residents felt more stress than the rural or factory area residents (p<0.001).
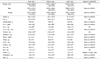
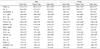
Energy intakes of the participants were 1679 ± 523 kcal for men and 1467 ± 436 kcal for women (Table 3). Energy intake of the total participants was higher in urban area than those in the rural or factory area, but after SES variables such as age and income levels were controlled as covariates in ANCOVA model, regional differences were no longer significant. Men did not show any difference in energy intake by regions in both models. Meanwhile, energy intake of women in the rural area was significantly lower than that in the urban area residents and the results were not different after SES variables were controlled. The energy-adjusted intakes of protein, riboflavin and calcium were lower in the rural area than in factory or urban areas for the total participants and after adjustment of SES variables, the results showed same significant differences (p<0.05). Energy-adjusted intakes of fat, vitamin C, and thiamin were significantly higher in the urban area than in the other two areas (p<0.05) by ANOVA, but ANCOVA models did not show any significant differences. However, for vitamin E and cholesterol, both ANOVA and ANCOVA models showed same results of significantly higher intake in the urban area than in the other two areas (p<0.05). Vitamin A intakes were significantly different among all three regions, being lowest in the rural area, significantly higher in the factory area and highest in the urban area by both ANOVA and ANCOVA (p<0.05). Zinc intake of the factory area residents was significantly higher than that of the urban area by ANOVA (p<0.05), but by ANCOVA, the difference was no longer significant. Carbohydrate, niacin, folic acid, vitamin B6, iron, sodium and fiber intakes did not show any regional differences by both ANOVA and ANCOVA models. The result of sodium intake after adjustment of SES variables, however, showed highest intake in the factory area. Just for the male participants, differences of fat, vitamin C, vitamin E, thiamin, riboflavin, iron and cholesterol intakes were not significant among regions while protein, vitamin A and calcium intakes were higher in the urban area and lower in the rural area. After SES variables were controlled in ANCOVA model for male participants, protein, vitamin A and calcium intakes remained lowest in the rural area. For the women, regional differences of energy-adjusted nutrient intakes were similar to those of the total participants except for protein and niacin by both ANOVA and ANCOVA. Energy-adjusted protein and niacin intakes of the women were higher in the factory area (p<0.05). Sodium intake also showed significantly higher intake in the factory area after adjustment with SES as the case of the total participants.
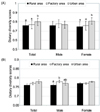
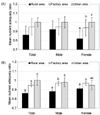
Fig. 1 presents DDS of the participants by regions and by sex before and after adjustment with age, income and energy intake levels. DDS were higher in the urban area for total participants and women (p<0.05), but for men, DDS was not different by regions before SES variables and energy were adjusted. After adjustment with covariates, the results showed completely different significance. Only male showed different DDS (higher in the factory area) while total and female participants did not show significant differences. Fig. 2 shows MAR of the participants by regions and by sex before and after adjustment with age, income and energy intake levels. MAR was different only for women before adjustment with covariates. However, MARs of rural participants were lowest for total, men and women after adjustment with age, income and energy intakes (p<0.05).
Discussion
Previous studies showed that selected health outcomes are dependent on adequate nutrient intakes, which rely highly on dietary quality (Foote et al., 2004; Haines et al., 1999; Kim et al., 2003), dietary diversity (Guthrie & Scheer, 1981; Hatloy et al., 1998; Kant et al., 1991, 1993; Krebs-Smith et al., 1987) or both parameters (Bernstein et al., 2002; Drewnowski et al., 1997). Diet quality varies widely depending on the target population, since dietary habits are complex in nature and influenced by many factors. The Korean rural population exhibits a distinct pattern of food choices (Ministry of Health and Welfare, 2002) and Korea shows a unique pattern in dietary intake in terms of a lower proportion of energy from fat compared to both developed and developing countries (Lee et al., 2002). In this study, we described the nutrient intakes, dietary diversity (DDS), dietary quality (MAR) and health related behaviors of Asan residents. This population is unique since Asan has regionally unique features so that the results of the current study may not be applicable to others residing in urban communities or geographical locations.
Our results showed that social economic status (SES) of Asan residents was significantly different by different regions. Urban residents were significantly younger than rural or factory areas. As Korea becomes industrialized, urbanization is more prompt and the tendency of urbanization is not different in Asan. The younger urban resident showed higher education and income levels. About 50% of the participants of the present study were older than 65 years, and their education and income levels were lower than the Korean averages. Sixty-four percent of the total participants were educated up to the elementary school level only, with this increasing to 88% among those who are older than 65 years (data not shown). Therefore, the general SES of Asan residents is lower than the Korean average, with urban residents being the youngest and highest in education and income levels compared to rural or factory areas. Rural and factory area residents did not show much difference in education and income levels although there were more elderly residents in the factory area.
The energy intake and quantitative dietary diversity for the one-day diets was not high in this population even though all foods from mixed dishes were included after decomposition. Only urban women showed the similar energy intake level compared to older women (aged from 50 to 64 y) living in big cities (Chung et al., 2005). However, diet quality (MAR) of urban residents went up to 1.00 while other area residents showed MAR being 0.86 for rural and 0.95 for factory residents. The difference of MAR became significant for all participants regardless of sex after the SES factors were controlled. Therefore, the true regional differences in quality of diet exist in the population of Asan, and public health strategies to improve diet quality of rural residents should be considered. The proportion of carbohydrate contributing to energy intake was very high (69%, data not shown) and that of fat was very low (15% vs. 19% Korean national average; Ministry of Health and Welfare, 2002). This high proportion of energy intake from carbohydrate may have limited the selection of foods from other groups in our population. The 1998 Korean National Health and Nutrition Survey found that the 30 most-consumed foods were similar in all areas except for rural areas, where three different kinds of kimchi were included in the top-10 most-consumed foods (Ministry of Health and Welfare, 2002). Many participants in the present study, especially older women from the rural area, reported that they consumed rice and kimchi almost exclusively, with few animal products and fresh fruits (data not shown). The limited food choices resulting in a low dietary diversity may be related to the insufficient intake of essential nutrients in the Korean rural population including the rural and factory area participants of this study. Especially, after the SES factors were controlled, significantly low DDS of rural men reflect the poor quality of diet among this population. The current major concerns in Korea as in many other countries are over nutrition and excess intakes of certain nutrients and foods rather than under nutrition (Ministry of Health and Welfare, 2002). However, our results demonstrated that insufficient intakes of essential nutrients such as protein, vitamin A and E, riboflavin and calcium are still a problem in the rural area of Asan even after SES was controlled. Therefore, Korean nutrition concerns should focus on dietary quality including both the concepts of nutrient deficiency and over nutrition. Especially, significantly low dietary diversity of rural men and low quality measured with MAR of rural men and women are of particular concern.
Other health behaviors such as drinking, physical activity and perceived stress levels were much better among rural or factory residents compared to the urban residents, although exercise habits and perceived health were better in urban residents. Another study by Chung et al. (2005) with Korean National data also reported that self-rated usual activity showed higher in the rural area while higher exercise rate in the urban areas. Therefore, the urban area residents of Asan showed better nutrient intakes, dietary quality and exercise habits, which may result in the better perceived health compared to the rural or factory area residents of Asan. The rural or factory area residents of Asan showed much less perceived stress, however, even though nutrient intakes and dietary quality were not as good as urban residents. The rural life style would produce less stress than urban life. Urban residents reported higher perceived stress even if they exercised more, ate better diets and showed better perceived health.
In conclusion, SES and quality of life measured by diet intakes and perceived health were lower in the rural area residents of Asan. Therefore, in order to achieve better quality of life and health status of the rural residents of Asan, improving diet quality is essential. For the urban resident, however, despite of higher SES and diet quality, their perceived stress was higher. Therefore, health promotion education to reduce the stress levels for urban residents of Asan should be recommended.
 XML Download