Abstract
Purpose
Materials and Methods
Results
References
Figures and Tables
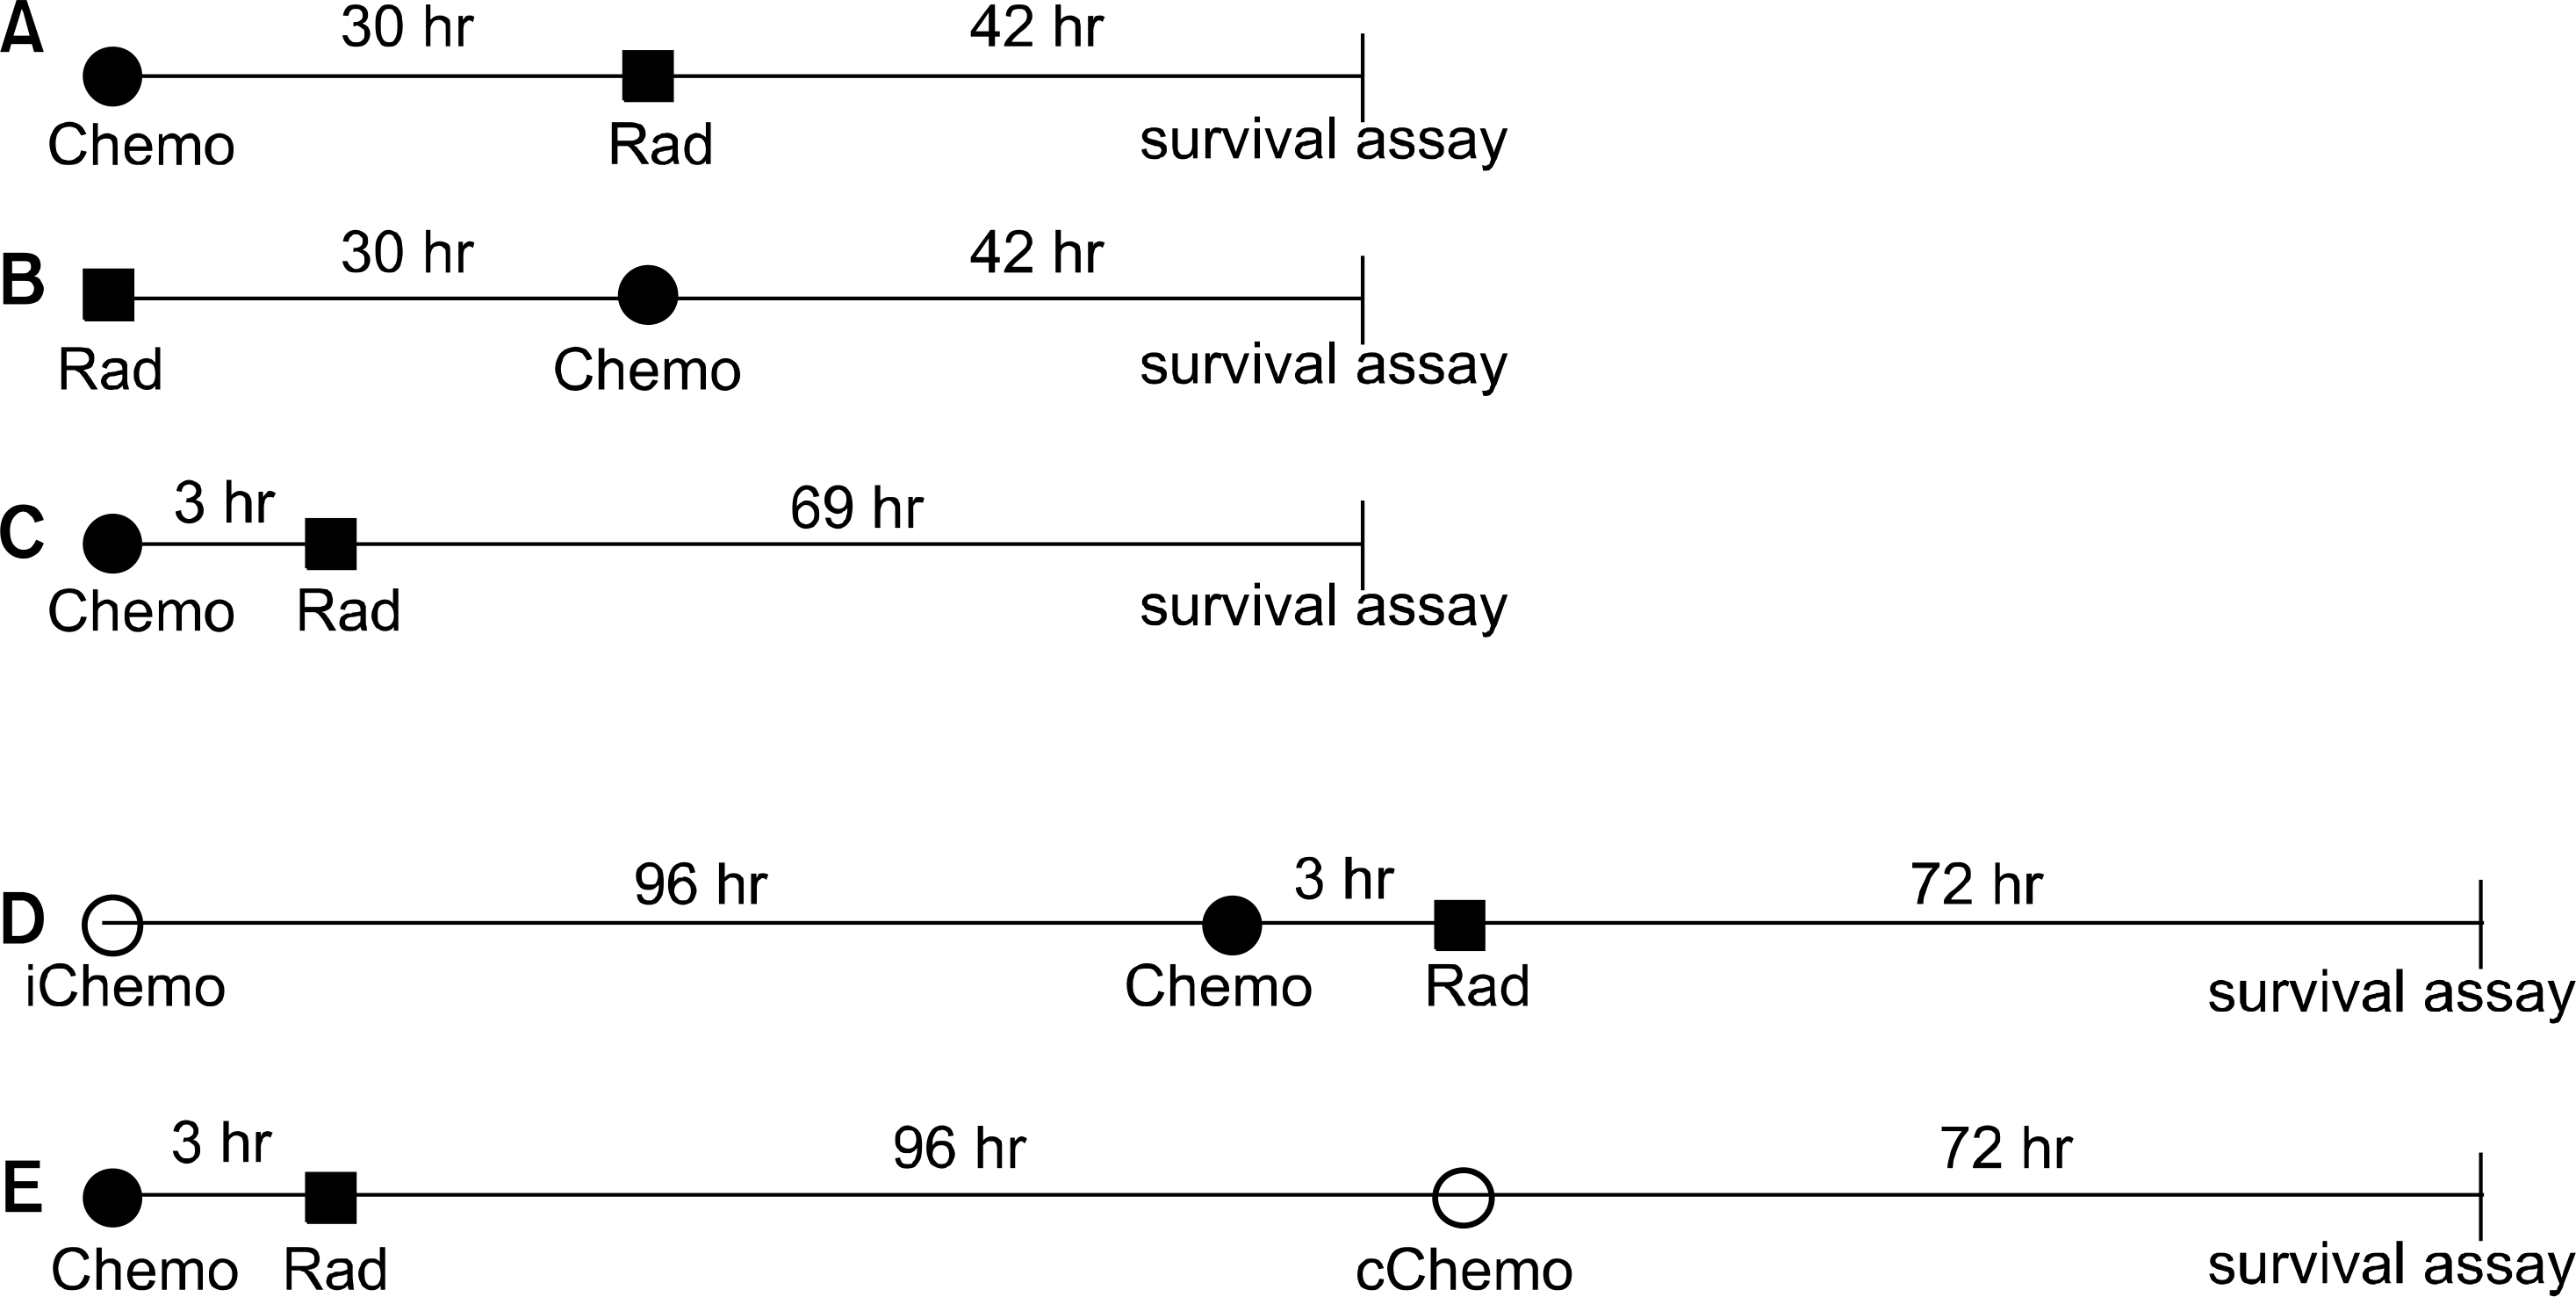
 | Fig. 1.Schematic diagram of the experimental designs in this study. After the indicated treatment, the cells were processed for clonogenic survival using a MTT assay. Chemo: chemotherapy, Rad: radiation, iChemo: induction chemotherapy, cChemo: consolidation chemotherapy, MTT: 3-(4,5-Dimethyl-thiazol-2-yl)-2,5-diphenyltetrazoliu mbromide. |
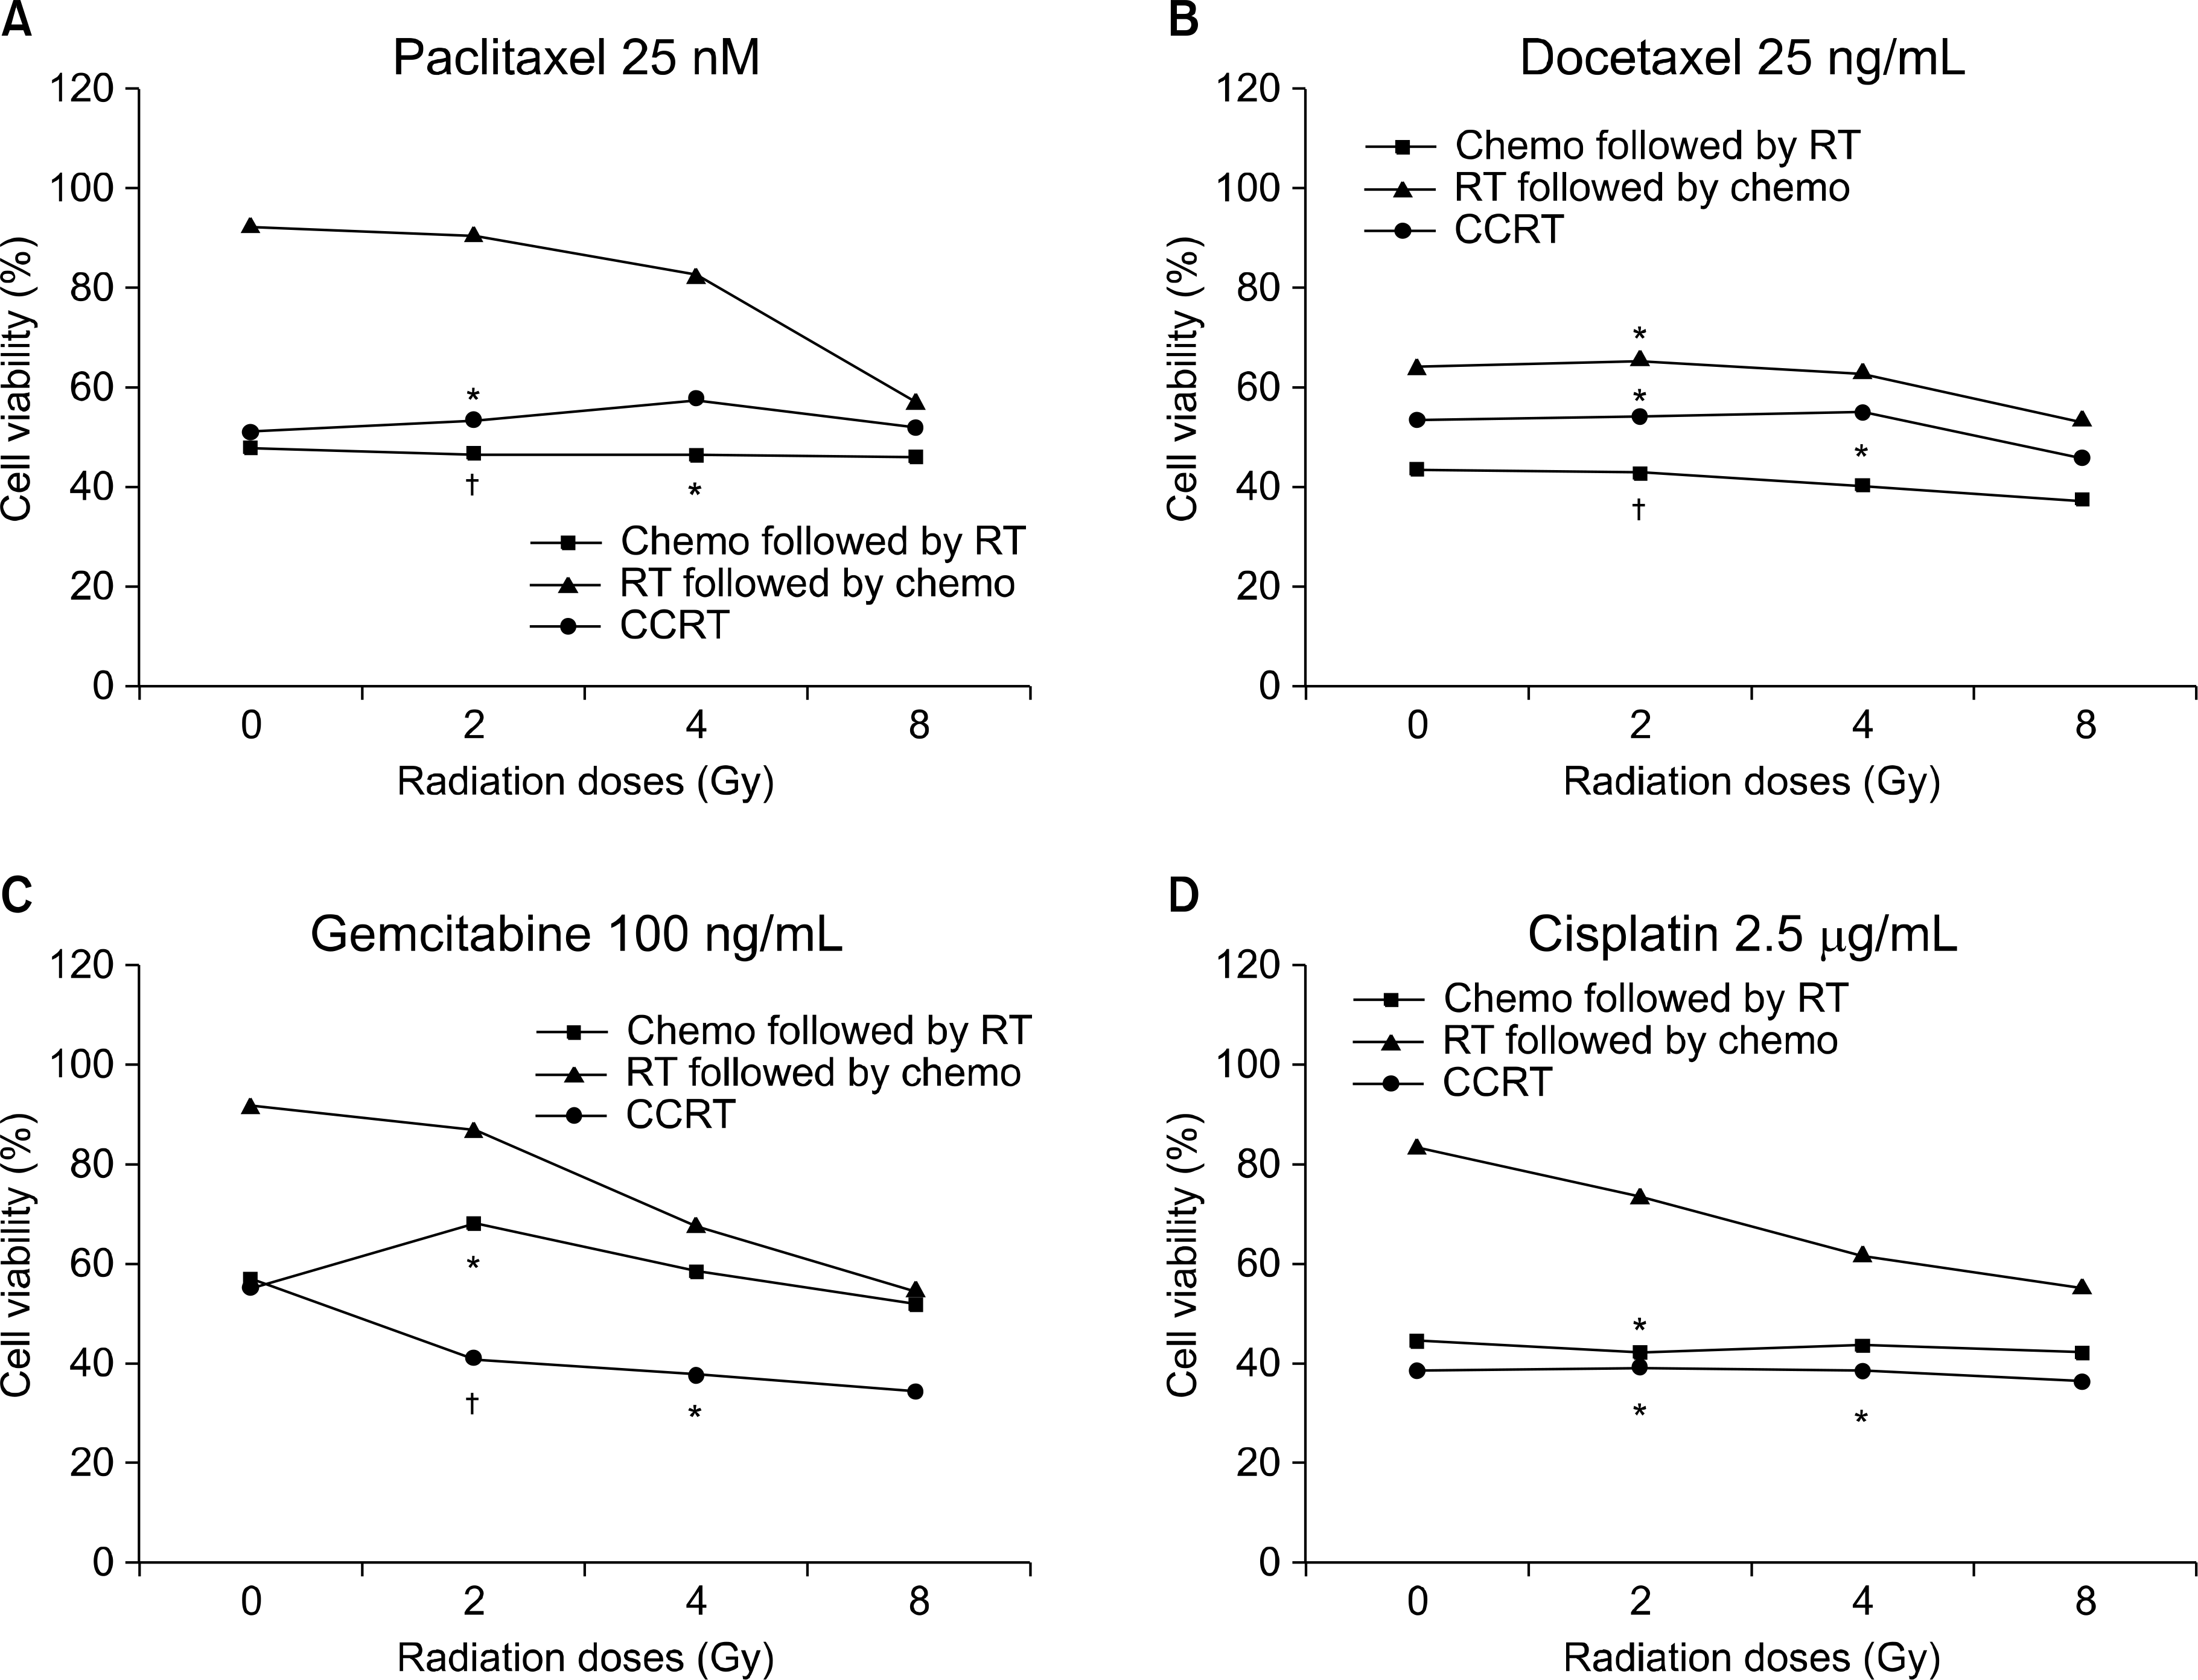
 | Fig. 2.Sequence-dependent antiproliferative effects at various concentrations of chemotherapeutic agents in the NCI-H520 cell line. The cell viabilities are shown on (A) paclitaxel 25 nM, (B) docetaxel 25 ng/mL, (C) gemcitabine 100 ng/mL, and (D) cisplatin 5 g/mL, respectively. *synergism (CI values of 0.7 to 0.3), † strong synergism (CI values less than 0.3). |
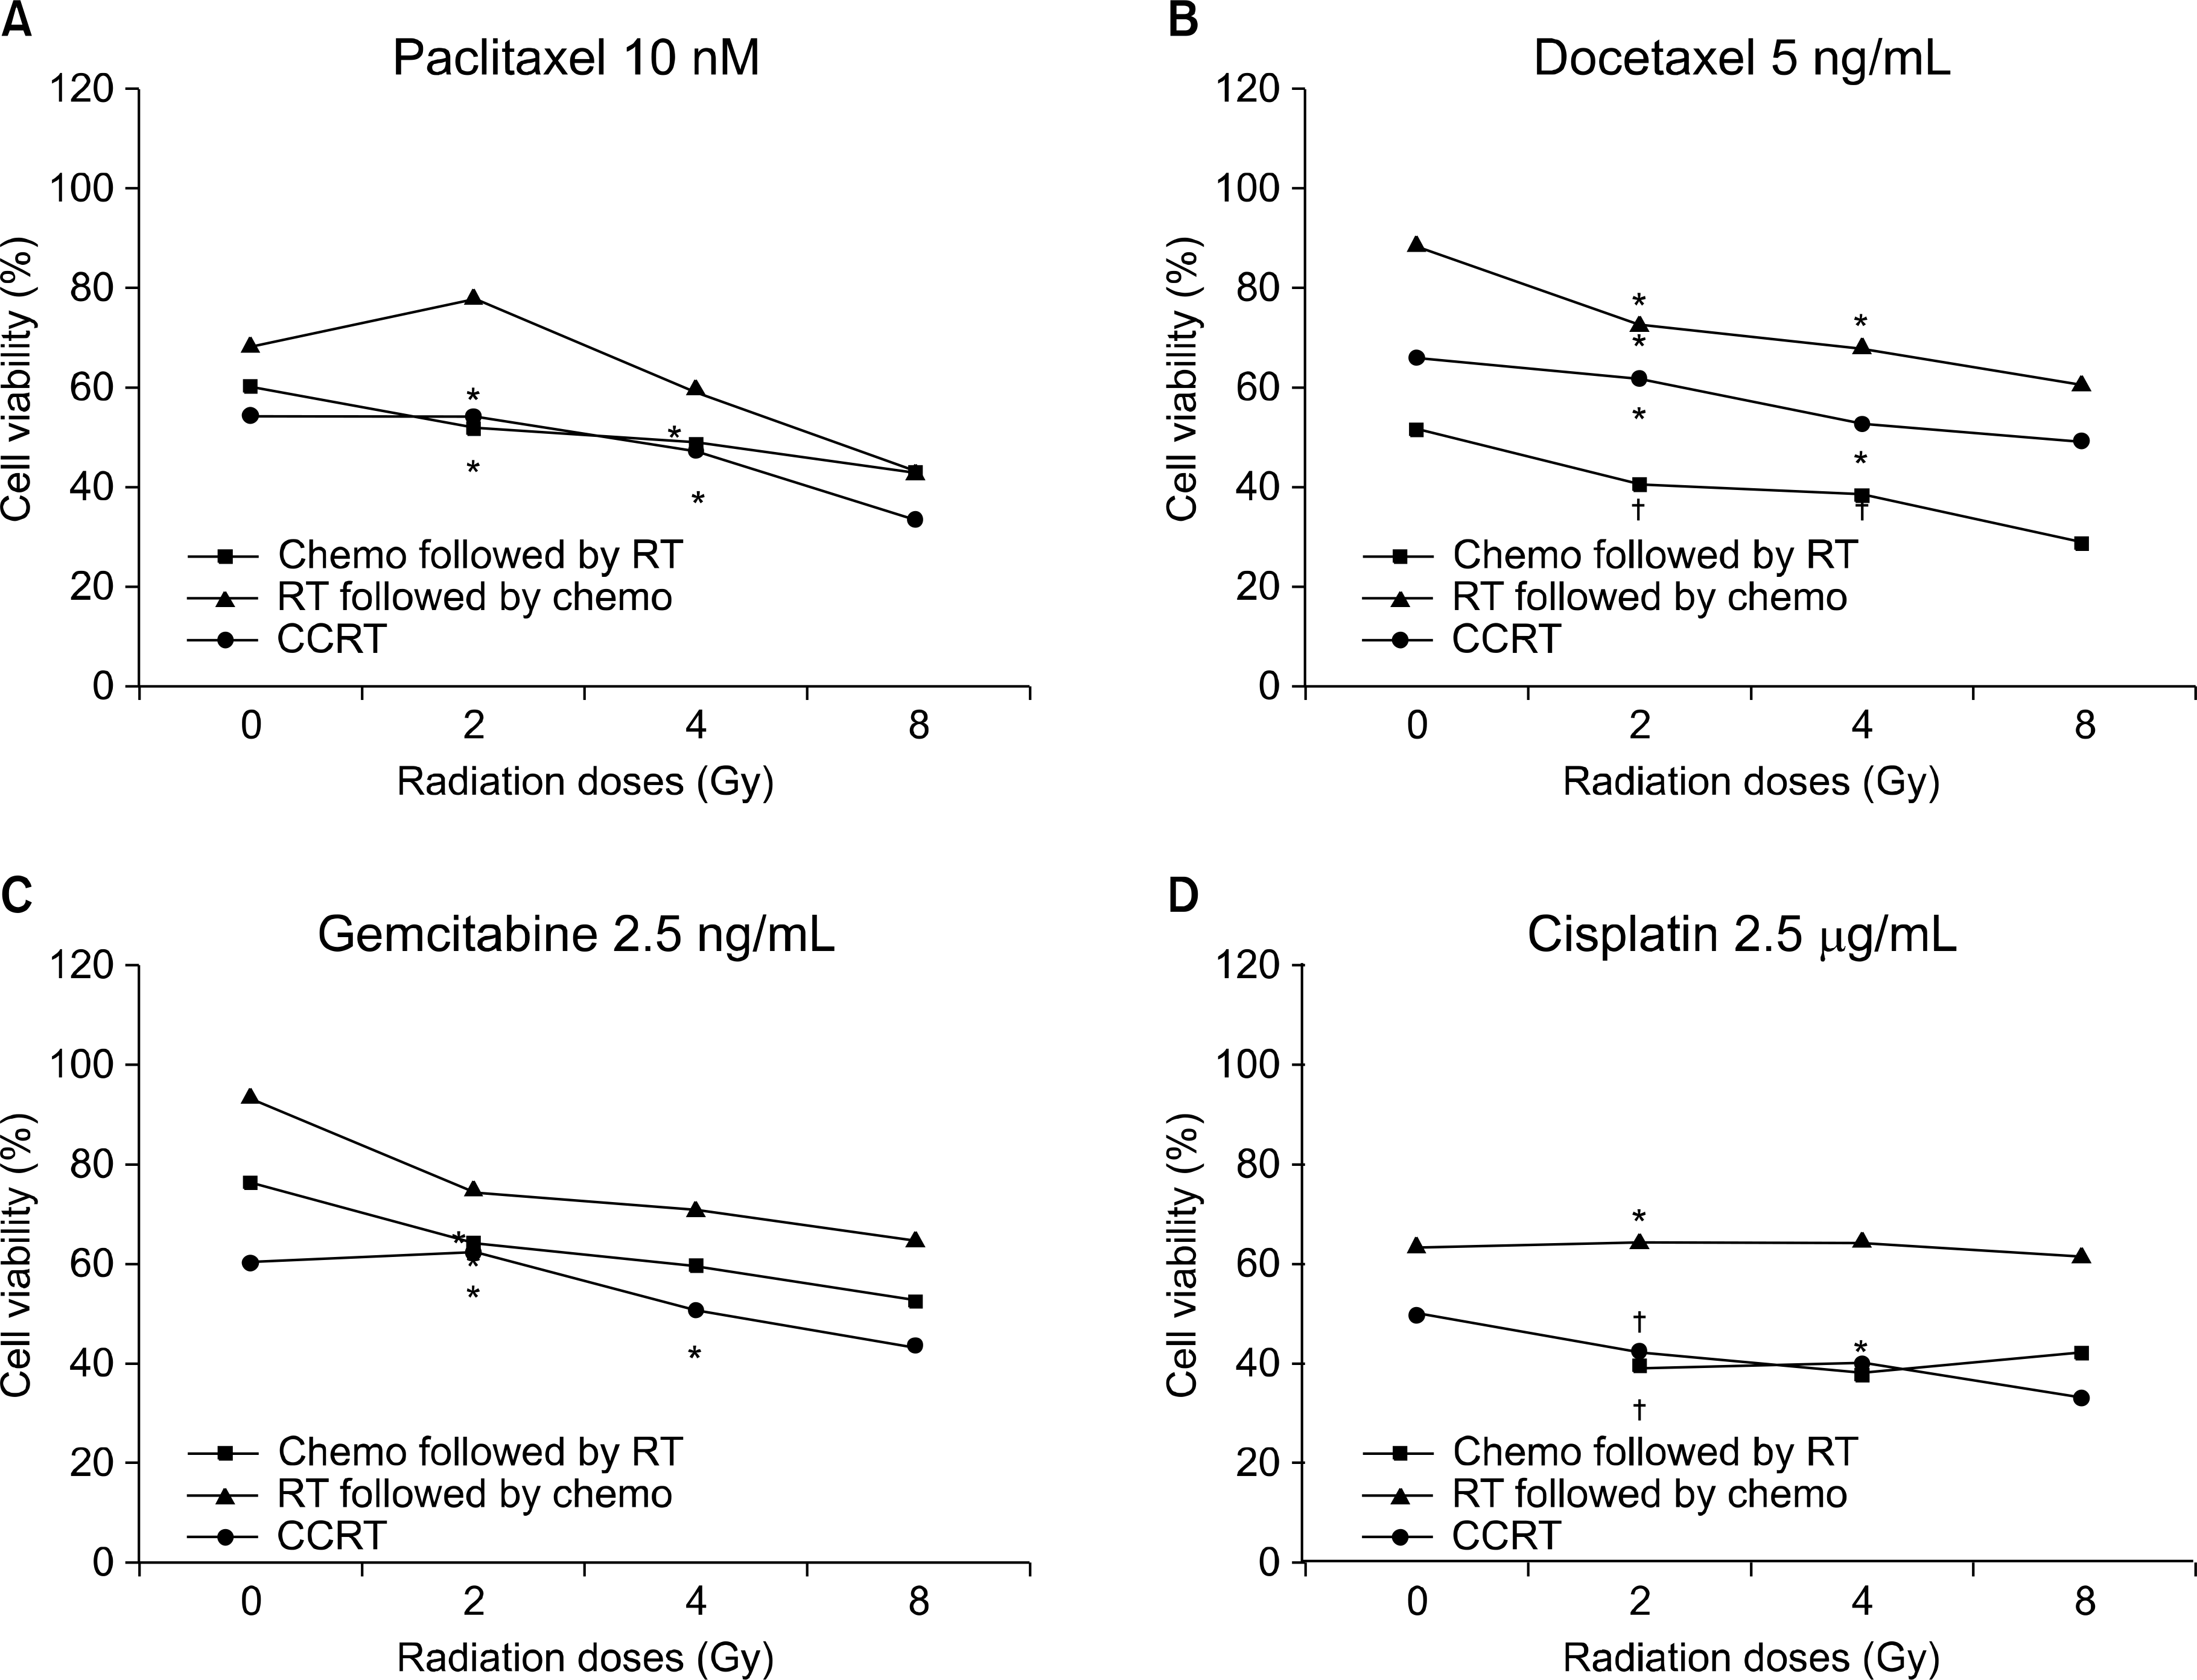
 | Fig. 3.Sequence-dependent antiproliferative effects according to the various concentrations of chemotherapeutic agents in the A549 cell line. The cell viability is shown on (A) paclitaxel 10 nM, (B) docetaxel 5 ng/mL, (C) gemcitabine 2.5 ng/mL, and (D) cisplatin 2.5 g/mL, respectively. *synergism (CI values of 0.7 to 0.3), † strong synergism (CI values less than 0.3). |
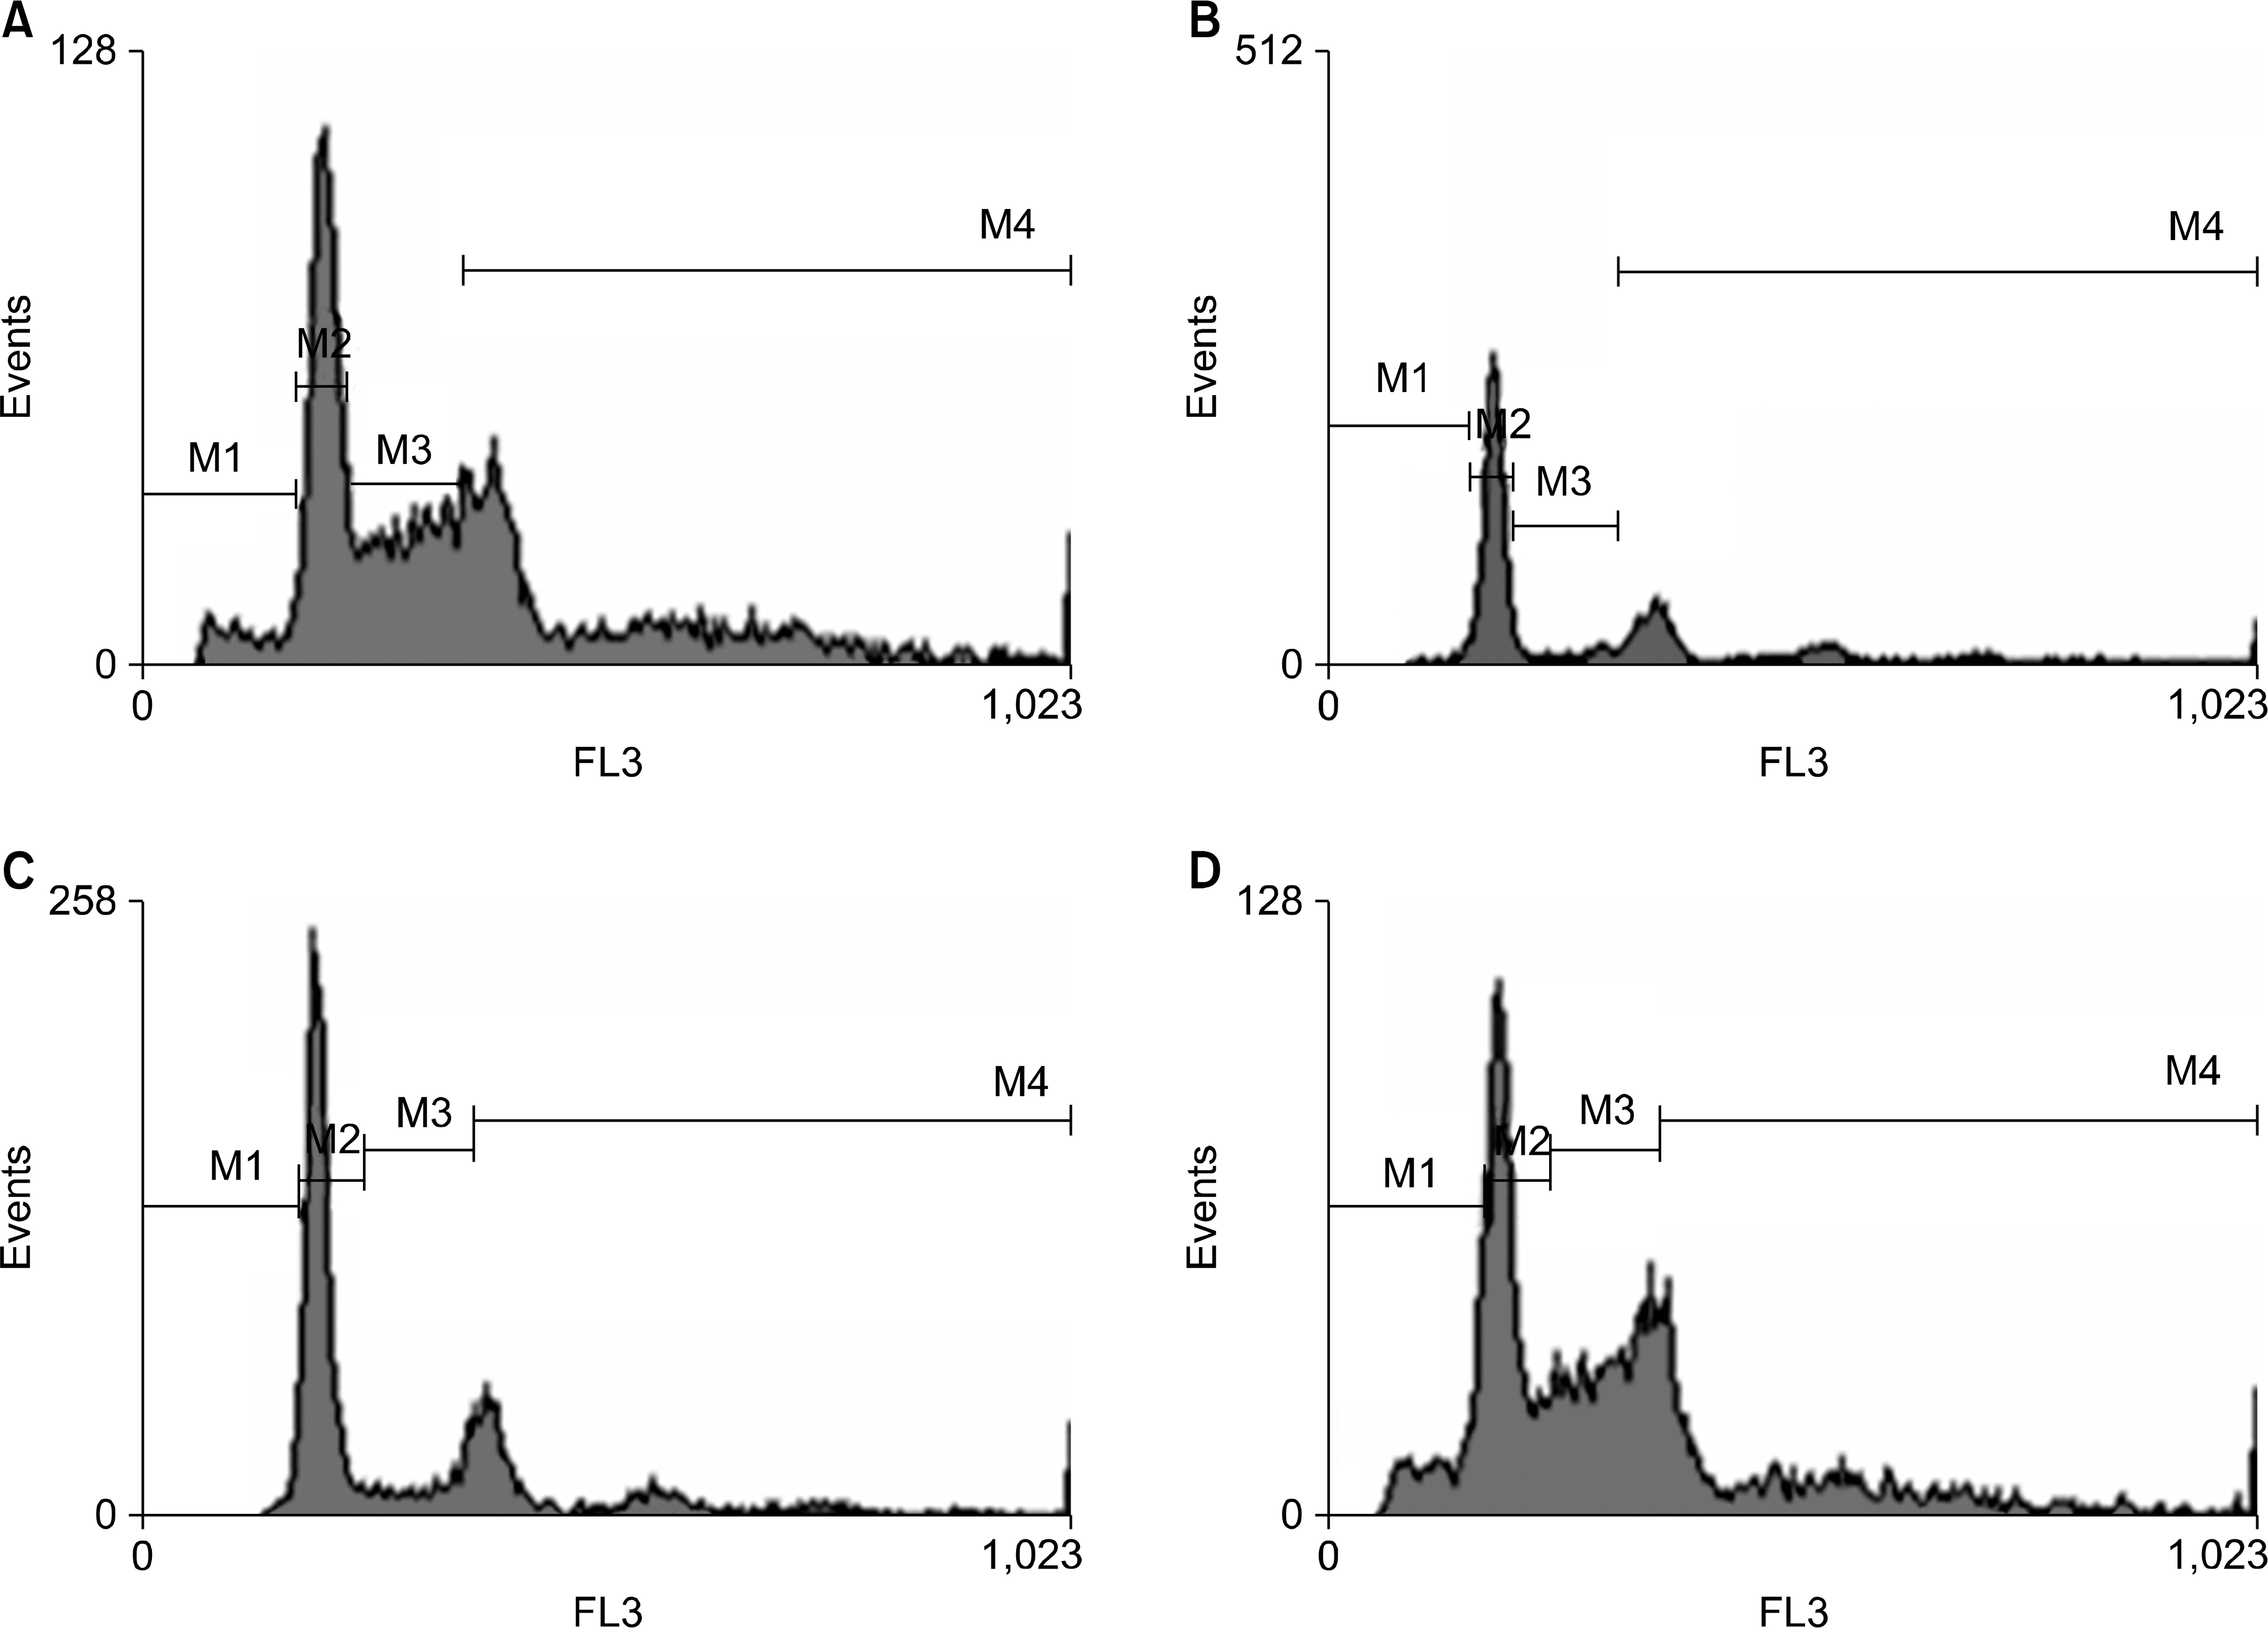
 | Fig. 4.Flow cytometry analysis of the cell cycle on the A549 cell line. Among (A) only gemcitabine 2.5 ng/mL, (B) radiation 4 Gy followed by gemcitabine 2.5 ng/mL, (C) gemcitabine 2.5 ng/mL followed by radiation, and (D) CCRT with gemcitabine, the greatest apoptotic peak is shown in CCRT. M1: sub G1-phase, M2: G1-phase, M3: S-phase, M4: G2/M-phase. |
Table 1.
| Drugs | Sequences | RT (Gy) | (A) ChemoRT | (B) RTchemo | (C) CCRT | |||
|---|---|---|---|---|---|---|---|---|
| Viability (%) | CI | Viability (%) | CI | Viability (%) | CI | |||
| Paclitaxel | 10 nM | 2 | 69.23 | 0.51* | 93.10 | 1.82 | 59.80 | 0.39* |
| 4 | 60.28 | 0.78 | 77.28 | 1.35 | 61.99 | 0.82 | ||
| 8 | 61.25 | 1.60 | 61.54 | 1.62 | 54.53 | 1.34 | ||
| 25 nM | 2 | 46.64 | 0.27† | 90.90 | 1.45 | 53.13 | 0.32* | |
| 4 | 46.16 | 0.54* | 83.14 | 1.74 | 57.83 | 0.73 | ||
| 8 | 46.33 | 1.08 | 57.75 | 1.46 | 52.02 | 1.25 | ||
| Docetaxel | 10 ng/mL | 2 | 56.22 | 0.33* | 85.36 | 1.95 | 61.82 | 0.42* |
| 4 | 53.56 | 0.60* | 79.56 | 2.28 | 59.13 | 0.75 | ||
| 8 | 53.05 | 1.19 | 63.18 | 1.77 | 54.22 | 1.24 | ||
| 25 ng/mL | 2 | 42.65 | 0.21† | 65.87 | 0.50* | 53.71 | 0.30* | |
| 4 | 39.96 | 0.39* | 62.89 | 1.87 | 55.23 | 0.64* | ||
| 8 | 37.03 | 0.70 | 53.90 | 1.22 | 45.97 | 0.93 | ||
| Gemcitabine | 50 ng/mv | 2 | 84.44 | 0.95 | 92.00 | 1.47 | 75.16 | 0.68* |
| 4 | 80.88 | 1.65 | 70.97 | 1.21 | 59.74 | 0.91 | ||
| 8 | 67.78 | 2.22 | 62.58 | 1.95 | 53.87 | 1.59 | ||
| 100 ng/mL | 2 | 67.74 | 0.55* | 87.11 | 1.08 | 41.40 | 0.29† | |
| 4 | 59.06 | 0.90 | 67.94 | 1.11 | 38.52 | 0.56* | ||
| 8 | 53.23 | 1.57 | 55.30 | 1.64 | 34.76 | 1.02 | ||
| Cisplatin | 2.5 g/mL | 2 | 42.01 | 0.36* | 73.87 | 0.92 | 39.60 | 0.34* |
| 4 | 43.26 | 0.75 | 61.89 | 1.26 | 38.71 | 0.67* | ||
| 8 | 41.82 | 1.66 | 55.37 | 2.42 | 36.35 | 1.42 | ||
| 5.0 g/mL | 2 | 29.37 | 0.25† | 59.82 | 0.59* | 22.78 | 0.24† | |
| 4 | 26.50 | 0.46* | 46.72 | 0.83 | 26.96 | 0.47* | ||
| 8 | 25.16 | 1.00 | 42.68 | 1.70 | 26.68 | 1.05 | ||
(A) Chemotherapy followed by radiation, (B) radiation followed by chemotherapy, and (C) concurrent chemoradiation (CCRT). The combination index (CI) values were calculated using the Chou and Talalay mathematical model for drug interactions on Calcusyn software. A CI was equal to 1 denotes additivity; antagonism if the CI>1; CI values between 1 and 0.7 indicate slight synergism;
Table 2.
| Drugs | Sequences | RT (Gy) | (A) ChemoRT | (B) RTchemo | (C) CCRT | |||
|---|---|---|---|---|---|---|---|---|
| Viability (%) | CI | Viability (%) | CI | Viability (%) | CI | |||
| Paclitaxel | 5 nM | 2 | 79.57 | 1.25 | 78.50 | 1.18 | 63.66 | 0.61* |
| 4 | 57.01 | 0.95 | 68.38 | 1.47 | 58.39 | 1.00 | ||
| 8 | 45.80 | 1.27 | 54.81 | 1.75 | 42.09 | 1.11 | ||
| 10 nM | 2 | 52.05 | 0.40* | 78.22 | 1.16 | 53.88 | 0.42* | |
| 4 | 48.63 | 0.70* | 59.95 | 1.06 | 47.71 | 0.68* | ||
| 8 | 42.32 | 1.12 | 42.75 | 1.14 | 33.78 | 0.81 | ||
| Docetaxel | 2.5 ng/mL | 2 | 62.82 | 0.32* | 79.51 | 0.68* | 65.67 | 0.36* |
| 4 | 61.48 | 0.61* | 70.46 | 0.87 | 61.10 | 0.60* | ||
| 8 | 47.43 | 0.80 | 63.30 | 1.42 | 57.06 | 1.13 | ||
| 5.0 ng/mL | 2 | 40.58 | 0.14† | 73.06 | 0.49* | 61.30 | 0.30* | |
| 4 | 38.64 | 0.27† | 68.17 | 0.49* | 52.71 | 0.44* | ||
| 8 | 28.34 | 0.38* | 61.27 | 1.32 | 49.53 | 0.86 | ||
| Gemcitabine | 2.5 ng/mL | 2 | 63.65 | 0.45* | 74.86 | 0.73 | 62.49 | 0.43* |
| 4 | 59.75 | 0.78 | 71.33 | 1.24 | 50.50 | 0.56* | ||
| 8 | 52.90 | 1.37 | 65.57 | 2.21 | 43.73 | 0.99 | ||
| 5.0 ng/mL | 2 | 38.69 | 0.18† | 66.82 | 0.51* | 48.00 | 0.26† | |
| 4 | 43.26 | 0.43* | 71.98 | 1.28 | 47.37 | 0.50* | ||
| 8 | 34.46 | 0.70 | 50.06 | 1.24 | 28.32 | 0.54* | ||
| Cisplatin | 1.0 g/mL | 2 | 67.61 | 0.62* | 81.12 | 1.12 | 64.04 | 0.55* |
| 4 | 63.78 | 1.09 | 77.94 | 1.91 | 63.43 | 1.07 | ||
| 8 | 59.76 | 2.18 | 76.50 | 4.09 | 57.81 | 2.04 | ||
| 2.5 g/mL | 2 | 40.16 | 0.25† | 65.03 | 0.57* | 42.58 | 0.27† | |
| 4 | 39.12 | 0.48* | 64.70 | 1.12 | 40.25 | 0.50* | ||
| 8 | 41.93 | 1.22 | 62.37 | 2.38 | 33.68 | 0.92 | ||
(A) Chemotherapy followed by radiation, (B) radiation followed by chemotherapy, and (C) concurrent chemoradiation. The combination index (CI) values were calculated using the Chou and Talalay mathematical model for drug interactions on Calcusyn software. A CI was equal to 1 denotes additivity; antagonism if the CI>1; CI values between 1 and 0.7 indicate slight synergism;
Table 3.
| Drugs | Sequences | RT (Gy) | High-dose conc. | (A) Induction chemotherapy | (B) Consolidation chemotherapy | ||
|---|---|---|---|---|---|---|---|
| Viability (%) | CI | Viability (%) | CI | ||||
| Paclitaxel 5 nM | 2 | +10 nM | 64.06 | 1.04 | 58.45 | 1.17 | |
| 4 | 49.67 | 0.90 | 38.69 | 1.33 | |||
| 8 | 44.15 | 1.18 | 36.97 | 2.04 | |||
| 2 | +15 nM | 56.68 | 0.66* | 35.49 | 0.61* | ||
| 4 | 44.13 | 0.67* | 27.60 | 0.94 | |||
| 8 | 41.51 | 1.04 | 24.91 | 1.37 | |||
| Docetaxel 1 ng/mL | 2 | +2 ng/mL | 59.86 | 0.27† | 74.08 | 1.12 | |
| 4 | 65.66 | 0.66* | 56.32 | 1.40 | |||
| 8 | 51.94 | 0.85 | 54.23 | 2.22 | |||
| 2 | +3 ng/mL | 57.18 | 0.25† | 53.78 | 0.66* | ||
| 4 | 59.95 | 0.54* | 43.58 | 1.03 | |||
| 8 | 52.70 | 0.87 | 40.81 | 1.61 | |||
| Gemcitabine 50 ng/mL | 2 | +100 ng/mL | 62.56 | 0.55* | 59.11 | 0.72 | |
| 4 | 55.90 | 0.87 | 63.49 | 1.61 | |||
| 8 | 49.21 | 1.25 | 58.28 | 2.38 | |||
| 2 | +150 ng/mL | 49.76 | 0.36* | 29.60 | 0.36* | ||
| 4 | 50.90 | 0.74 | 37.96 | 0.88 | |||
| 8 | 42.99 | 1.03 | 25.88 | 1.06 | |||
| Cisplatin 0.5 g/mL | 2 | +1.0 g/mL | 48.19 | 0.37* | 50.49 | 0.71 | |
| 4 | 48.39 | 0.74 | 42.73 | 0.71 | |||
| 8 | 38.52 | 0.72 | 39.82 | 1.00 | |||
| 2 | +1.5 g/mL | 48.26 | 0.37* | 41.43 | 0.39* | ||
| 4 | 47.07 | 0.67* | 37.36 | 0.47* | |||
| 8 | 38.35 | 0.71 | 32.87 | 0.65* | |||
(A) High-dose induction chemotherapy followed by CCRT, (B) CCRT followed by high-dose consolidation chemotherapy. The combination index (CI) values were calculated using the Chou and Talalay mathematical model for drug interactions on Calcusyn software. A CI was equal to 1 denotes additivity; antagonism if the CI >1; CI values between 1 and 0.7 indicate slight synergism;
Table 4.
| Sequences | High-dose conc. | (A) Induction chemotherapy | (B) Consolidation chemotherapy | |||
|---|---|---|---|---|---|---|
| Drugs | RT (Gy) | Viability (%) | CI | Viability (%) | CI | |
| Paclitaxel 5 nM | 2 | +10 nM | 78.58 | 0.35* | 52.71 | 0.54* |
| 4 | 67.85 | 0.44* | 56.04 | 1.20 | ||
| 8 | 54.71 | 0.59* | 57.76 | 2.05 | ||
| 2 | +15 nM | 78.48 | 0.34* | 48.16 | 0.47* | |
| 4 | 65.79 | 0.41* | 50.30 | 1.01 | ||
| 8 | 52.09 | 0.54* | 51.13 | 1.68 | ||
| Docetaxel 1 ng/mL | 2 | +2 ng/mL | 86.35 | 0.53* | 78.22 | 0.75 |
| 4 | 81.32 | 0.77 | 81.35 | 1.86 | ||
| 8 | 66.14 | 0.84 | 82.33 | 3.40 | ||
| 2 | +3 ng/mL | 84.04 | 0.45* | 67.74 | 0.42* | |
| 4 | 80.95 | 0.76 | 75.25 | 1.25 | ||
| 8 | 64.68 | 0.80 | 75.54 | 2.20 | ||
| Gemcitabine 2.5 ng/mL | 2 | +5 ng/mL | 52.35 | 0.63* | 40.36 | 0.58* |
| 4 | 43.91 | 0.91 | 39.42 | 1.12 | ||
| 8 | 40.42 | 1.28 | 34.15 | 1.48 | ||
| 2 | +7.5 ng/mL | 38.66 | 0.37* | 29.69 | 0.40* | |
| 4 | 33.21 | 0.59* | 26.22 | 0.70* | ||
| 8 | 26.57 | 0.72 | 24.89 | 1.05 | ||
| Cisplatin 0.5 g/mL | 2 | +1.0 g/mL | 58.57 | 0.50* | 40.51 | 0.56* |
| 4 | 57.75 | 0.97 | 43.05 | 1.19 | ||
| 8 | 56.89 | 1.56 | 38.39 | 1.67 | ||
| 2 | +1.5 g/mL | 47.86 | 0.33* | 27.61 | 0.38* | |
| 4 | 40.97 | 0.50* | 27.58 | 0.77 | ||
| 8 | 36.83 | 0.71 | 26.62 | 1.17 | ||
(A) High-dose induction chemotherapy followed by CCRT, (B) CCRT followed by high-dose consolidation chemotherapy. The combination index (CI) values were calculated using the Chou and Talalay mathematical model for drug interactions on Calcusyn software. A CI was equal to 1 denotes additivity; antagonism if the CI >1; CI values between 1 and 0.7 indicate slight synergism;


 PDF
PDF ePub
ePub Citation
 Print
Print


 XML Download