

 PDF
PDF ePub
ePub Citation
 Print
Print


Introduction
Some pharmacologic agents have been shown to have water-retaining properties. Whereas the antidiuretic actions are used to advantage in the treatment of patients with diabetes insipidus, there have been numerous reports of serious water retention and dilutional hyponatremia as a consequence of the water-retaining drugs1). Thus, hyponatremia is one of the common electrolyte abnormalities induced by drugs.
Cyclophosphamide is an alkylating agent that is useful for the treatment of malignancy and rheumatologic disease. It can produce an antidiuretic effect when injected intravenouisly into water-loaded patients2,3). We recently reported that cyclophosphamide-induced hyponatremia is not rare even when low-dose pulse cyclophosphamide is used4). However, the mechanisms by which cyclophosphamide induces water retention in the kidney have not been defined.
The main water channels participating in water conservation along the renal tubule are aquaporin-1 (AQP1) and aquaporin-2 (AQP2). AQP1 is abundant in the apical and basolateral membranes of renal proximal tubules and descending thin limbs. AQP2 is localized in the apical membrane and in intracellular vesicles which are targeted to the apical plasma membranes when stimulated by vasopressin5). The traditional view was that some drugs including cyclophosphamide may potentiate the action of vasopressin on the kidney, but this explanation has never been verified in cases with cyclophosphamide-induced water retention.
In this study, we hypothesized that in producing water retention in the proximal tubule and Henle's thin descending limb, the AQP1 water channel may have a role in cyclophosphamide-induced hyponatremia. To test this hypothesis, the expression of AQP1 was investigated both in vivo and in vitro after the administration of cyclophosphamide and its active metabolite 4-hydroperoxycyclophosphamide (4-HC), respectively.
Go to : 
Materials and Methods
1. Animal experiments of cyclophosphamide administration
Specific pathogen-free male Sprague-Dawley rats (Orient Bio Inc., Seongnam, Korea) weighing 240-260 g, were used for two animal experiments of single cyclophosphamide administration. For the short-term 3-day study (Animal Experiment I), different doses (12, 24, 48, and 96 mg/kg BW) of intraperitoneal cyclophosphamide were administered to rats in Animal Experiment I. Control rats received an injection of the vehicle (normal saline) solution only. All rats were provided with a gelled agar (1%) diet, so that adequate water loading (52 mL/200 g BW per day) and a fixed amount of daily regular rat chow (18 g/200 g BW per day) were given to each rat. In addition, they were freely accessible to drinking water.
For the long-term 6-day study (Animal Experiment II), a large dose (100 mg/kg BW) of intraperitoneal cyclophosphamide was given to rats in Animal Experiment II. For water loading, drinking water containing 600 mM sucrose was supplied. Rats spontaneously drink large amounts of this fluid, causing a water diuresis6). Serum and urine samples were collected at the time each rat was killed for determination of electrolytes and osmolality. The experimental protocols were approved by the institutional Animal Care and Use Committee of Hanyang University.
2. Proximal tubular cell culture and treatment with 4-HC
Primary cultured renal proximal tubular cells (PTCs) of New Zealand White male rabbits (1.5-2.0 kg) from Dae Han Experimental Animal (Chungju, Korea) were prepared as previously described7). The PTCs were grown in DMEM/F-12 medium supplemented with 15 mM HEPES and 20 mM sodium bicarbonate (pH 7.4). Three other growth supplements (5 µg/mL insulin, 5 µg/mL transferrin, and 5×10⁻⁸ M hydrocortisone) were added immediately before the medium was used. The kidneys from a rabbit were perfused through the renal artery, first with phosphate-buffered saline (PBS) and then with medium containing 0.5% iron oxide. Renal cortical slices were prepared and homogenized. The homogenate was poured sequentially through 253- and 83-µm mesh filters. Tubules and glomeruli caught by the 83-µm filter were transferred into sterile medium. The glomeruli (which contained the iron oxide) were removed using a magnetic stir bar. The remaining proximal tubules were incubated briefly in a medium containing 0.125 mg/mL collagenase and 0.025% soybean trypsin inhibitor. The tubules were then washed by centrifugation, resuspended in a medium containing the three supplements, and transferred into tissue culture dishes. The medium was changed 1 day after plating and every 2 days thereafter. The primary cultured rabbit kidney PTCs were maintained at 37℃ in a 5% CO2 humidified environment and a serum-free basal medium amended with the 3 growth supplements.
4-HC was obtained from Niomec (Bielefeld, Germany). According to the previous study applying on the human hair follicle8), 4 different 4-HC concentrations (1, 3, 10, and 30 µmol/L) were prepared on ice in Williams' E medium immediately before use because of the short half-life of the compound9). These concentrations were previously selected to imitate relevant serum levels of 4-HC in patients receiving moderate- to high-dose cyclophosphamide therapy10-12). Cells were harvested in 1 to 3 days after the 4-HC treatment for immunoblot analysis.
3. Preparation of cytosolic and membrane fraction from PTCs
Once confluent cultures were treated according to the indicated conditions, the media was removed and PTCs were washed twice with ice-cold PBS, scraped, harvested by microcentrifugation, and resuspended in Buffer A (137 mM NaCl, 8.1 mM Na2HPO4, 2.7 mM KCl, 1.5 mM KH2PO4, 2.5 mM EDTA, 1 mM dithiothreitol, 0.1 mM phenylmethanesulfonyl fluoride, 10 µg/mL leupeptin [pH 7.5]). Resuspended cells were then lysed mechanically on ice by trituration with a 21.1-gauge needle. To prepare the cytosolic and particulate fractions, the lysates were centrifuged at 1,000 µg for 10 minutes at 4℃, after which the supernatants were centrifuged at 100,000 µg for 1 h at 4℃. The particulate fraction, which contained the membranes, was washed twice and resuspended in Buffer A containing 1% (v/v) Triton X-100. Protein levels in each fraction were quantified using the Bradford procedure13).
4. Immunoblot analysis
When each animal experiment was finished, whole kidneys or manually dissected slices of renal cortex were homogenized in a buffer containing 250 mM sucrose, 10 mM triethanolamine, 1 µg/mL leupeptin, and 0.1 mg/mL phenylmethylsulfonyl fluoride titrated to pH 7.6. Coomassie-stained "loading gels" were done to assess the quality of the protein by sharpness of the bands and to adjust protein concentrations before immunoblotting14). For immunoblotting, the proteins were transferred electrophoretically from unstained gels to nitrocellulose membranes (Bio-Rad, Hercules, CA, USA). After being blocked with 5% skim milk in PBS-T (80 mM Na2HPO4, 20 mM NaH2PO4, 100 mM NaCl, 0.1 percent Tween-20, pH 7.5) for 30 minutes, membranes were probed overnight at 4℃ with the respective primary antibodies. The secondary antibody was goat anti-rabbit IgG conjugated to horseradish peroxidase (Pierce, Rockford, IL, USA). Sites of antibody-antigen reaction were viewed using enhanced chemiluminescence substrate (ECL™ RPN 2106; Amersham Pharmacia Biotech, Buckinghamshire, UK) before exposure to X-ray film (Hyperfilm; Amersham Pharmacia Biotech, Buckinghamshire, UK). Relative quantification of the band densities from immunoblots was carried out by densitometry using a laser scanner and ImageQuaNT software (Molecular Analyst version 1.5, Bio-Rad, Hercules, CA, USA).
5. Quantitative polymerase chain reaction (QPCR)
Total RNA was isolated from the rat whole kidneys with the TRIzol® Reagent (Life Technologies, Carlsbad, CA, USA). RNA was quantified by spectrophotometry, and cDNA synthesis was performed on 3 µg of RNA with SuperScript® III Reverse Transcriptase (Life Technologies, Carlsbad, CA, USA). For quantitative polymerase chain reaction (PCR), 100 ng of cDNA served as a template for PCR amplification using Brilliant SYBR green QPCR master mix according to the manufacturer's instructions (FastStart DNA Master SYBR Green I, Roche Molecular Biochemicals). Serial dilution (1 ng-1 fg/µL) of cDNA was used as a template for generation of a standard curve. Nested primers were used to amplify standards and kidney cDNA samples as follows: GGC TTC AAT TAC CCA CTG GA (sense) and TTG ATC CCA CAG CCA GTG TA (antisense) for AQP1 (498 bp)15), TCC AGC AGT TGT CAC TGG C (sense) and TAA GCA CAG TCC CCC AGA AGG (antisense) for AQP2 (562 bp)16), CCA CAA TGG AAG GTT CTG TG (sense) and CCA ATC TCT AAG AAC CCT GT (antisense) for AQP7 (884 bp)17), and TGC TGT GAC AGG TGT GTT AGG TCA (sense) and CCA TGG TTC TGC AAA TCG GG (antisense) for vasopressin-2 receptor (625 bp)18).
Standards and unknown samples were amplified in duplicate in 96-well plates. The thermal profile of the LightCycler® Instrument (Roche Molecular Biochemicals, Mannheim, Germany) was optimized with an initial denaturation of 10 minutes at 95℃ and 40 amplification cycles with each 15 seconds at 95℃, 5 seconds at 58℃ and 10 seconds at 72℃. The comparative Ct method was used to determine the relative amounts of target-mRNA levels calculated for each sample by expressing the target-mRNA level as a percentage of GAPDH mRNA levels. Ct ratios were analyzed using the LightCycler® Software (Version 4.05). Specificity was ensured by postrun melting curve analysis.
6. Primary antibodies
For immunoblot analysis from rat kidneys, we used polyclonal antibodies against AQP1 and AQP219). They were kindly donated by Dr. Mark Knepper at the National Institutes of Health. In immunoblotting from cultured PTCs, commercially available antibodies (AQP1, Santa Cruz, cat. No. SC-20810; AQP7, Santa Cruz, cat. No. SC-28625) were used.
7. Statistics
Values are presented as means ± SE. Comparisons between cyclophosphamide-treated and control rats were performed by the Mann-Whitney U-test. P values of less than 0.05 were considered statistically significant.
Go to :
Results
1. Effects of cyclophosphamide administration on rat kidneys
Table 1 shows blood and urine data obtained on the final day of Animal Experiment I. Compared with vehicle-treated controls, the 4 different doses (12, 24, 48, and 96 mg/kg BW) of cyclophosphamide produced no significant changes in urine output, urine osmolality, plasma sodium and creatinine concentration, and creatinine clearance.
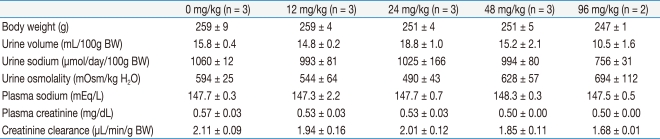
The levels of AQP1 protein expression estimated in whole kidney homogenates were 100 ± 18%, 136 ± 53%, 244 ± 38%, 614 ± 194%, and 460 ± 46% at 0, 12, 24, 48, and 96 mg/kg BW doses, respectively. Thus, high doses of cyclophosphamide administration produced significant increases in AQP1 protein expression as compared with vehicle-treated controls (P < 0.005 at 48 mg/kg BW; P < 0.05 at 96 mg/kg BW). The expression of AQP2 protein also showed an increasing tendency at high doses of cyclophosphamide but did not reach the statistical significance (Fig. 1).

Table 2 shows blood and urine data obtained on the final day of Animal Experiment II. Although body weight was steadily increased in both groups, weight gain was smaller in cyclophosphamide-treated rats than in controls (P < 0.05). Notably, cyclophosphamide-treated rats had lower plasma sodium concentration than controls (143 ± 1 vs. 146 ± 1 mEq/L, P < 0.05). However, urine output, urine osmolality and sodium concentration, plasma creatinine concentration, and creatinine clearance were not significantly different between the 2 groups.
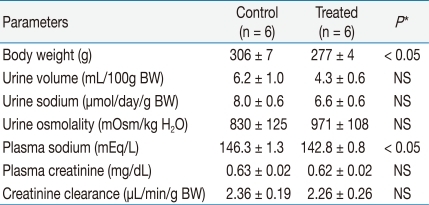
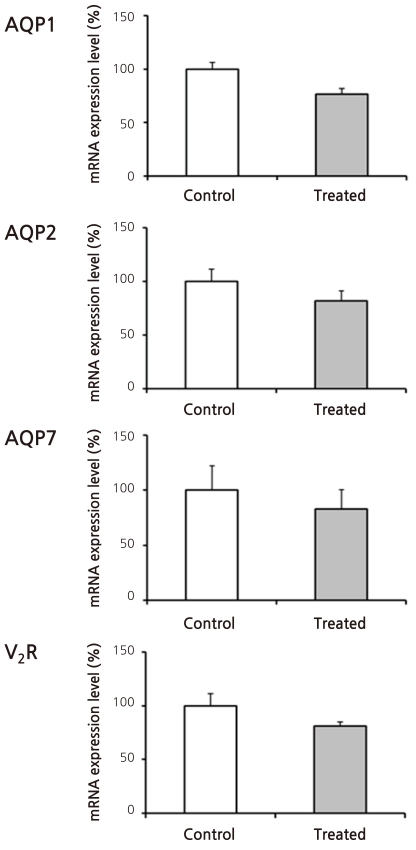
Figure 2 shows the results of immunoblot analysis for AQP1 and AQP2 from renal cortices of Animal Experiment II. Cyclophosphamide treatment caused insignificant increases in both AQP1 (136 ± 20 vs. 100 ± 23%) and AQP2 (157 ± 18 vs. 100 ± 22%) protein expression. Figure 3 illustrates the results of reverse transcription PCR for AQP1, AQP2, vasopressin-2 receptor, and aquaporin-7 (AQP7) from each RNA sample of renal cortex. QPCR, however, revealed no significant differences in mRNA levels between treated versus control rats (Fig. 4): AQP1, 75 ± 11 vs. 100 ± 21%; AQP7, 105 ± 16 vs. 100 ± 13%; AQP2, 81 ± 14 vs. 100 ± 13%; and vasopressin-2 receptor, 96 ± 33 vs. 100 ± 13%.
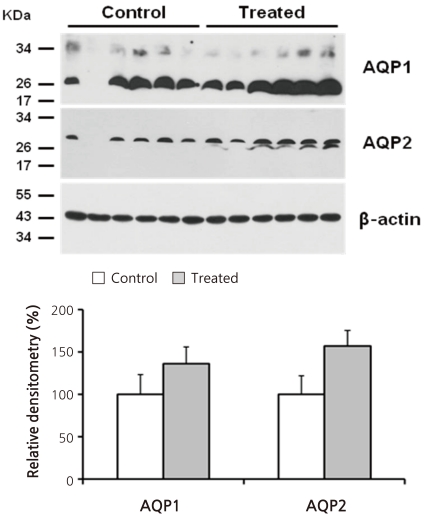 | Fig. 2Immunoblot Analysis for Aquaporin-1 (AQP1) and Aquaporin-2 (AQP2) from Rnal Cortices of Animal Experiment II. Each lane was loaded with a protein sample from a different rat. No statistically significant differences were found between the groups.
|
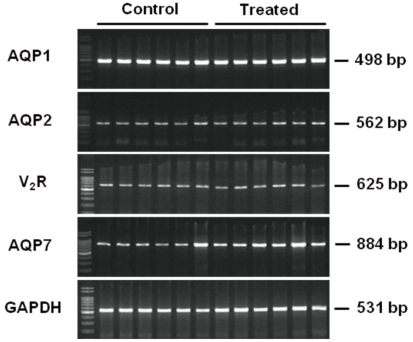 | Fig. 3Reverse Transcription Polymerase Chain Reaction (PCR) from Renal Cortices of Animal Experiment II. Each lane was loaded with a cDNA sample from a different rat. AQP1, aquaporin-1; AQP2, aquaporin-2; V2R, vasopressin-2 receptor; AQP7, aquaporin-7; GAPDH, glyceraldehyde-3-phosphate dehydrogenase.
|
2. Effects of 4-HC treatment on rabbit PTCs
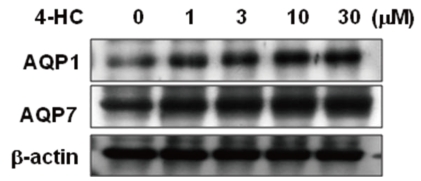
In order to examine the effect of an active metabolite of cyclophosphamide on the expression of water channel proteins in primary cultured renal PTCs, we treated rabbit PTCs with 4-HC (0-30 µmol/L) for 24 hours. In immunoblotting using membrane fraction of PTCs, protein expression levels of AQP1 and AQP7 were increased in a dose-dependent manner by 4-HC treatment (Fig. 5).
Go to :
Discussion
The kidney is able to regulate water excretion to maintain water balance. Renal conservation of water occurs partly in association with sodium reabsorption in the proximal tubule and thin limb of Henle's loop and partly as a result of action of vasopressin on the collecting duct. AQP1 and AQP2 are the major water channels to mediate water reabsorption in the proximal nephron and collecting duct, respectively.
Excessive accumulation of water results in dilutional hyponatremia. It usually occurs due to impaired renal excretion of water rather than excessive water intake because the capacity for water excretion normally is so great. When drugs affect water homeostasis, they can impair the renal diluting capacity in 3 ways20). The first possibility is that they can increase vasopressin secretion centrally. However, plasma vasopressin levels are not elevated in patients following the administration of intravenous cyclophosphamide21,22). In addition, antidiuresis was reported to occur in response to intravenous cyclophosphamide in an 8 year-old girl with central diabetes insipidus23), excluding the possibility of a drug-induced syndrome of inappropriate antidiuretic hormone secretion (SIADH).
The second possibility is reset osmostat, lowering the threshold for vasopressin secretion. This condition is usually associated with a long-term course of hyponatremia such as spinal cord injury, psychiatric problems, and alcoholism24), but cyclophosphamide-induced water retention is an acute process. The injection of cyclophosphamide into normally hydrated patients caused antidiuresis beginning in 4 to 12 hours and lasting as long as 20 hours25).
The third possibility is that cyclophosphamide may potentiate the action of vasopressin on the kidney. This postulation is very plausible, but has never been verified for decades. Recently, only carbamazepine was reported to increase AQP2 expression26). In this study, the protein expression of AQP2 seemed to increase, although statistical significance was not reached. Further studies will be required to demonstrate the role of AQP2 in cyclophosphamide-induced hyponatremia.
This study was focused to elucidate the role of the AQP1 water channel in cyclophosphamide-induced water retention. We tested whether AQP1 protein may be affected by cyclophosphamide administration in rat kidneys. In addition, primary cultured renal PTCs were treated with 4-HC because the cyclophosphamide-induced antidiuresis was related to the urinary excretion of active alkylating metabolites of the drug25).
To avoid the occurrence of hemorrhagic cystitis, we used moderate doses of a single cyclophosphamide administration. In Animal Experiment I, the increase in AQP1 protein expression was remarkable when 48 and 96 mg/kg BW cyclophosphamide were administered (Fig. 1). However, hyponatremia was not found in these rats (Table 1). Considering that cyclophosphamide-induced hyponatremia usually occurs 4-12 hours after the intravenous administration of the drug, we may have to test an earlier change in plasma sodium level.
The results of Animal Experiment II suggest that the increase in AQP1 protein may persist for more than several days after a single cyclophosphamide administration (Fig. 2). Cyclophosphamide-treated rats had a significantly lower plasma sodium concentration. Although weight gain was smaller in these animals, urine sodium excretion was not different between treated and control rats (Table 1). Thus we think that the main cause of hyponatremia in these cyclophosphamide-treated rats is water retention rather than hypovolemia.
Consistent with the animal studies, we found that treatment of primary cultured renal PTCs with an active metabolite of cyclophosphamide (4-HC) increased protein expressions of AQP1 and AQP7 in a dose-dependent manner (Fig. 5). Previous studies reported that AQP7 was localized selectively at the brush border membranes of proximal straight tubule (segment 3 proximal tubule, S3) in the rat kidney, suggesting that AQP7 may function as a pathway for transcellular water transport in S3 in concert with more widely expressed AQP1 in proximal tubules27,28). Thus, the proximal nephron should be one of the major target sites where cyclophosphamide-induced water retention occurs.
Despite the notable changes in AQP1 and AQP7 protein, we found no differences in the mRNA levels between cyclophosphamide-treated and control rats (Fig. 4). It is conceivable that other mechanisms such as decreased protein degradation than transcriptional regulation may exert to affect the AQP1 protein level. Further studies are required to demonstrate intracellular mechanisms to increase the protein abundance of AQP1 in response to cyclophosphamide administration.
Go to :
 XML Download