

 PDF
PDF ePub
ePub Citation
 Print
Print


Introduction
A third of peritoneal dialysis (PD) patients are frequently hypokalemic, in whom potassium removal by PD does not explain the occurrence of hypokalemia1, 2). Spital and Sterns noted that 36% of PD patients had a serum potassium level less than 3.5 mEq/L at some time during their course and that 20% required potassium supplementation3). Serum potassium levels in PD patients may be influenced by nutritional status and severity of coexisting comorbid conditions. Furthermore, hypokalemia was an independent predictor of mortality in PD patients4).
Tziviskou et al. suggested that hypokalemia in PD patients could be due to a shift of potassium into the intracellular space, probably because of insulin release during the continuous dwell of the dialysis solution containing glucose5). Thus, cellular uptake may play an important role in the pathogenesis of hypokalemia. Muscle biopsy studies showed that PD patients had a higher intracellular potassium content than hemodialysis patients6). Ongoing loss of potassium in dialysate may be another important contributing factor to hypokalemia4). In addition, end stage renal disease (ESRD) patients are instructed to restrict potassium-rich foods such as fruits and vegetables.
Most previous studies enrolled small numbers of patients, and were cross sectional studies. To the best of our knowledge, no longitudinal studies were reported to define the characteristics of hypokalemia in a PD population. This study was undertaken to investigate clinical features and related factors of de novo hypokalemia in incident PD patients over the 1-year observational period.
Go to : 
Materials and Methods
This study was conducted at our PD center in Gachon University Gil Hospital, Korea. Eighty-two incident PD patients were enrolled, who were normokalemic at month 1 of PD. According to the plasma potassium levels at month 13, the patients were divided into hypokalemia (K+<3.5 mEq/L) and normokalemia (3.5 mEq/L≤K+<5.5 mEq/L) groups. Eight patients who showed hyperkalemia (K+≥5.5 mEq/L) at month 13 were excluded. Different PD fluids (Baxter Healthcare, Deerfield, IL, USA and Fresenius Medical Care Deutschland GmbH, Bad Homburg, Germany) were used as either conventional or biocompatible solutions.
Blood, urine and PD effluent samples were taken on 3 occasions during the study: baseline, after the 4-week break-in period (at month 1), and after 12 months (at month 13) of starting PD. Peritoneal function tests for measurement of dialysis adequacy, peritoneal equilibration test (PET) and Kt/V (where K is the dialyzer clearance of urea, t is the dialysis time, and V is the patient's total body water) were taken at months 1 and 13. The values of the glomerular filtration rate (GFR), PET, Kt/V, and other laboratory parameters measured at month 1 were regarded as baseline. Information collected at the start of the study included age, gender, weight, height, underlying renal disease, and comorbidity. The degree of comorbidity was assessed using the Davies comorbidity score, which comprises seven comorbid conditions-malignancy, ischemic heart disease, peripheral vascular disease, left ventricular dysfunction, diabetes mellitus, systemic collagen vascular disease, and others (chronic obstructive pulmonary disease, liver cirrhosis, and asthma). Patients were divided into three risk groups: low (no comorbid disease), intermediate (1 or 2 comorbid diseases), and high (≥3 comorbid diseases)7).
Dialysis adequacy and nutritional status data were expressed as the Kt/V urea and normalized protein equivalent of nitrogen appearance (nPNA; g/kg/day), respectively. The urea distribution volume was calculated using the Watson equation8). The 24-h collection of dialysate effluent was used to calculate the peritoneal Kt/V urea. The total Kt/V urea was calculated as the sum of the renal and peritoneal Kt/V urea. When the modified PET using 3.86% glucose solution was performed, the results for the Korean PD patients were similar to those of Caucasian patients9). After an overnight dwell with 1.36% glucose PD fluid, the patients were subjected to a 4-h dwell with dialysis fluid containing 3.86% glucose. Blood samples were taken after 2 hours. The dialysate-to-plasma creatinine (D/P Cr) was calculated as the dialysate concentration at 4 hours divided by the plasma creatinine concentration. The dialysate creatinine concentration was determined after correcting for glucose interference. The daily glucose load (g/day) was calculated as the sum of the product of the volume and the glucose concentration for all of the daily bags.
The baseline GFR was estimated from serum creatinine using the abbreviated Modification of Diet in Renal Disease (MDRD) study formula. Residual renal function (RRF) was assessed by collecting all urine output over the same 24-h period during which dialysate was collected; GFR was calculated as the mean of the values for creatinine and urea clearances.
Biochemical tests were performed using a Roche modular units analyzer (Toshiba 200FR, Toshiba Medical Systems, Tokyo, Japan). Serum C-reactive protein (CRP) levels were determined using an immunoturbidimetric method (Denka Seiken, Tokyo, Japan). Indirect ion selective electrode methods were used to determine the electrolyte levels, and an enzymatic method was used to measure the total CO2.
The values were presented as median (interquartile range) values. To compare differences between the hypokalemia and normokalemia groups, Mann-Whitney U test and the chi-square test were used. When comparing paired samples, Wilcoxon signed ranks test was applied for continuous variables. The data were analyzed using SPSS 12.0 for Windows (SPSS Inc., Chicago, IL, USA) and P<0.05 was considered significant.
Go to :
Results
The baseline demographics of the patients starting PD are presented in Table 1. The two groups with and without hypokalemia had no significant differences in age, sex, height, and causes of end-stage renal disease. Medication history of angiotensin converting enzyme inhibitors or angiotensin II receptor blockades and diuretics were not significantly different between the two groups. No statistical differences were found between the two groups with respect to the Davies comorbidity, biocompatible fluid, and CAPD versus automated PD, although the hypokalemia group showed a higher propensity for diabetes mellitus.
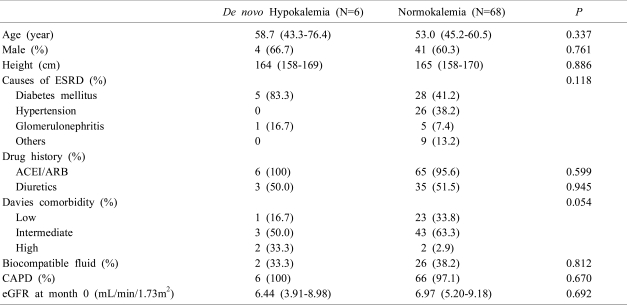
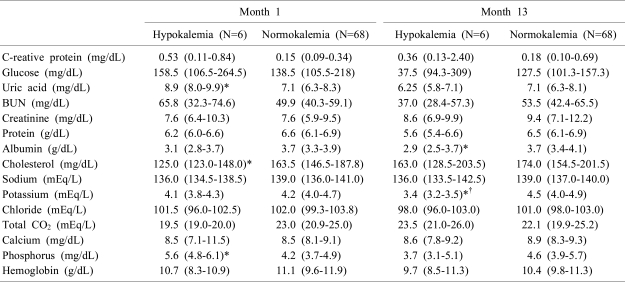
Table 2 shows the biochemical parameters. The incidence of hypokalemia in patients starting PD was 7.3% over the 1-year observation. Whereas the initial serum potassium and albumin levels at month 1 were not different between the two groups, the serum albumin level in the hypokalemia group significantly decreased from 3.1 (2.8-3.7) to 2.9 (2.5-3.7) mg/dL at month 13 (P=0.014). In contrast, no significant differences were observed in the serum glucose, CRP, protein, cholesterol, and total CO2 between the two groups at month 13. At month 1, the hypokalemia group had a higher serum phosphorus level and lower uric acid and cholesterol levels.
Peritoneal function and adequacy tests were measured at months 1 and 13 (Table 3). At month 1, the two groups showed no significant differences. The nPNA at month 1 was also similar between the hypokalemia and normokalemia groups [0.89 (0.57-1.09) and 0.91 (0.77-1.01) g/kg/day]. At month 13, however, the nPNA was significantly lower in the hypokalemia group [0.66 (0.58-0.79) g/kg/day] compared to that in the normokalemia group [0.91 (0.82-1.02) g/kg/day]. Other measurements determined for peritoneal function such as D/P Cr and daily glucose load were not different between the two groups.
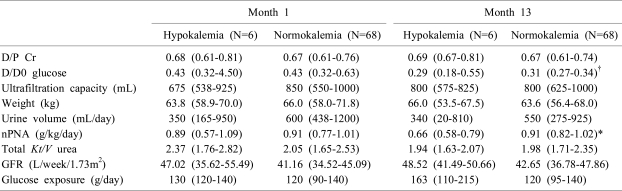
Table 3
Peritoneal Function and Adequacy Tests at Months 1 and 13
D/P Cr, dialysate to plasma creatinine ratio at 4 hours; D/D0 glucose, ratio of dialysate glucose at 4 hours' dwell time to dialysate glucose at 0 dwell time; nPNA, protein equivalent of total nitrogen appearance normalized to desirable body weight (generating rate of urea); GFR, glomerular filtration rate (calculated as the mean of the values for creatinine and urea clearances).
*P<0.05, hypokalemia group vs. normokalemia group by Mann-Whitney U test.
†P<0.05, month 1 vs. month 13 in each group by Wilcoxon signed rank test.
![]()
Go to :
Discussion
The present study demonstrates that the development of hypokalemia may not be uncommon in incident PD patients and can be associated with decreases in serum albumin and nPNA. The incidence of hypokalemia in our PD patients, 7.3% in a year, appears relatively low compared with that of previous reports1, 2, 10). This is probably because our result was from newly starting PD patients. We showed that the development of hypokalemia was associated with a lower serum albumin level. Hypoalbuminemia may be the strongest independent risk factor for death in CAPD patients11). Albumin is a negative acute phase reactive protein12), and albumin synthesis should be suppressed under some inflammatory conditions. In our study, however, CRP did not differ between the two groups. Malnutrition causes decreased albumin synthesis as well and is a potential cause of decreased albumin levels and increased morbidity and mortality in ESRD13).
We also found that nPNA was significantly lower in the hypokalemia group at month 13. This is important because nPNA is a marker for nutrition and a well-known predictor of mortality in PD patients. Pérez-Flores et al. showed that nPNA is directly correlated with RRF and that RRF is correlated with CRP as well14). In the present study, however, no difference was observed in RRF between the two groups.
Potassium homeostasis is maintained by two different balances: the internal balance representing potassium redistribution between the intracellular and the extracellular compartments, and the external balance representing potassium interchanges between the organism and the environment15). In PD patients, Tziviskou et al. suggested that insulin hormone, stimulated by the continuous glucose peritoneal dwell, could generate an increase of potassium redistribution into the intracellular compartment5). Some authors have postulated a dysfunction in the cellular Na+,K+-ATPase pump as the cause of their low intracellular potassium content16). In the present study, the presence of diabetes and daily glucose load were not different between the two groups, suggesting that intracellular potassium redistribution may not be the main mechanism of hypokalemia in our PD patients.
Kim et al. reported in a cross-sectional design that the serum potassium level of PD patients was correlated with ultrafiltration volume at the PET and serum albumin level10). However, our patients had no difference in ultrafiltration volume at month 13. It is conceivable that changes in ultrafiltration volume may occur after the change in serum albumin level. Even though long-term follow up of a large number of patients would be needed to elucidate this mechanistic relationship, it emphasizes the importance of serum potassium level as a nutritional marker as well as a potential predictor of outcome.
In addition, variables regarding peritoneal function and adequacy tests were not different between patients with or without hypokalemia, suggesting that the role of peritoneal potassium loss in producing hypokalemia may not be substantial. Unfortunately, however, we did not examine urinary and peritoneal dialysate potassium concentrations from our patients. Thus, the possibility of increased potassium loss in dialysate and urine in hypokalemic patients cannot completely be excluded. Detailed dietary assessment should be of help for the proper evaluation of potassium balance disturbances.
Higher serum phosphorus levels and lower uric acid and cholesterol levels were noted at month 1 in the hypokalemia group. The reason why those serum levels were different between the two groups is not clear, but may be associated with poor general conditions in hypokalemia patients.
In summary, we investigated clinical features of PD-associated hypokalemia and found that development of hypokalemia was associated with a lower serum albumin level and decreased nPNA in new PD patients. Therefore, we suggest that serum potassium levels should be monitored more carefully in PD patients with poor nutritional status.
Go to :
 XML Download