Abstract
Uninephrectomy (uNx) in young rats causes salt-sensitive hypertension (SSH). Alterations of sodium handling in residual nephrons may play a role in the pathogenesis. Therefore, we evaluated the adaptive alterations of renal sodium transporters according to salt intake in uNx-SSH rats. uNx or sham operations were performed in male Sprague-Dawley rats, and normal-salt diet was fed for 4 weeks. Four experimental groups were used: sham-operated rats raised on a high-salt diet for 2 weeks (CHH) or on a low-salt diet for 1 week after 1 week's high-salt diet (CHL) and uNx rats fed on the same diet (NHH, NHL) as the sham-operated rats were fed. Expression of major renal sodium transporters were determined by semiquantitative immunoblotting. Systolic blood pressure was increased in NHH and NHL groups, compared with CHH and CHL, respectively. Protein abundances of Na+/K+/2Cl- cotransporter (NKCC2) and Na+/Cl- cotransporter (NCC) in the CHH group were lower than the CHL group. Expression of epithelial sodium channel (ENaC)-γ increased in the CHH group. In contrast, expressions of NKCC2 and NCC in the NHH group didn't show any significant alterations, compared to the NHL group. Expressions of ENaC-α and ENaC-β in the NHH group were higher than the CHH group. Adaptive alterations of NKCC2 and NCC to changes of salt intake were different in the uNx group, and changes in ENaC-α and ENaC-β were also different. These altered regulations of sodium transporters may be involved in the pathogenesis of SSH in the uNx rat model.
Hypertension is the most common chronic disorder worldwide and secondary hypertension explains the cause of 5 to 10% of the hypertensive population, many of which could be linked to renal disease1). The hypothesis proposed in those hypertensive patients is that the kidneys might initially have been normal, but subtle renal injury induced by some events eventually may have altered the ability to excrete salts2) in those hypertensive patients was proposed. Some authorities believe that the mechanisms by which the kidney causes hypertension involve physiologic defects in sodium excretion as proposed by Guyton et al.3). Both epidemiologic4) and physiologic5) studies support this hypothesis.
Several hypotheses have been proposed to explain the mechanisms responsible for the defects in renal sodium handling. One of them is that hypertension results from a polygenic defect in which there are alterations in the regulation of tubular sodium transport systems6). A recent report that many forms of genetic hypertension are associated with enhanced sodium reabsorption has provided support for this hypothesis7).
The hypothesis that a reduced number of nephrons at birth causes initial renal injury and later hypertension was proposed8). However, it has been argued because some adult kidney donors develop hypertension9), but others don't10). Therefore, it is suggested that the age at which reduction of nephron number occurs is an important factor for the outcome of the nephrectomy. The compensatory increase in kidney weight and function after nephrectomy appears to be more pronounced in immature than in mature kidneys, as proved in in-vivo studies11). Furthermore, it has been recently reported that both reduction in nephron number by uninephrectomy (uNx) and chronic salt loading during young age after complete nephrogenesis cause salt-sensitive hypertension in adulthood12).
Although altered regulation of major sodium transporters might be involved in the pathogenesis of the salt-sensitive hypertensive rat model induced by uNx, sequential adaptive mechanism of renal sodium transporters according to salt intake in this model has not been evaluated. The present study was performed to evaluate the adaptive alterations of renal sodium transporters in the salt-sensitive hypertensive rat model induced by uNx.
After obtaining approval of the study protocol from the Institutional Animal Care and Use Committee, 28 male Sprague-Dawley rats (5-6 weeks, 160-190 g; Orient Bio Inc., Seongnam City, Korea) were placed in cages. Investigations were conducted in accordance with the Guide for Care and Use of Laboratory Animals (National Academy of Science, 1996). The animals were kept in a light and temperature-controlled room with free access to standard rat chow (Agribrand Purima Korea, Seongnam City, Korea) and deionized water for 1 week before undergoing surgical procedures.
All rats were anesthetized with isoflurane (Isoflu®, Abbott Laboratories, Chicago, IL, USA) and the sham operation (n=14) or uNx (n=14) by total extirpation of the left kidney was performed. A normal-salt diet (0.3% NaCl) was provided for 4 weeks; thereafter, sham operated (control) rats were randomly allocated into two groups: (1) the CHH group (n=8) was fed on a high salt diet (3% NaCl) for 2 weeks; (2) the CHL group (n=6) was fed on a low-salt diet (0.03% NaCl) for 1 week after 1 week's high-salt diet. And uninephrectomized rats were also randomly allocated into (3) the NHH group (n=8); (4) the NHL group (n=6); uninephrectomized rats fed on the same diet as the control group (Fig. 1). The rats were allowed free access to drinking water.
The blood pressure (BP) and body weight were measured at three time points: 1) baseline, 2) just before changing the diet, and 3) on the day of sacrifice. The BP was measured using the Non-invasive Blood Pressure System XBP1000 (Kent Scientific Corp., Torrington, CT, USA). During the last 2 days prior to sacrifice, the animals were placed in the metabolic cages, and 24-hour urine samples were collected on the day before sacrifice for the measurement of urine urea nitrogen, creatinine, protein, osmolality, sodium and potassium. Blood samples were collected from the abdominal aorta at the time of sacrifice for the measurement of blood urea nitrogen, creatinine, osmolality, sodium and potassium. Creatinine and urea clearances were calculated using the standard formula. Whole blood was centrifuged at 3,000 rpm (Sorvall RT 6000 D; Sovall, Newtown, CT, USA) at 4℃ for 20 min to separate plasma.
The right kidneys were dissected into small pieces and placed in a chilled isolation buffer containing 250 mM sucrose, 10 mM triethanolamine (Sigma), 1 µg/mL leupeptin (Sigma), and 0.1 mg/mL phenylmethylsulfonylfluoride (Sigma) titrated to pH 7.6. Then, the pieces were homogenized at 15,000 rpm with 3 stokes for 15 seconds with a tissue homogenizer (PowerGun 125). After homogenization, the total protein concentration of the homogenate was measured by the Bicinchoninic acid protein assay method (BCA Reagent Kit; Sigma) and diluted to 2.05 µg/µL using the isolation buffer solution. The samples were then stabilized by heating to 60℃ for 15 minutes after adding 1 vol 5 X Laemmli sample buffer/4 vol sample.
Initially, loading gels were done on each sample set to allow fine adjustment of the loading amount to guarantee equal loading on subsequent immunoblots. Five micrograms of protein from each sample were loaded into each individual lane and electrophoresed on 12% polyacrylamide-SDS minigels by using the Mini-PROTEIN III electrophoresis apparatus (Bio-Rad, Hercules, CA, USA) and then stained with Coomassie blue dye (0.025% solution made in 4.5% methanol and 1% acetic acid, G-25; Bio-Rad). Selected bands from these gels were scanned with densitometry (GS-700 Imaging Densitometry; Bio-Rad) to semi-quantitatively determine density (Molecular Analyst version 1.5; Bio-Rad) and relative amounts of protein loaded in each lane. Finally, protein concentrations were corrected to reflect these measurements by the repetition of the above process.
For immunoblotting, the proteins electrophoresed on gels were transferred from unstained gels to nitrocellulose membranes (Bio-Rad) with the electroelution method. After being blocked with 5% skim milk in PBS-T (80 mM Na2HPO4, 20 mM NaH2PO4, 100 mM NaCl, and 0.1% Tween-20 [pH 7.5]) for 30 minutes at room temperature, the membranes were probed overnight at 4℃ with the respective primary antibodies. For probing blots, all primary antibodies were diluted into a solution containing 150 mM NaCl, 50 mM sodium phosphate, 10 mg/dL sodium azide, 50 mg/dL Tween 20, and 0.1 g/dL bovine serum albumin (pH 7.5). Immunoblotting was performed using an anti-rat Na+/H+ exchanger type 3 (NHE3; 1:200), anti-rat Na+/K+/2Cl- cotransporter (NKCC2; 1:2,000), anti-rat Na+/Cl- cotransporter (NCC; 1:1,000), and anti-rat α- (1:1,000), β- (1:200), and γ-epithelial sodium channel (ENaC; 1:500). The membranes were washed and incubated with secondary antibodies for 1 hour at room temperature. The secondary antibody was horseradish peroxidase-conjugated donkey anti-rabbit IgG (31458; Pierce, Rockford, IL, USA) diluted to 1:3000. Sites of antibody-antigen reaction were viewed with an enhanced chemiluminescence system (ECLTM RPN 2106; Amersham Pharmacia Biotech, Buckinghamshire, UK) before exposure to X-ray film (Hyperfilm; Amersham Pharmacia Biotech). Band density was measured by densitometry (GS-700 Imaging Densitometry; Bio-Rad) and calculated as a value relative to the average value of the control group.
For semi-quantitative immunoblotting, we used previously characterized polyclonal antibodies. Affinity-purified polyclonal antibodies against NHE313), NKCC214), NCC15), and α- and γ-ENaC16) were used. Affinity-purified polyclonal antibodies against β-ENaC (sc-21013; Santa Cruz Biotechnology, Inc, CA, USA) were used.
All values are expressed as the mean±standard error (SEM). Band density values were standardized by dividing them with the average value of the control group. Thus, the mean for the control group was defined as 100%. Group means of protein abundance obtained from immunoblotting were compared with the Mann-Whitney U-test (SPSS software version 15.0; SPSS Inc., Chicago, IL, USA). A P-value<0.05 was considered statistically significant.
As shown in Fig. 2, after the sham operation or uNx, a high salt diet induced a rise in systolic BP.
When comparing between the high and low-salt diet groups (CHL vs. CHH and NHL vs. NHH), the systolic BP was significantly increased in the CHH (156.83±2.29 mmHg; P<0.01) and NHH (170.63±7.31 mmHg; P<0.01) groups than in the CHL (117.94±1.21 mmHg) and NHL (122.72±1.40 mmHg) groups, respectively. When compared between the sham and uNx group (CHL vs. NHL and CHH vs. NHH), the systolic BP was also significantly higher in the NHL (P<0.05) and NHH (P<0.05) groups than in the CHL and CHH groups, respectively.
The blood pressure-sodium excretion curves for the uNx rats were shifted to the right, resulting in a blunted pressure natriuresis (Fig. 3).
The body weight was not different after a 2 weeks' high salt diet in the uNx group (NHH and NHL; 483.65±8.72 and 453.84±22.22 g, P=0.302) and in the sham-operated group (CHH and CHL; 471.31±5.66 and 449.38±11.67 g, P=0.349). Fractional excretion of sodium (FENa) were higher in both the uNx and sham-operated groups after a 2 weeks' high salt diet (NHH vs NHL; 9.33±0.44% vs 0.90±0.10%; P<0.05 and CHH vs CHL; 8.04±0.82% vs 0.64±0.05%; P<0.05 respectively; Fig. 4, Table 1).
There were no differences in protein abundances of NHE3 between the CHH and CHL group (94% in the CHH group, 100% in the CHL group; P=0.265; Fig. 5). Protein abundances of NKCC2 and NCC in the CHH group significantly decreased (40%, 66% of the CHL group; P<0.05, P<0.01, respectively; Fig. 5) compared with those in the CHL group. Expression of ENaC-α and ENaC-β in the CHH group did not change (108%, 73% of the CHL group; P=0.937, P=0.240, respectively; Fig. 5), compared to those in the CHL group. In contrast, expression of ENaC-γ increased in the CHH group (188% of that in the CHL group, P=0.026; Fig. 5) compared to those in the CHL group.
Protein abundances of NHE3 in the NHH group did not differ (92% of the NHL group, P=0.232; Fig. 6) compared to (comparing) those in the NHL group. Protein abundances of NKCC2 and NCC did not show any significant alteration between the NHH and NHL group (83%, 151% of the NHL group; P=0.699, P=0.132, respectively; Fig. 6). Also, expression of α-, β-, and γ-subunit of ENaC in the NHH group was not different (178%, 99%, and 89% of the NHL group; P=0.065, P=0.937, and P=0.435 respectively; Fig. 6) compared to those in the NHL group, either.
Protein abundances of NHE3 in the NHH group was not different (99% of the CHH group, P=0.432; Fig. 7), compared with those of the CHH group. Protein abundances of NKCC2 in the NHH group was significantly lower (49% of the CHH group, P=0.009; Fig. 7) than those in the CHH group. There were no significant differences in protein abundances of NCC regardless of uninephrectomy (87% of the CHH group, P=0.589; Fig. 7). Expression of ENaC-α and ENaC-β in the NHH group was significantly higher (160%, 173% of the CHH group; P=0.045, P=0.015 respectively; Fig. 7) than those in the CHH group. Expression of ENaC-γ in the NHH group was not different (96% of that in the CHH group, P=0.937; Fig. 7) from that in the CHH group.
In the present study, we investigated the alteration of major renal sodium transporters in the salt-sensitive hypertension rat model induced by uNx. This study demonstrated that sodium loading itself was effective in increasing BP regardless of uNx and that uNx with chronic high salt diet gave rise to more pronounced hypertension and salt sensitivity. The blood pressure-sodium excretion curves of uNx rats had been shifted to the right, resulting in a blunted pressure natriuresis.
The kidneys have a key role in long-term BP control17). Because normal functioning kidneys have the ability to excrete large amounts of excessive salt, it is generally considered that an increased salt intake for a shorter period of time does not cause any significant changes in arterial BP. However, the long-term effects of high salt intake are still controversial.
In this study, sham-operated animals subjected to chronic salt loading displayed decreased expression of NKCC2 and NCC compared to those subjected to change in diet from high to low salt. On the other hand, uninephrectomized animals showed increased body weight and no adaptive alterations of sodium transporters in response to the same diet change. These results can be compatible with the NKCC2, which are over-expressed in the Dahl salt-sensitive rats to sodium retension and hypertension when challenged with a high salt diet18). It can, therefore, be justified to postulate that changes in NKCC2 and NCC expressions in response to this dietary salt change were blunted in the uNx rats. These findings might suggest that decreased protein abundance of NKCC2 and NCC would be important molecular targets for regulatory processes responsible for salt loading. Blunted down-regulated adaptation of these transporters to salt loading in the uNx group might be one of the factors related with body weight gain and higher BP in the uNx group. NKCC2 expression is decreased in NHH rats compared with CHH rats. Thus, it is thought that sodium delivery to the distal nephron was enhanced in uNx rats in response to chronic salt loading, thereby overwhelming the capacity of the collecting duct to reabsorb sodium and leading to increased urinary sodium excretion (FENa).
Determination of NHE3 protein abundance both in sham-operated and uNx rats revealed that NHE3 protein abundance is not significantly different between the two groups (Fig. 5, 6), which may indicate that the NHE3 does not play a major role in the maintenance of hypertension in the uNx salt-sensitive hypertensive animals. However, the fact that the contribution of the NHE3 to the salt-sensitive hypertension is mediated by its increased activity, not necessarily associated with over-expression cannot be excluded.
We have also examined the expression of ENaC, which is the key apical sodium channel in the connecting tubule and collecting duct. During active sodium absorption, all three subunits are found mostly in the apical domain of segment-specific cells, whereas, during natriuresis, β- and γ-ENaC are mainly localized in cytosolic vesicles19). Aldosterone regulates ENaC-dependent sodium reabsorption by changing the expression and subcellular localization of the individual ENaC subunits20, 21). The expression of ENaC-α and ENaC-β were increased in NHH rats, compared with those in CHH rats (Fig. 7). The ENaC channel activity is regulated by a number of mechanisms, including aldosterone-stimulated intracellular trafficking of the ENaC α-, β-, and γ-subunits from the cytoplasm to the apical plasma membrane22). Because the synthesis of the α-ENaC subunit has been suggested to be a rate-limiting factor of the multimeric ENaC complex, sodium transport could be expected to be proportional to the abundance of the α-ENaC protein levels. The role of the β- and γ-subunit is still uncertain. Neither the β- nor the γ-subunit, when expressed alone or together, has been shown to produce any measurable Na+ current, whereas co-expression with the α-subunit greatly enhanced the amplitudes of the Na+ current23, 24). As mentioned above, it is well known that increased sodium reabsorption in the collecting duct is correlated with the increased protein abundance of ENaC subunits at the plasma membrane, increased apical trafficking and increased probability of the ENaC subunits being open. Although apical trafficking and probability of the ENaC subunits being open were not examined in this study, increased protein expression of ENaC-α and ENaC-β might contribute to the induction of increased sodium reabsorption in these nephron segments, which can contribute to volume overload and BP elevation.
It has been demonstrated that ENaC activity and expression are regulated by several hormones, such as vasopressin25), aldosterone22), and insulin26). Long-term increases in circulating aldosterone concentrations result in increases of the abundances of the α-subunit protein with decreased abundance of β-subunit protein and appearance of a 70-kDa γ-ENaC band with a concomitant decrease in the main 85-kDa band21). In contrast, long-term exposure to high circulating vasopressin levels stimulates a marked increase in the abundances of the β- and γ-subunit proteins, with little or no effect on the abundance of the α-subunit25). Thus the change of the ENaC subunits in the present study might be associated with both effects of vasopressin and aldosterone27, 28). However we did not measure these hormones and thus could not evaluate the relative role of these two hormones. The γ-subunit was up-regulated, whereas the α- and β-subunits were not affected in the CHH rats, compared with those of the CHL rats. A possible explanation may be lacking, but this change may be simply the compensatory change to the decreased proximal sodium reabsorption due to decreased NCC and NKCC2 expression.
In summary, we have found that, BP was higher in the uNx group than in the sham-operated group, regardless of salt intake. Adaptive alterations of NKCC2 and NCC to changes of salt intake were blunted in the uNx group. Moreover, expression of α-, and β-subunits of ENaC increased in the uNx group. These altered regulations might be involved in the pathogenesis of salt-sensitive hypertension (SSH) in the uNx rat model. This is a preliminary study to evaluate salt-sensitive hypertension, therefore, further studies are warranted to elucidate the precise mechanism of this phenomenon.
References
1. Johnson RJ, Rodriguez-Iturbe B, Nakagawa T, Kang DH, Feig DI, Herrera-Acosta J. Subtle renal injury Is likely a common mechanism for salt-sensitive essential hypertension. Hypertension. 2005; 45:326–330. PMID: 15655117.

2. Johnson RJ, Herrera-Acosta J, Schreiner GF, Rodriguez-Iturbe B. Subtle acquired renal injury as a mechanism of salt-sensitive hypertension. N Engl J Med. 2002; 346:913–923. PMID: 11907292.

3. Guyton AC, Coleman TG, Cowley AV Jr., Scheel KW, Manning RD Jr., Norman RA Jr.Arterial pressure regulation. Overriding dominance of the kidneys in long-term regulation and in hypertension. Am J Med. 1972; 52:584–594. PMID: 4337474.
4. Elliott P, Stamler J, Nichols R, et al. Intersalt revisited: further analyses of 24 hour sodium excretion and blood pressure within and across populations. Intersalt Cooperative Research Group. BMJ. 1996; 312:1249–1253. PMID: 8634612.
5. MacGregor GA, Markandu ND, Best FE, et al. Double-blind randomised crossover trial of moderate sodium restriction in essential hypertension. Lancet. 1982; 1:351–355. PMID: 6120346.

6. Lifton RP. Molecular genetics of human blood pressure variation. Science. 1996; 272:676–680. PMID: 8614826.

7. Karet FE, Lifton RP. Mutations contributing to human blood pressure variation. Recent Prog Horm Res. 1997; 52:263–276. PMID: 9238856.
8. Brenner BM, Garcia DL, Anderson S. Glomeruli and blood pressure. Less of one, more the other? Am J Hypertens. 1988; 1:335–347. PMID: 3063284.

9. Curtis JJ, Luke RG, Dustan HP, et al. Remission of essential hypertension after renal transplantation. N Engl J Med. 1983; 309:1009–1015. PMID: 6353230.

10. Boudville N, Prasad GV, Knoll G, et al. Meta-analysis: risk for hypertension in living kidney donors. Ann Intern Med. 2006; 145:185–196. PMID: 16880460.

11. Larsson L, Aperia A, Wilton P. Effect of normal development on compensatory renal growth. Kidney Int. 1980; 18:29–35. PMID: 7218658.

12. Carlstrom M, Sallstrom J, Skott O, Larsson E, Persson AE. Uninephrectomy in young age or chronic salt loading causes salt-sensitive hypertension in adult rats. Hypertension. 2007; 49:1342–1350. PMID: 17438306.

13. Kim GH, Ecelbarger C, Knepper MA, Packer RK. Regulation of thick ascending limb ion transporter abundance in response to altered acid/base intake. J Am Soc Nephrol. 1999; 10:935–942. PMID: 10232678.

14. Kim GH, Ecelbarger CA, Mitchell C, Packer RK, Wade JB, Knepper MA. Vasopressin increases Na-K-2Cl cotransporter expression in thick ascending limb of Henle's loop. Am J Physiol. 1999; 276:F96–F103. PMID: 9887085.
15. Kim G, Masilamani S, Turner R, Mitchell C, Wade J, Knepper M. The thiazide-sensitive Na-Cl cotransporter is an aldosterone-induced protein. Proc Natl Acad Sci U S A. 1998; 95:14552–14557. PMID: 9826738.

16. Masilamani S, Kim GH, Mitchell C, Wade JB, Knepper MA. Aldosterone-mediated regulation of ENaC α, β, and γ subunit proteins in rat kidney. J Clin Invest. 1999; 104:R19–R23. PMID: 10510339.

17. Guyton AC. Blood pressure control--special role of the kidneys and body fluids. Science. 1991; 252:1813–1816. PMID: 2063193.

18. Hoagland KM, Flasch AK, Dahly-Vernon AJ, dos Santos EA, Knepper MA, Roman RJ. Elevated BSC-1 and ROMK expression in Dahl salt-sensitive rat kidneys. Hypertension. 2004; 43:860–865. PMID: 14967839.

19. Hager H, Kwon TH, Vinnikova AK, et al. Immunocytochemical and immunoelectron microscopic localization of α-, β-, and γ-ENaC in rat kidney. Am J Physiol Renal Physiol. 2001; 280:F1093–F1106. PMID: 11352848.

20. Ecelbarger CA, Kim GH, Terris J, et al. Vasopressin-mediated regulation of epithelial sodium channel abundance in rat kidney. Am J Physiol Renal Physiol. 2000; 279:F46–F53. PMID: 10894786.

21. Masilamani S, Kim GH, Mitchell C, Wade JB, Knepper MA. Aldosterone-mediated regulation of ENaC alpha, beta, and gamma subunit proteins in rat kidney. J Clin Invest. 1999; 104:R19–R23. PMID: 10510339.
22. Loffing J, Pietri L, Aregger F, et al. Differential subcellular localization of ENaC subunits in mouse kidney in response to high-and low-Na diets. Am J Physiol Renal Physiol. 2000; 279:F252–F258. PMID: 10919843.
23. Canessa CM, Schild L, Buell G, et al. Amiloride-sensitive epithelial Na+ channel is made of three homologous subunits. Nature. 1994; 367:463–467. PMID: 8107805.

24. Shimkets RA, Warnock DG, Bositis CM, et al. Liddle's syndrome: heritable human hypertension caused by mutations in the β subunit of the epithelial sodium channel. Cell. 1994; 79:407–414. PMID: 7954808.

25. Ecelbarger CA, Kim GH, Wade JB, Knepper MA. Regulation of the abundance of renal sodium transporters and channels by vasopressin. Exp Neurol. 2001; 171:227–234. PMID: 11573975.

26. Blazer-Yost BL, Liu X, Helman SI. Hormonal regulation of ENaCs: insulin and aldosterone. Am J Physiol. 1998; 274:C1373–C1379. PMID: 9612225.

27. Morris M, Keller M, Sundberg DK. Changes in paraventricular vasopressin and oxytocin during the development of spontaneous hypertension. Hypertension. 1983; 5:476–481. PMID: 6862574.

28. Tahara A, Tsukada J, Tomura Y, et al. Alterations of renal vasopressin V1A and V2 receptors in spontaneously hypertensive rats. Pharmacology. 2003; 67:106–112. PMID: 12566855.
Fig. 1
Experimental scheme. uNx, uninephrectomy; NS, normal salt diet; HS, high salt diet; LS, low salt diet. CHH: Sham-operated rats raised on a high-salt diet for 2 weeks. CHL: Sham-operated rats raised on a low-salt diet for 1 week after 1 week's high-salt diet. NHH, NHL: uninephrectomized rats fed on the same diet with matched sham-operated rats.
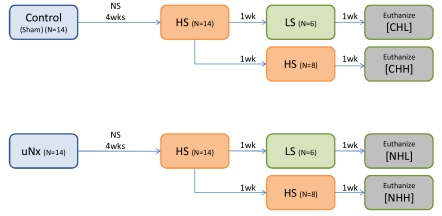
Fig. 2
Change in systolic blood pressure (SBP). After application of sham or uNx, SBP in rats fed on a high salt diet increased progressively. In rats substituted with low salt diet, the elevation of SBP was attenuated. All of the values are expressed as the mean±standard error. See Fig. 1 legend for description of experimental diets and groups.
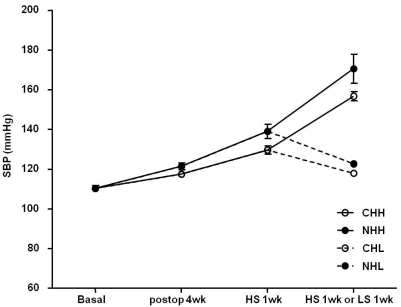
Fig. 3
Pressure-natriuresis curves during the experimental period. These curves illustrate the relationship between the systolic blood pressure (SBP) and 24-hour urinary sodium output. The pressure-sodium excretion curves of the uninephrectomized groups had shifted to the right, and the sham groups had a relative shift to the left. All of the values are expressed as the mean±standard error. See Fig. 1 legend for description of experimental diets and groups.
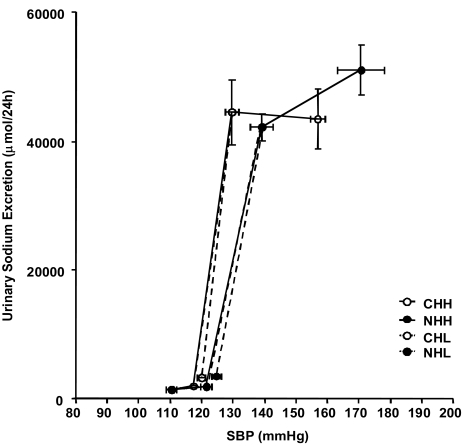
Fig. 4
Change in fluid intake and urine volume. In the uninephrectomized groups, both fluid intake and urine volume increased for the entire experimental period. Fractional excretion of sodium (FENa) was also increased after high salt diet. All of the values are expressed as the mean±standard error. Bwt, body weight. See Fig. 1 legend for description of experimental diets and groups.
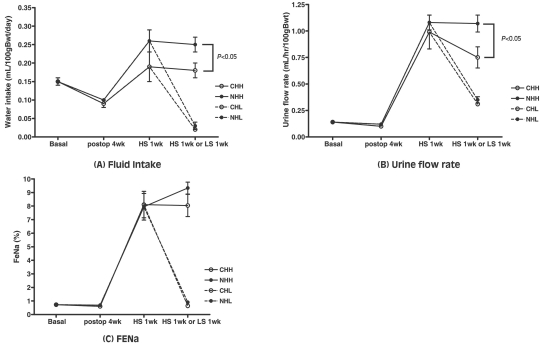
Fig. 5
Profiles of sodium transporters and protein abundance change in response to dietary NaCl in the sham-operated group. Protein abundances of Na+/K+/2Cl- cotransporter (NKCC2) and Na+/Cl- cotransporter (NCC) in the CHH group significantly decreased compared to those in the CHL group. Expression of epithelial sodium channel (ENaC)-γ increased in CHH. Each panel is immunoblot loaded with samples from 6 control rats in the CHL group and 6 rats in the CHH group. Blots were probed with antibodies to the type 3 Na+/H+ exchanger (NHE3) of the proximal tubule, the bumetanide-sensitive type 2 NKCC2 of the thick ascending limb of Henle's loop, the thiazide-sensitive NCC of the distal convoluted tubule, and each of the 3 subunits of the amiloridesensitive ENaC. Equality of loading was confirmed by densitometry of parallel Coomassie-stained gels. Values are the means and bars indicate standard error. See Fig. 1 legend for description of experimental diets and groups. *P<0.05 vs control. †P<0.01 vs control.
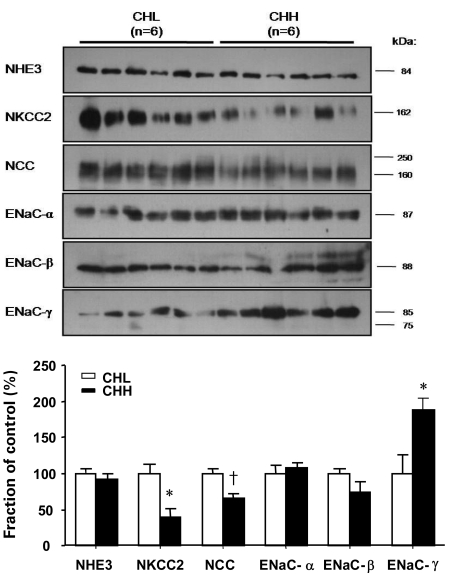
Fig. 6
Profiles of sodium transporters and protein abundance change in response to dietary NaCl in the uninephrectomized group. Expressions of Na+/K+/2Cl- cotransporter (NKCC2) and Na+/Cl- cotransporter (NCC) in the NHH group did not show any significant alterations compared with those in the NHL group. Each panel is immunoblot loaded with samples from 6 control rats in the NHL group and 6 rats in the NHH group. Values are the means and bars indicating standard error. NHE3, Na+/H+ exchanger type 3; ENaC, epithelial sodium channel. See Fig. 1 legend for description of experimental diets and groups.
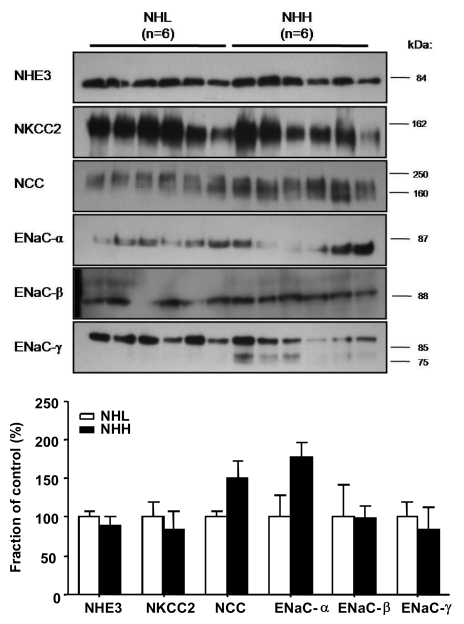
Fig. 7
Profiles of sodium transporter and protein abundance change between the CHH and NHH group. Protein abundances of Na+/K+/2Cl- cotransporter (NKCC2) in the NHH group significantly decreased compared to those in the CHH group. Expression of epithelial sodium channel (ENaC)-α and ENaC-β increased in the NHH group. Each panel is immunoblot loaded with samples from 6 control rats in the CHH group and 6 rats in the NHH group. Values are the means and bars indicating standard error. NHE3, Na+/H+ exchanger type 3; NCC, Na+/Cl- cotransporter. See Fig. 1 legend for description of experimental diets and groups. *P<0.05 vs control. †P<0.01 vs control.
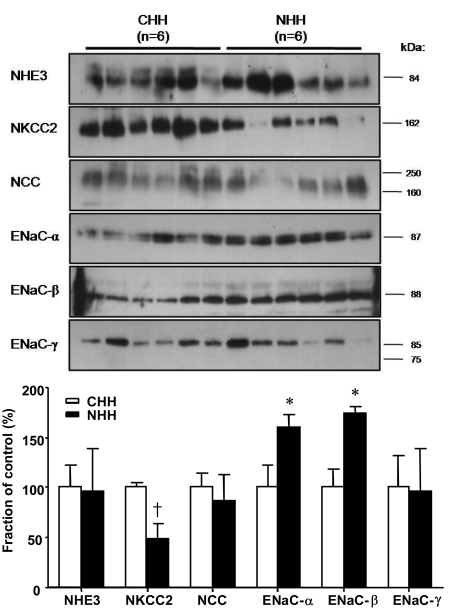
Table 1
Physiologic Parameters
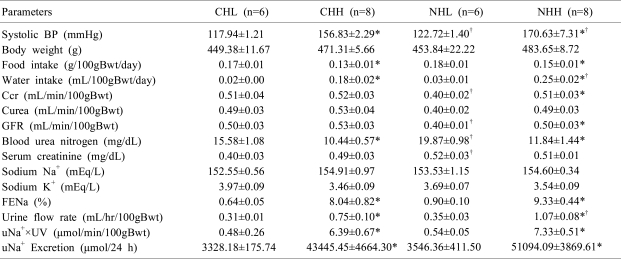
Values are the means±standard error. BP, blood pressure; Ccr, creatinine clearance; Curea, urea clearance; GFR, glomerular filtration rate; Bwt, body weight; Na+, sodium; K+, potassium; FENa, Fractional excretion of sodium; uNa+, urinary sodium; UV, urine volume.
See Fig. 1 legend for description of experimental diets and groups.
*P<0.05 when compared between high and low salt diet groups (CHL vs. CHH and NHL vs. NHH).
†P<0.05 when compared between sham and uninephrectomized groups (CHL vs. NHL and CHH vs. NHH).


 PDF
PDF ePub
ePub Citation
 Print
Print


 XML Download