This article has been
cited by other articles in ScienceCentral.
Abstract
Background
Several scoring systems for cervical disc and facet joint degeneration, using radiography or computed tomography, have been developed and tested for reliability. However, definitions of disc height and facet joint space narrowing vary. To our knowledge, no study has reported quantitative data for normal radiologic values of the cervical spine in the Korean population. The purpose of this study is to determine normal cervical disc height, disc height ratio, and facet joint space values, and investigate the correlation between demographic data and these values.
Methods
We performed a retrospective study of patients who underwent artificial disc replacement of the cervical spine. Disc heights and facet joint spaces were measured using cervical neutral lateral radiographs and computed tomography. The means, standard deviations, and 95% confidence intervals of the values were determined.
Results
We measured 148 intervertebral discs and 352 posterior facet joints. The mean disc height measured by plain radiography and computed tomography was 5.57 ± 0.81 mm and 4.94 ± 0.94 mm, respectively. The mean facet joint space values measured by plain radiography and computed tomography were 1.94 ± 0.45 mm and 1.43 ± 0.39 mm, respectively. The disc heights and facet joint space values measured by plain radiography were greater than those measured by computed tomography. The lower limit of the 95% confidence interval of the disc height ratio calculated by plain radiography and computed tomography was greater than 0.94 at all levels except for C5–6. Patient height and disc height showed a tendency of positive correlation.
Conclusions
In a Korean population, the normal cervical disc height was about 5.0 mm and the normal facet joint space was 1.4 mm. Disc height ratio can reliably identify normal cervical disc height in patients with mild degeneration. Patient height was positively correlated with disc height and facet joint space. Thus, when selecting a cervical implant, surgeons should consider patient height as well as estimated normal disc height.
Keywords: Cervical spine, Intervertebral disc, Zygapophyseal joint, Disc degeneration
Degeneration of the intervertebral disc or facet joint is one of the major cervical spine pathologies.
1) Therefore, proper description or quantification of degeneration is important for evaluation and treatment.
Several scoring systems for assessing cervical disc and facet joint degeneration that use radiography or computed tomography (CT) have been developed
234) and tested for reliability.
4) However, definitions of normal cervical disc height and facet joint space narrowing vary among studies.
23456) In some studies, adjacent cervical disc height was used as a reference for normal disc height
4) although degeneration of adjacent discs is known to occur simultaneously. Hence, a reliable reference for judging normal cervical disc height is necessary.
When measuring the disc height or facet joint space, we should take into account the magnification errors in plain radiography. Shigematsu et al.
7) reported approximately 20% of magnification errors in digital radiographs of the cervical spine. To overcome this limitation, Frobin et al.
8) suggested dimensionless data with high precision, but this is not feasible in clinical setting.
To our knowledge, no previous study has reported quantitative data on normal radiologic values of cervical vertebral segments in the Korean population. In this study, we measured cervical disc height and facet joint space in Koreans and determined mean values. In addition, we calculated the disc height ratio to investigate the normal disc height in patients with mild degeneration. The purpose of this study was to establish normal values of cervical disc height, facet joint space, and disc height ratio and to determine whether the values correlate with demographic data.
METHODS
Participants
We performed a retrospective study of 50 patients who underwent artificial disc replacement (ADR) of the cervical spine from May 2006 to September 2011. Excluding the level of ADR, the rest disc levels from C2–3 to C6–7, and all levels of facet joints were included. Two radiologists in the musculoskeletal department reviewed all radiological data (radiographs, CT, and magnetic resonance imaging [MRI]) independently. They were blinded to patient information. They assessed degenerative changes in the intervertebral discs and posterior facet joints from C2–3 to C6–7. Thirteen patients having disc or facet joint arthrosis such as osteophytes, disc space narrowing, disc prolapse, annular tears, and decreased signal intensity were excluded from the study.
9)
Demographic data including age, sex, height, weight, and body mass index (BMI) were collected from electronic medical records after of approval of Asan Medical Center Institutional Review Board. Radiological data were measured using a picture archiving and communication system. All patients underwent simple lateral radiography, CT, and MRI of the cervical spine preoperatively. The disc heights and facet joint spaces were measured on cervical neutral lateral radiographs in the standing position at 1.8 m distance from the tube to the target. On the lateral plain radiograph, we measured the facet joint space unilaterally at each disc level; on the CT scan, we measured the facet joint space bilaterally. The disc height was measured using lateral radiographs and CT in the following manner (
Fig. 1):
(1) Consider the oblique projection or overlapping of bone images before every measurement.
(2) In a given disc, determine the four corners of the two adjacent vertebral bodies, which are located in the farthest outer surface of the cortical bone from the center of each vertebral body (A, A', B, and B').
(3) Draw a straight bisecting line (C) passing through the centers of lines A–B and A'–B'.
4) Calculate the sum of the shortest distances from the midpoint of the upper and lower endplates to the bisecting line (a + b), and record this value as the disc height.
The posterior facet joint space was measured using plain radiographs and CT in the following manner (
Fig. 2):
(1) Consider the oblique projection or overlapping of bone images before every measurement.
(2) Choose one side of the facet joint at every level (C2–7). Determine the anterior and posterior margins of the facet joints (anterior margin: anterosuperior corner of the superior articular process of the lower vertebra [black arrows in Fig. 2A]; posterior margin: posteroinferior corner of the lateral mass of the upper vertebra [white arrows in Fig. 2B]).
(3) From these points, draw lines perpendicular to the joint space (lines A and B).
(4) At the center of the space between the two lines, draw a line (C) parallel to lines A and B. The length of line C is the facet joint space.
Data Collection and Analysis
Written instructions were given to two orthopedic surgeons (orthopedic fellows), who independently measured the disc heights and joint spaces twice. After verifying the normal distribution of data, means, standard deviations, and 95% confidence intervals (CIs) of the results were calculated. The correlation between radiological data and demographic data was analyzed using linear regression.
For disc height evaluation, we defined the disc height ratio as the ratio of the height of a specific disc level to that of C2–3. For example, if the disc height of C2–3 is 4.86 mm and that of C3–4 is 4.87 mm, the C3–4 height ratio is 1.01 (4.87/4.86). Means, standard deviations, and 95% CIs of the height ratio were calculated.
Statistical Analysis
Linear correlation was investigated using Pearson correlation coefficients. The Wilcoxon signed-rank test was used to investigate any differences between the right and left facet joint spaces. Inter-rater agreement and intra-rater agreement were evaluated using intraclass correlation coefficients (ICC) with measures of absolute agreement. Ninety-five percent CIs were calculated for each ICC. Data analysis was performed using SPSS ver. 18.0 (SPSS Inc., Chicago, IL, USA).
RESULTS
Demographic Data
Of 37 patients enrolled in this study, 19 were men and 18 were women. Their mean age was 44.3 years (range, 33 to 56 years). The mean height was 164.8 cm (range, 146.6 to 183.5 cm) and the mean weight was 66.9 kg (range, 41 to 99.6 kg). A total of 148 intervertebral discs and 352 posterior facet joints were evaluated.
Disc Height Measured by Plain Radiography and CT
The number of discs for each level was as follows: C2–3, 37; C3–4, 37; C4–5, 32; C5–6, 12; and C6–7, 30. The mean disc height values measured by plain radiography and CT were 5.57 ± 0.81 mm and 4.94 ± 0.94 mm, respectively. The intra-rater agreement for the disc height was excellent in both plain radiography (ICC, 0.76; range, 0.64 to 0.82) and CT (ICC, 0.81; range, 0.69 to 0.87). Good inter-rater agreement was observed for the disc height in plain radiography (ICC, 0.64; range, 0.52 to 0.71) and CT (ICC, 0.71; range, 0.63 to 0.86). Plain radiography yielded greater disc height values than those measured by CT. The lower limit of the 95% CI for the disc height ratio calculated by plain radiography and CT was greater than 0.94 at all levels except for C5–6 (
Table 1).
In general, height and disc height were positively correlated, while age and disc height were negatively correlated. However, the correlation coefficient and
p-value varied for each level (
Table 2 and
Fig. 3).
Posterior Facet Joint Space Measured by Plain Radiography and CT
The number of facet joints evaluated at each level was as follows: C2–3, 74; C3–4, 72; C4–5, 66; C5–6, 70; and C6–7, 70. The mean facet joint space values measured by plain radiography and CT were 1.94 ± 0.45 mm and 1.43 ± 0.39 mm, respectively. Good intra-rater agreement and interrater agreement were observed for the facet joint space measured by plain radiography and CT (intra-rater ICC: mean 0.62, range 0.49 to 0.70 and mean 0.67, range 0.53 to 0.78, respectively; inter-rater ICC: mean 0.63, range 0.48 to 0.72 and mean 0.66, range 0.51 to 0.74; respectively). Plain radiography yielded greater facet joint space values than those measured by CT. The lower limit of the 95% CI of the joint space measured by plain radiography was greater than 1.4 mm at all levels. The lower limit of the 95% CI of the joint space measured by CT scan was greater than 1.2 mm at all levels (
Table 3). There was no difference between the right and left joint spaces (
p > 0.05).
Generally, there was a positive correlation between height and joint space, but the correlation coefficient and
p-value varied for each level (
Table 4 and
Fig. 4).
DISCUSSION
Several scoring systems have been developed to assess cervical disc degeneration based on MRI,
910111213) since MRI seems to be the most sensitive and reliable method for assessing intervertebral disc pathology.
913) However, MRI is not as reliable when facet arthrosis is present, in which CT scan is the best modality for diagnosis.
4) Thus, in order to determine normal disc height and facet joint space values, we reviewed only patients who underwent both CT and MRI. Thirteen patients who showed intervertebral disc pathology and facet arthrosis in CT and MRI were excluded.
Establishing standard values for normal disc height, disc height ratio, and facet joint space in this population was the primary aim of our study. It is generally accepted that disc height gradually decreases with age, and, therefore, it is difficult to define the normal value for disc height. In previous scoring systems, the criteria for gauging the amount of cervical disc space narrowing are vague. The Kellgren grading system uses subjective terms such as possible, moderate, and severe narrowing to quantify degeneration.
3) The use of such subjective terms is a major drawback of this scoring system. The scoring system developed by Walraevens et al.
4) compares the index disc to the adjacent disc. This method is more objective and is used in the evaluation of lumbar discs,
14) but it relies on the assumption that the adjacent disc is healthy, and the adjacent disc may not always be representative of a normal disc.
To overcome this limitation, we postulated that it might be more effective to compare the disc height of the index level to the disc height of C2–3. C2–3 could potentially be a good reference for comparison because disc degeneration at C2–3 is relatively rare. In our study, we presented a descriptive analysis of the disc height ratios for C3–4, C4–5, C5–6, and C6–7. Except for C5–6, the 95% CI of the disc height ratio had a relatively small range from 0.94 to 1.08. Therefore, we recommend the disc height ratio as a reference for evaluating disc space narrowing. For example, if the C2–3 disc height is 5.0 mm and C3–4 disc height is 4.0 mm on the simple lateral radiograph, the height ratio of C3–4 is 0.8 (4/5), and the lower end of the 95% CI of disc height ratio at C3–4 is 0.98. Therefore, disc space narrowing at C3–4 is suspected.
The lower end of the 95% CI of the facet joint space measured by radiography and CT was greater than 1.4 mm and 1.2 mm at all levels, respectively. The lower end of the 95% CI of the disc height measured by simple radiography and CT was greater than 5.0 mm and 4.5 mm at all levels, respectively. Thus, these values may be considered as reference for determining standard values at each level.
Disc height and facet joint space were both statistically significantly correlated with patient height (
Tables 2 and
4,
Figs. 3 and
4). A weak correlation existed between disc height and weight, and a negative correlation existed between disc height and age, but no statistical significance was observed. Thus, when selecting an appropriate implant to replace a herniated disc, surgeons should consider the patient's height as well as estimated normal disc height.
The disc height and facet joint space measured by plain radiography were greater than those measured by CT. This result is mainly due to the magnification error of plain radiography. Although the tube-to-receiver distance is constant, the longer the target (in this study, cervical spine)-to-receiver distance was, the greater the magnification error.
15) Magnification errors should be taken into account for the different distances on anteroposterior and lateral projections of plain radiographs. The distance from the anatomic center of the spine to the lateral shoulder and receiver is much greater than the distance to the receiver through the posterior neck on the anteroposterior projection.
15) Shigematsu et al.
7) reported the average magnification error in the cervical spine was about 20% in their study population.
Yukawa et al.
16) noted a mean disc height of 5.8 mm in 1,230 asymptomatic volunteers. However, in that study, the distance between the X-ray tube and the receiver was 1.5 m, without magnification correction. In contrast, lateral cervical radiography at our institution was performed at a tube-to-target distance of 1.8 m. This difference would result in a wide range of values for disc height measured by simple radiography, requiring calibration to determine normal disc height.
The facet joint space values measured by CT were less than those measured by plain radiography. In addition to the magnification errors caused by plain radiography, we attributed this to the limitation of our method of measurement using CT. Specifically, we chose to evaluate the sagittal image at the center of each lateral mass along its long axis, instead of the widest image. This might also explain why the values of the disc space measured by CT were less than the values determined by plain radiography.
For ethical reasons, it was not possible to obtain nondegenerative cervical spine radiologic data without patient consent. Therefore, we were only able to analyze the data of patients who underwent ADR surgery at our hospital. Most patients had disc herniation at C5–6, so we were only able to analyze 12 discs at C5–6. Since degenerative changes are common at C5–6, this may be a major limitation in our study. In addition, the study had a relatively small sample size. However, because strict inclusion criteria were applied by using concomitant CT and MRI data, a homogeneous target population could be analyzed.
There were other limitations, including the failure to check measurement errors and the retrospective design of the study. Therefore, further investigation with adjustment for magnification errors is needed. However, the significance of this study is that it is the first study to assess the normal disc height ratio and facet geometry in a Korean population.
In conclusions, in a Korean population, the normal cervical disc height was about 5.0 mm and the normal facet joint space value was about 1.4 mm. The disc height ratio can be reliably used to identify normal cervical disc height in patients with mild degeneration. Patient height was positively correlated with disc height and facet joint space values. Thus, when selecting an appropriate cervical implant, surgeons should consider patient height as well as estimated normal disc height.
Figures and Tables
Fig. 1
Method used to measure disc height with plain radiography and computed tomography. (1) Consider the oblique projection or overlapping of bone images before measuring. (2) Determine the four corners of the two adjacent vertebral bodies (A, A', B, and B'). (3) Draw a straight bisecting line (C) passing through the centers of line A–B and A'–B'. (4) Calculate the sum of the shortest distances from the midpoint of the upper and lower endplates to the bisecting line (a + b).
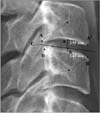
Fig. 2
Method used to measure the posterior facet joint space with plain radiography (A) and computed tomography (B). (1) Consider the oblique projection or overlapping of bone images before measuring. (2) Choose one side of the facet joint at every level (C2–7). Determine the anterior and posterior margins of the facet joint (anterior margin: anterosuperior corner of the superior articular process of the lower vertebra [black arrows]; posterior margin: posteroinferior corner of the lateral mass of the upper vertebra [white arrows]). (3) From these points, draw lines perpendicular to the joint space (lines A and B). (4) At the center of the space between the two lines, draw a line (C) parallel to lines A and B. The length of line C is the joint space of the facet joint. Post.: posterior, Ant.: anterior.
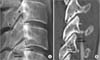
Fig. 3
Correlation between height and disc height measured by plain radiography and computed tomography (CT). Height and disc height were positively correlated both in radiography (A) and CT (B).
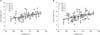
Fig. 4
Correlation between height and facet joint space measured by plain radiography and computed tomography (CT). There was a positive correlation between height and joint space both in radiography (A) and CT (B).

Table 1
Disc Height and Disc Height Ratio Measured by Plain Radiography and Computed Tomography

|
Variable |
Radiography |
Computed tomography |
|
Disc height |
95% CI |
Height ratio (95% CI) |
Disc height |
95% CI |
Height ratio (95% CI) |
|
C2–3 |
5.57 ± 0.81 |
5.31–5.83 |
- |
4.86 ± 0.87 |
4.58–5.14 |
- |
|
C3–4 |
5.55 ± 0.71 |
5.32–5.78 |
1.00 ± 0.08 (0.98–1.03) |
4.87 ± 0.78 |
4.62–5.12 |
1.01 ± 0.13 (0.97–1.05) |
|
C4–5 |
5.46 ± 0.72 |
5.22–5.69 |
0.98 ± 0.12 (0.94–1.02) |
4.79 ± 0.79 |
4.54–5.05 |
1.00 ± 0.17 (0.95–1.06) |
|
C5–6 |
5.30 ± 0.75 |
4.83–5.76 |
0.99 ± 0.14 (0.90–1.08) |
5.02 ± 0.91 |
4.46–5.58 |
1.05 ± 0.19 (0.93–1.17) |
|
C6–7 |
5.83 ± 1.01 |
5.47–6.20 |
1.05 ± 0.15 (1.00–1.10) |
5.48 ± 0.81 |
5.18–5.77 |
1.13 ± 0.28 (1.03–1.23) |
|
All |
5.57 ± 0.81 |
5.44–5.70 |
1.00 ± 0.04 (0.98–1.02) |
4.94 ± 0.94 |
4.79–5.09 |
1.02 ± 0.18 (0.96–1.12) |
Table 2
Correlation of the Demographic Data and Disc Height Measured by Plain Radiography and Computed Tomography

|
Variable |
Radiography |
Computed tomography |
|
Age |
Height*
|
Weight |
BMI |
Age |
Height*
|
Weight |
BMI |
|
C2-3 |
|
|
|
|
|
|
|
|
|
Co. coeff. |
−0.22 |
0.50 |
0.45 |
0.32 |
0.04 |
0.452 |
0.26 |
0.27 |
|
p-value |
0.18 |
0.001 |
0.005 |
0.05 |
0.79 |
0.002 |
0.12 |
0.11 |
|
C3-4 |
|
|
|
|
|
|
|
|
|
Co. coeff. |
−0.25 |
0.58 |
0.46 |
0.25 |
−0.10 |
0.40 |
0.35 |
0.27 |
|
p-value |
0.14 |
< 0.001 |
0.004 |
0.14 |
0.57 |
< 0.001 |
0.04 |
0.11 |
|
C4-5 |
|
|
|
|
|
|
|
|
|
Co. coeff. |
−0.21 |
0.48 |
0.39 |
0.23 |
−0.18 |
0.50 |
0.26 |
0.22 |
|
p-value |
0.23 |
0.003 |
0.02 |
0.19 |
0.29 |
0.005 |
0.12 |
0.20 |
|
C5-6 |
|
|
|
|
|
|
|
|
|
Co. coeff. |
−0.31 |
0.44 |
0.18 |
−0.22 |
−0.279 |
0.40 |
0.07 |
−0.25 |
|
p-value |
0.38 |
0.05 |
0.61 |
0.54 |
0.43 |
0.03 |
0.86 |
0.48 |
|
C6-7 |
|
|
|
|
|
|
|
|
|
Co. coeff. |
−0.24 |
0.45 |
0.39 |
0.27 |
−0.010 |
0.45 |
0.16 |
0.08 |
|
p-value |
0.22 |
0.01 |
0.04 |
0.16 |
0.60 |
0.01 |
0.42 |
0.70 |
Table 3
Posterior Facet Joint Space Measured by Plain Radiography and Computed Tomography

|
Variable |
Radiography |
Computed tomography |
|
Facet joint space |
95% CI |
Facet joint space |
95% CI |
|
C2–3 |
1.61 ± 0.44 |
1.46–1.75 |
1.33 ± 0.35 |
1.20–1.44 |
|
C3-4 |
2.01 ± 0.41 |
1.87–2.15 |
1.47 ± 0.36 |
1.35–1.60 |
|
C4-5 |
2.04 ± 0.37 |
1.91–2.17 |
1.61 ± 0.45 |
1.46–1.77 |
|
C5-6 |
2.09 ± 0.40 |
1.96–2.23 |
1.52 ± 0.38 |
1.39–1.65 |
|
C6-7 |
2.00 ± 0.43 |
1.83–2.12 |
1.41 ± 0.37 |
1.29–1.54 |
|
Total |
1.94 ± 0.45 |
1.87–2.00 |
1.43 ± 0.39 |
1.38–1.49 |
Table 4
Correlation between Demographic Data and Facet Joint Values Measured by Plain Radiography and Computed Tomography

|
Variable |
Radiography |
Computed tomography |
|
Age |
Height*
|
Weight |
BMI |
Age |
Height*
|
Weight |
BMI |
|
C2-3 |
|
|
|
|
|
|
|
|
|
Co. coeff. |
−0.38 |
0.43 |
0.40 |
0.15 |
−0.07 |
0.33 |
0.38 |
0.40 |
|
p-value |
0.02 |
0.01 |
0.02 |
0.37 |
0.68 |
0.05 |
0.01 |
0.02 |
|
C3-4 |
|
|
|
|
|
|
|
|
|
Co. coeff. |
−0.47 |
0.69 |
0.43 |
0.08 |
−0.23 |
0.42 |
0.35 |
0.14 |
|
p-value |
0.004 |
< 0.001 |
0.009 |
0.63 |
0.16 |
0.01 |
0.03 |
0.41 |
|
C4-5 |
|
|
|
|
|
|
|
|
|
Co. coeff. |
−0.18 |
0.66 |
0.54 |
0.40 |
−0.02 |
0.31 |
0.34 |
0.23 |
|
p-value |
0.32 |
< 0.001 |
0.001 |
0.02 |
0.86 |
0.04 |
0.05 |
0.19 |
|
C5-6 |
|
|
|
|
|
|
|
|
|
Co. coeff. |
−0.34 |
0.64 |
0.60 |
0.36 |
−0.08 |
0.34 |
0.33 |
0.44 |
|
p-value |
0.04 |
< 0.001 |
< 0.001 |
0.03 |
0.61 |
0.05 |
0.04 |
0.01 |
|
C6-7 |
|
|
|
|
|
|
|
|
|
Co. coeff. |
−0.19 |
0.49 |
0.41 |
0.23 |
−0.06 |
0.44 |
0.34 |
0.20 |
|
p-value |
0.26 |
0.003 |
0.013 |
0.19 |
0.32 |
0.01 |
0.09 |
0.29 |
ACKNOWLEDGEMENTS
This study was presented at the 29th Spring Congress of the Korean Society of Spine Surgery in 2012.
References
1. Szpalski M, Gunzburg R, Mayer M. Spine arthroplasty: a historical review. Eur Spine J. 2002; 11:Suppl 2. S65–S84.

2. Cote P, Cassidy JD, Yong-Hing K, Sibley J, Loewy J. Apophysial joint degeneration, disc degeneration, and sagittal curve of the cervical spine: can they be measured reliably on radiographs? Spine (Phila Pa 1976). 1997; 22(8):859–864.
3. Kellgren JH, Jeffrey MR, Ball J. The epidemiology of chronic rheumatism: atlas of standard radiographs of arthritis. Oxford: Blackwell Scientific;1963.
4. Walraevens J, Liu B, Meersschaert J, et al. Qualitative and quantitative assessment of degeneration of cervical intervertebral discs and facet joints. Eur Spine J. 2009; 18(3):358–369.
5. Kettler A, Wilke HJ. Review of existing grading systems for cervical or lumbar disc and facet joint degeneration. Eur Spine J. 2006; 15(6):705–718.
6. Kettler A, Rohlmann F, Neidlinger-Wilke C, Werner K, Claes L, Wilke HJ. Validity and interobserver agreement of a new radiographic grading system for intervertebral disc degeneration: part II. cervical spine. Eur Spine J. 2006; 15(6):732–741.
7. Shigematsu H, Koizumi M, Yoneda M, Iida J, Oshima T, Tanaka Y. Magnification error in digital radiographs of the cervical spine against magnetic resonance imaging measurements. Asian Spine J. 2013; 7(4):267–272.
8. Frobin W, Leivseth G, Biggemann M, Brinckmann P. Vertebral height, disc height, posteroanterior displacement and dens-atlas gap in the cervical spine: precision measurement protocol and normal data. Clin Biomech (Bristol, Avon). 2002; 17(6):423–431.
9. Christe A, Laubli R, Guzman R, et al. Degeneration of the cervical disc: histology compared with radiography and magnetic resonance imaging. Neuroradiology. 2005; 47(10):721–729.
10. Lehto IJ, Tertti MO, Komu ME, Paajanen HE, Tuominen J, Kormano MJ. Age-related MRI changes at 0.1 T in cervical discs in asymptomatic subjects. Neuroradiology. 1994; 36(1):49–53.
11. Kolstad F, Myhr G, Kvistad KA, Nygaard OP, Leivseth G. Degeneration and height of cervical discs classified from MRI compared with precise height measurements from radiographs. Eur J Radiol. 2005; 55(3):415–420.
12. Viikari-Juntura E, Raininko R, Videman T, Porkka L. Evaluation of cervical disc degeneration with ultralow field MRI and discography: an experimental study on cadavers. Spine (Phila Pa 1976). 1989; 14(6):616–619.
13. Miyazaki M, Hong SW, Yoon SH, Morishita Y, Wang JC. Reliability of a magnetic resonance imaging-based grading system for cervical intervertebral disc degeneration. J Spinal Disord Tech. 2008; 21(4):288–292.
14. Mimura M, Panjabi MM, Oxland TR, Crisco JJ, Yamamoto I, Vasavada A. Disc degeneration affects the multidirectional flexibility of the lumbar spine. Spine (Phila Pa 1976). 1994; 19(12):1371–1380.
15. Rampersaud R, Fehlings M, Harrop J, et al. Validation of digital radiology measurement tools for quantitative spinal imaging. Top Spinal Cord Inj Rehabil. 2006; 12(1):11–21.
16. Yukawa Y, Kato F, Suda K, Yamagata M, Ueta T. Age-related changes in osseous anatomy, alignment, and range of motion of the cervical spine: part I. radiographic data from over 1,200 asymptomatic subjects. Eur Spine J. 2012; 21(8):1492–1498.


 PDF
PDF ePub
ePub Citation
 Print
Print


 XML Download