

 PDF
PDF ePub
ePub Citation
 Print
Print


The human spine is a complex structure that supports the trunk and secures the spinal cord. It consists of vertebrae and the discs between them which act as cushions and neutralize the mechanical shocks that are imposed on them. However, as the age increases, the muscle density, bone strength, and intervertebral discs' flexibility decrease; thus, the lumbar area of the spinal column loses its flexibility and the ability to absorb mechanical shocks, resulting in lower back pain. This disorder causes various social, financial, and occupational problems for the patients. Approximately 80% of the adults above 50 years of age suffer from lower back pain. However, this can be also observed in the youth. Although around 90% of the back pain can be treated by physiotherapy restoring the patient's ability after a while, 10% are acute pain and cannot be treated with physiotherapy and require surgery.12) Acute lower back pain is mostly due to herniated discs and 98% of the cases occur in L4–5; it sometimes happens in S1–L5 and L3–4. Although it can occur in any age, it is mostly observed in males between 30 and 50 years of age. Spinal disc herniation can occur with different degrees and puts pressure on the neural root. Based on the area of the disc herniation, it is categorized into middle, lateral or posterior.3) Various finite element studies such as those by Pitzen et al.4) and Ibarz et al.5) investigated the effects of the discs' rotational degree on the imposed torque and vertebral displacement as a result of body weight (BW).
Back traction is one of the oldest treatment methods in intervertebral disc physiotherapy. However, it is not recommended for acute disc herniation. The back traction method creates a gap between the joint surfaces and reduces the pressure on them. Consequently, the pressure on the neural root and the inflammation risks decrease. As the ligaments are stretched, the disc returns to its original position. Back traction acts as an antispastic treatment for the muscles and fixes the abnormal shape of the spinal cord column.67)
The main goal of this study is to investigate the efficacy of the traction bed on the spine. This has been achieved using three-dimensional (3D) modeling and a finite element method. In addition, the effects of traction on ligament stresses in the lumbar area were studied. To the best of our knowledge, this study is the first attempt to analyze intervertebral displacement and the induced stresses in the ligaments of the lumbar area during the traction bed therapy using a finite element method. Since the ligaments and muscles are completely involved in the traction therapy, an understanding of the effects of each loading on them might be extremely helpful during the therapy and reduce the risk of injury. In this study, the correlation of the induced stresses in ligaments and the traction angle has been analyzed. We thought this could be useful for physicians to predict the effects of traction treatment on the patients and decide on a patient specific traction profile prior to treatment.
METHODS
Cross-sectional computed tomography (CT) images of a female patient's lumbar area (31 years of age, 80 kg) were acquired using a 64-multislice CT scanner (Siemens, Munich, Germany). The images were used in order to create a 3D model by utilizing MIMICs ver. 17.0 (Materialise, Leuven, Belgium), which is often used to create 3D models using CT or magnetic resonance imaging (MRI) images.
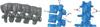
Afterwards, this model was imported to Abaqus 6.14 (Simulia, Waltham, MA, USA) for geometrical preprocessing, mesh generation, loading and finite element analysis. The intervertebral ligaments (anterior longitudinal ligament [ALL], posterior longitudinal ligament [PLL], intertransverse ligament [ITL], interspinous ligament [ISL], and supraspinous ligament [SSL]) were introduced to the model in the Abaqus software. The result model is shown in Fig. 1.
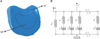
Intervertebral discs were considered to consist of nucleus pulposus and annulus fibrosus parts (Fig. 2A) that were modeled using viscoelastic materials.8) The viscoelastic behavior of the model is explained in the following paragraph.910)
Viscoelastic materials are characterized by a combination of elastic behavior, which stores energy during deformation, and viscous behavior, which dissipates energy during deformation. The elastic behavior is rate-independent and represents the recoverable deformation due to mechanical loading. The viscous behavior is rate-dependent and represents dissipative mechanisms within the material. A wide range of materials (such as polymers, glassy materials, soils, biologic tissue, and textiles) exhibit viscoelastic behavior. Fig. 2B shows a one-dimensional representation of a generalized Maxwell solid. It consists of a spring element in parallel with a number of spring and dashpot Maxwell elements.
The spring's stiffness is denoted as µi, the dashpot viscosity as ηi (i = 1.2.….n). The relaxation time is defined as the ratio of viscosity to stiffness: τi = µi∕µi . In three dimensions, the constitutive model for a generalized Maxwell model is given by:

where σ is Cauchy stress; e is deviatoric strain; Δ is volumetric strain; τ is past time; I is identity tensor; and G(t) and K(t) are the Prony series shear and bulk-relaxation moduli, respectively.
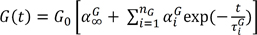
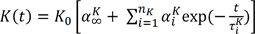
Where G0 and K0 are relaxation moduli at t = 0, nG and nK are the number of Prony terms; αiG and αiK are relative moduli and τiG and τiK are relaxation time.
For use in the incremental finite element procedure, the solution for Equation (1) at t1 = t0 + Δt is:


Where si and pi are the deviatoric and pressure components, respectively, of the Cauchy stress for each Maxwell element. With Prony series parameters, we can model each material that has viscoelastic behavior, such as the intervertebral disc.
Mechanical properties of the vertebrae, discs, and ligaments were gathered using the previous studies.456781112) Vertebrae, intervertebral discs, and ligaments were considered as isotropic elastic material, viscoelastic material and isotropic elastic material, respectively.9)
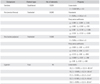
Since the vertebrae act as a solid material, we mainly focused on the mechanics of the soft tissue in this study and the bones are much stiffer than the soft tissue, the triangular shell elements were used to generate meshes just for the surface of the bones.1013) Intervertebral discs and ligaments were discretized using tetrahedral 3D elements and truss elements, respectively.11) The material properties, number of elements and element properties are summarized in Table 1.
Based on the previous studies, a tie contact was assumed between the vertebrae and disks and also between the vertebrae and ligaments.1113) Studies showed that traction loading on the lumbar area of the spinal column should be approximately between 45% and 60% of the BW.1141516) In this study, firstly we used 45% and 55% of the BW as traction loading. Since the traction belt imposes the load on the L5 vertebra, we placed the load on L5 and fixed L1 in our model. It was assumed that the patient was lying down and the traction load was imposed downward to the L5 vertebra. Then, the model was analyzed using the von Mises method with the Abaqus software.
In the next stage, in order to study the effects of the traction on the ligaments of the lumbar area, a Taguchi design of experiment (L16) with various loading angles and magnitudes was designed. The data was analyzed statistically and the effects of these parameters on ligaments were studied (Table 2). Fig. 3 shows the load and angle application method during various loadings. Loadings are 1 equal to 25% of BW, 2 equal to 45% of BW, 3 equal to 55% of BW and 4 equal to 85% of BW. Loading angles are 1 equal to 0°, 2 equal to 30°, 3 equal to 60° and 4 to equal 75°.
RESULTS
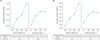
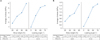
This study aimed to investigate the efficacy of the traction bed in treating lower back pain and its effects on displacement of intervertebral discs. Figs. 4 and 5 show the loading and relative displacement of the L4–5 and L3–4 intervertebral discs under 45% and 55% of BW loading.
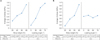
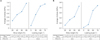
The absolute value of displacement can be calculated by subtracting the relative displacement of the lower disc from the upper disc. For example, the absolute displacement of the L4–5 vertebrae in 45% of BW loading is 1.493 mm (ΔL = 5.972–4.479). In this regard, the absolute displacement of the L3–4 vertebrae in 45% of BW loading is 0.995 mm and in 55% of BW loading, the absolute displacement of L4–5 and L3–4 are 2.433 mm and 1.825 mm, relatively. Figs. 6, 7, 8, 9, 10 show the results of Taguchi design of experiment in order to study the effects of traction on lumbar spine ligaments.
The tables and figures above show the effects of the BW and loading angle on the ligaments. In the L3–4 area, BW had 63.2%, 42.6%, 44.68%, 50.2%, and 47.85% effect on the ALL, PLL, ITL, ISL, and SSL, respectively. In the L4–5 area, these values were 67.7%, 89.4%, 46.6%, 43.42% and 42.65%, respectively. However, traction angle had 36.8%, 57.4%, 55.32%, 49.8%, and 52.15% effect on ALL, PLL, ITL, ISL, and SSL in the L3–4 area, respectively. In the L4–5 area, these values were 32.3%, 10.6%, 53.4%, 56.58%, and 57.35%, respectively.
DISCUSSION
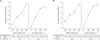
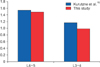
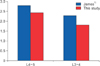
Previous studies that investigated the amount of displacement before and after the traction therapy using CT or MRI reported an average of 1.54 and 1.17 mm displacement for the L4–5 and L4–L3 levels under 45% BW loading, respectively.16) Additionally, the reported values under 55% BW loading were 2.8 and 2.3 mm, respectively.115) Figs. 11 and 12 show the comparison of results between these studies and ours.
As seen in Figs. 5 and 6, with an approximately 12% error, there is similarity between our results and previous studies. These studies reported the average displacement values from multiple subjects, whereas in the current study we used one subject, which can explain the differences between the results. Taking this into account, our results are very close to the average value described in previous studies.
The results of the Taguchi experiment showed that BW had the most effect on the ALL in the L3–4 area and the PLL in the L4–5 area. Also, loading angle had the most effect on the PLL in the L3–4 area and the SSL in the L4–5 area. By utilizing the Taguchi experiment's data, we were able to study the effects of each loading angle on the ligaments. For example, it could be observed that loading angle had no significant effect on the PLL in the L4–5 area, whereas in the L3–4 area, the same ligament is affected by 57.4%.
The maximum value of mechanical stresses, which was equal to 1.1463 MPa, was observed on the ALL in the L3–4 area. The mechanical stress for the PLL in the L3–4 area in the case of loading with 75° was equal to 1.7425 MPa. Under the same loading, the ITL experienced the maximum stress of 1.3228 MPa. The maximum stresses for ISL and SSL in the L3–4 area under loading with 75° were equal to 6.011 MPa and 5.529 MPa, respectively. By using the same method, all of the ligaments can be studied extensively and their behavior can be analyzed under different loading conditions. An optimal angle for traction can be obtained using this method. An optimal angle is different for different patients and is determined based on the decreased height of the intervertebral disc, weight and height of patients. Also, based on which ligament needs to be stretched, an optimal angle can be determined. The results of these experiments can assist the physician in finding out the effects of each loading condition on various ligaments.
The findings of this study show that the traction bed is highly effective in reducing the lower back pain. This simulation can be very helpful for the physician to deliver a better treatment. By simulating different loading patterns and evaluating displacement under each loading, the physician would be able to choose the best therapy for the patient.
The method we used in this study can be considered before actual application of the traction therapy. After extracting a spinal model of a patient, based on the simulation force for desired outcome, the traction angle can be adjusted. In addition, if it is necessary to stretch a specific ligament, it would be possible to determine the desired angle and force for this purpose based on simulation results. However, in order for the clinical application of this method, more case study investigations are necessary.
In conclusion, the proposed method in this study can be very useful in the quantification of the possible effects of the traction bed therapy. MRI or CT images can be utilized to create patient-specific models for further analysis of the impact of the traction therapy at different levels and under different directions of loading, which would and consequently offer the appropriate parameters for the therapy.


 XML Download