

 PDF
PDF ePub
ePub Citation
 Print
Print


The risk of femoral head collapse in patients with osteonecrosis of the femoral head (ONFH) depends on the location and extent of the necrotic lesion.12) Femoral head collapse does not occur in those with a small lesion located in the non-weight bearing area.3) A large necrotic lesion collapses under mechanical stress, which impairs the reparative process of the necrotic area, resulting in the later development of secondary osteoarthritis.23) This collapse can be prevented and repaired if the lesion is located in the non-weight bearing area.3) The principal concept of femoral osteotomy in the treatment of ONFH was first reported by Merle D'Aubigne et al.4) Transtrochanteric rotational osteotomy (TRO), which was developed by Sugioka,5) transposes the intact femoral head to the weight-bearing area of the acetabulum. This is a controversial procedure with inconsistent results. Studies in Asian countries have reported successful outcomes ranging from 60% to 86%.67891011121314) Most of these studies discuss the postoperative intact area of the femoral head/acetabular weight-bearing portion ratio on plain anteroposterior (AP) radiographs after a TRO.610121516)
There are only a few reports available on the healing of the transposed osteonecrotic area after TRO in the literature.121718192021) Hisatome et al.7) reported progressive collapse of the transposed necrotic area in 10 hips (40%) at a mean follow-up of 6.4 years after TRO; of these, 7 hips (70%) had narrowing of the joint space. Prevention of collapse of the transposed necrotic area is important for successful long-term results.7) Sugioka et al.12) reported the necrotic area was replaced by living bone tissue (in the presence of a pseudocyst) in one hip, in the histological analyses of two femoral heads treated by TRO. Yasunaga et al.19) reported no collapse of the new weight-bearing area in the histological analysis of the necrotic area at 2.5 years after TRO.
The reparative process of the transposed osteonecrotic area is an important aspect in understanding the pathophysiology of osteonecrosis after TRO. We evaluated TRO in terms of the reparative process of the transposed osteonecrotic lesion on computed tomography (CT) scans and the correlation of the reparative process with the clinical outcome and other perioperative factors.
METHODS
This retrospective present study was approved by the Institutional Review Board of Korea University Guro Hospital (IRB No. MD 15007). Informed consent was obtained from all the patients prior to the study.
TRO was performed in 82 patients (88 hips) with ONFH between 1997 and 2009 at our institution. Out of the 88 hips, 30 hips were revised with total hip arthroplasty. Among the remaining 58 hips, we included only patients with the femoral head preserved at the time of final follow-up after TRO, those who had undergone more than two sequential CT scans, those without major complications such as progressive varus, delayed union of osteotomy site and femoral neck fracture (since these would adversely affect the healing process of the osteonecrotic lesion) and patients with a minimum follow-up of 5 years (mean, 9.1 years; range, 5 to 12 years). Ultimately, 28 hips (27 patients) in 21 men (22 hips) and 6 women (6 hips), with an average age of 34 years (range, 18 to 59 years), were included in the study. The causes of ONFH were as follows: use of steroids in 4 hips, alcohol in 19 hips, and idiopathy in 5 hips. A total of 14 hips were classified as stage II-C, 8 as stage III-B, and 6 as stage III-C, according to the Association Research Circulation Osseous (ARCO) staging system.22) Based on the location of osteonecrotic lesions in the femoral head on T1-weighted magnetic resonance images (MRIs), the cases were classified as C1 type in 15 hips and C2 type in 13 hips according to the classification system proposed by Sugano et al.23)
All patients underwent Sugioka's TRO with either anterior or posterior rotation. The extent of intact area was evaluated on the radiographic view as described by Sugioka et al.13) and anterior or posterior rotation was planned accordingly. The ratio of the intact area to the total area of the femoral head was calculated according to the method described by Sugioka et al.13) and the extent of necrotic area was estimated as a percentage on preoperative MRI. The largest AP diameter of the femur head (R), the longest AP length of the necrotic portion (A), and the longest mediolateral length of the necrotic portion (B) were measured on axial T1-weighted MRI. We estimated the extent of the necrotic area as percentage using the following equation: [(A × B) / R2] × 100.24) Anterior TRO was performed in 19 hips and posterior TRO in 9 hips. The Anterior rotation ranged from 75° to 100° (mean, 86°), and posterior rotation ranged from 90° to 130° (mean, 105°). We followed the essential steps of the basic surgical procedure recommended by Sugioka5) and Sugioka and Yamamoto.14)
Patients started active range of motion exercises, as per their pain tolerance. Toe-touch weight-bearing with crutches was encouraged for the first 6 weeks, followed by partial weight-bearing. Full weight-bearing was permitted after 3 months, depending on the clinical and radiological union. The patients were followed clinically and radiographically with a 1-month interval for the first 6 months, with 3–6 month intervals for the next 2 years, and yearly thereafter. Bone scintigraphy was routinely performed 2–4 weeks postoperatively, to confirm blood supply to the rotated femoral head segment. The first CT scan was performed at an average follow-up of 2.1 years (range, 1 to 5 years), the second at 5.7 years (range, 3 to 8 years), the third 7.6 years (range, 6 to 11 years) and the fourth 9.4 years (range, 7 to 12 years) postoperatively in most patients.
The healing process of the necrotic lesions revealed on the follow-up CT scans was categorized into 3 patterns: group 1 (partial/incomplete repair) showing partial healing of the necrotic area with mainly mixed heterogeneous sclerosis and cysts, group 2 (complete repair) showing mainly normal trabecular bone with or without small cysts, and group 3 (fragmentation) showing minimal healing and eventual fragmentation of the necrotic lesion.
We reviewed follow-up radiographs to evaluate the immediate postoperative intact area, joint space narrowing, osteophytes, and the collapse of the femoral head (in the newly established weight-bearing area and the transposed necrotic area). Healing of the osteonecrotic lesion on plain radiographs (performed at the final follow-up) has been described by the presence of either mixed sclerotic and lucent areas or normal bony architecture.17) The following features evaluated on CT scans; the morphology of the transposed osteonecrotic area, sclerosis, cystic changes, fragmentation, and collapse of the femoral head.
We evaluated the collapse of the transposed necrotic area on postoperative axial, coronal, and sagittal CT scans. We measured the collapse from a circle that fitted the normal contour of the femoral head and divided it into 3 categories; minimal (< 2 mm), mild (2–3 mm), and moderate (> 3 mm).3)
A clinical assessment was performed based on the Harris hip score (HHS)25) postoperatively. The differences in sex, etiology, staging, type of preoperative lesion, the direction of rotation, and collapse among the healing patterns were determined by using Fisher exact test. The patient age, percentage of necrotic area, preoperative intact area, immediate postoperative intact area, HHS, and follow-up years were compared using the modified Kruskal-Wallis test. The relationship between the collapse of the transposed osteonecrotic area on the CT scan and postoperative HHS was assessed using the Mann-Whitney U-test. Statistical analyses were performed using IBM SPSS ver. 20.0 (IBM Co., Armonk, NY, USA). A p-values < 0.05 were considered statistically significant. Two observers evaluated the healing pattern and collapse on the CT scan with a minimum interval of 3 weeks. Observers were blinded to each other and their previous assessment. The intraobserver reliability of all measurements was excellent (kappa coefficient, 0.88–1.00). The interobserver reproducibility of all measurements was excellent (kappa coefficient, 0.88–0.93).
RESULTS
Based on the final follow up radiographs taken after TRO, the hips could be classified into two groups; Fourteen hips (50%) showed mixed sclerotic and lucent changes whereas a normal bony architecture was seen in the remaining 14 hips (50%) at an average follow-up of 9.1 years (range, 5 to 12 years).
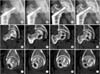
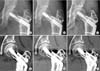
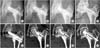
The healing process of the necrotic lesions revealed A on the follow-up CT scans was categorized into 3 patterns: group 1 (partial/incomplete repair), cystic changes with heterogeneous sclerosis in 13 hips (46%) (Fig. 1); group 2 (complete repair), mainly normal trabecular bone with or without small cysts in 9 hips (32%) (Fig. 2); and group 3 (fragmentation), minimal healing and eventual fragmentation of the necrotic lesion in 6 hips (22%) (Fig. 3).
On follow-up CT scans, we also found minimal (13 hips) to mild (4 hips) collapse of the transposed osteonecrotic area in 17 hips (60%). However, there was no joint space narrowing or collapse of the newly established weight-bearing area. Femoral head osteophytes were present in 16 hips (57%).
The mean HHS at the final follow-up was 89.6 ± 6.7 (range, 75 to 98). The clinical results were good to excellent in 25 hips (89%, HHS > 80) and fair in the remaining 3 hips (HHS < 80). The postoperative HHS at the final follow-up in 3 healing patterns was 90.7 ± 6.2 (range, 79 to 98; group 1), 91.4 ± 5.9 (range, 81 to 92; group 2) and 84.5 ± 7.2 (range, 75 to 91; group 3) (p = 0.132) respectively. The collapse of the transposed osteonecrotic area in the CT scan, was found to have a significant relationship with the healing pattern (p = 0.009), as all 6 patients with fragmentation of the necrotic lesion had minimal (5) to mild (1) collapse. Furthermore, the collapse of the transposed osteonecrotic area on the CT scan of 17 hips (60%) was significantly associated with postoperative HHS (p = 0.021).
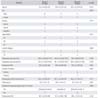
We observed no differences among the healing patterns on CT scans with regard to age, sex, etiology, type of preoperative lesion, staging, preoperative intact area, percentage necrotic area, direction of rotation, immediate and postoperative intact area (Table 1).
DISCUSSION
Cystic changes, sclerosis, fragmentation, collapse, and reparative activity in the osteonecrotic lesions, previously undetected or ill-defined on plain radiographs, are more accurately visualized and well defined on the CT scans. In our study, plain radiographs of the osteonecrotic lesions showing mixed sclerotic and lucent areas (either focal or diffuse) (Fig. 1A–D) were seen in 14 hips (50%). In the same group, we observed well-defined cysts and fragmentation of variable sizes in the transposed osteonecrotic lesion on follow-up CT scans, which were undetected on the plain radiographs. The sequential CT scans also revealed a decrease in the cyst size with marginal sclerosis and formation of a new cyst in the osteonecrotic area (Fig. 1E–L).
Among the 14 hips, classified as healed with normal bony architecture (Fig. 2A–C) on the final radiographs, 9 hips revealed small cysts in the osteonecrotic lesion and the remaining 5 showed fragmentation on sequential CT scans. Therefore, our plain radiographic findings did not correlate with the changes in the CT scan.
The available literature on the healing process of the osteonecrotic lesion is sparse. Few histological1219) and radiological studies17) have evaluated the healing of the transposed necrotic area at a specific time period. Therefore, it is difficult to understand the reparative mechanism. Furthermore, some studies have reported complete healing of the necrotic bone,1217) whereas others have showed incomplete healing19) after TRO. We observed three distinctive healing patterns on sequential CT scans after TRO. The emergence of new cystic areas in the necrotic lesion indicates resorption of the osteonecrotic bone (group 1, 13 hips) (Fig. 1E–L). There was a decrease in the size of the cyst and heterogeneous sclerosis in the osteonecrotic area potentiating the healing process by new bone formation.17) We also observed normal trabecular bone without sclerosis and small remnant cysts in 9 hips (32%) of group 2 (Fig. 2D–F). This may suggest that the necrotic bone may be gradually healing by resorption of dead bone and is remodeling with time. Sugioka et al.12) in a histological study of 2 hips reported that the osteonecrotic area was replaced by living bone in the presence of a pseudocyst.
In group 3 (6 hips) (Fig. 3E–H), the transposed osteonecrotic lesion underwent irreversible fragmentation, while the periphery of the necrotic lesion was replaced by new trabecular bone. Plain radiographs of these hips showed a normal bony architecture in 5 hips (Fig. 3A–D) and a sclerotic cystic area in 1 hip.
Collapse of the transposed osteonecrotic area on the CT scan, was found to have a significant relationship with the healing pattern (p = 0.009) (Table 1), as all 6 patients of group 3 had minimal (5) to mild (1) collapse. Furthermore, the collapse of the transposed osteonecrotic area on the CT scan of 17 hips (60%) was found to have significant relationship with the postoperative HHS (p = 0.021). However, none of the collapses of the transposed osteonecrotic area were progressive. In our study, 3 hips had a fair clinical outcome. All of these hips had major femoral head osteophytes and minimal (2) to mild (1) collapse on the CT scan.
The difference in the mechanism of the healing patterns observed on CT scans is obscure. It was difficult to predict the healing pattern after TRO from perioperative clinical and radiological factors. One of the important factors in previous histological studies is the follow-up duration. Sugioka et al.12) reported in their retrospective histological study of 2 hips that the transposed osteonecrotic lesions were completely replaced by living bone at 8 years and 6.5 years after TRO, retrospectively. However, another histological study by Yasunaga et al.19) reported incomplete healing of the transposed necrotic area at 2.5 years. In our study, we found no relationship between the healing pattern and follow-up duration (p = 0.287).
This study has several limitations. In our study, we could not perform regular follow-up CT scans in all patients due to the cost factor; this led to the inclusion of only a small number of patients. This is a retrospective study, with CT scans performed at different times during the follow-up and with a wide interval between CT scans. This may have led to missing of some healing patterns on the CT scans during the follow-up. We did not have a preoperative CT scan to compare with the changes after TRO that occurred during the healing process in the transposed osteonecrotic area. However, CT imaging can definitely demonstrate a more detailed healing process on sequential imaging such as subtle alterations in the pattern of bone trabeculation, subchondral fracture, lucency, sclerosis, and minimal collapse during the reparative stage, which were obscured or not revealed on plain radiographs.
In our study, the majority of the transposed osteonecrotic lesions showed incomplete regeneration (68%) with cysts, sclerosis, fragmentation and minimal to mild non-progressive collapse of the transposed osteonecrotic area (60%), whereas repair with normal trabecular bone was observed in only one-third of the hips that were preserved after TRO. Incomplete healing was associated with clinical and radiological results after TRO, but long-term follow-up is needed to determine the progression of degenerative changes of the hip joint.
 XML Download