

 PDF
PDF ePub
ePub Citation
 Print
Print


Sarcopenia is a syndrome characterized by progressive and generalized loss of skeletal muscle mass and strength due to senescence, which may lead to physical disability, poor quality of life, and even increased mortality.1) The unprecedentedly rapid aging process in Asian countries has drawn much attention to the geriatric condition.1)
Recently, a number of researches have been published on the prevalence and related risk factors of sarcopenia in various cohorts in Asia.23456789) To the best of our knowledge, however, the prevalence of sarcopenia among adults undergoing orthopedic surgery (OS) has never been reported. In the field of OS, bone mineral density (BMD) and bone quality have been the primary focus; however, recent studies have revealed that both bone and muscle are endocrine organs1011) that are closely associated in both formation and function.12) Moreover, sarcopenia and osteoporosis constitute a hazardous duo that causes frailty in the elderly.13) A recent study has demonstrated the synergistic effects of medications for osteoporosis and mechanical stimuli generated by the muscle, which resulted in the enhanced cortical thickness.14) Such evidence might reveal how sarcopenia adversely affects musculoskeletal health and function in the intraoperative and postoperative settings, especially among the elderly who undergo a number of OS; thus, data on the prevalence of sarcopenia in this population may be invaluable. Moreover, the exact definition of sarcopenia in the orthopaedic field is still debatable, although the European Working Group on Sarcopenia in Older People devised a working clinical definition and consensus-based diagnostic criteria for sarcopenia in 2010.1) According to these criteria, one must have low muscle mass in order to be diagnosed as sarcopenic. However, a variety of methods are currently used to define low muscle mass151617) for orthopedic patients in the absence of any consensus on the ideal criterion of low muscle mass. Recently, the combined impact of muscle loss and fat gain on the functional disability in older persons has been reported,18) and the prevalence of a condition known as sarcopenic obesity has become of great interest.
The purpose of this study was to identify the prevalence of sarcopenia and sarcopenic obesity among adult patients who had common OS of specific types, namely intra- and extracapsular proximal femoral fracture surgery and total hip/knee replacement (THR/TKR) and to compare the prevalence of sarcopenia in them with that in nonorthopedic patients at our and other outpatient departments (OPDs).
METHODS
Subjects
We retrospectively reviewed electronic medical records of 222 patients who underwent OS at Ajou University Hospital between February 2011 and April 2013 and those of 364 patients who did not have any orthopedic procedures in various OPDs including Orthopedics, Internal Medicine, and Family Medicine. The study was conducted after obtaining approval from Ajou University Hospital Institutional Review Board (IRB No. AJIRB-MED-MDB-14-172) and informed consent was waived by the IRB. Ajou University Hospital is located in an urban area with a population of more than 1 million and has served as the sole tertiary hospital for over 20 years. Initially, 401 OPD patients were considered for inclusion; however, 9.2% (37 patients) of them were excluded due to surgery on the lower extremity. All OPD patients underwent dual-energy X-ray absorptiometry (DXA) for routine BMD assessment, and most of them were prescribed medications for osteoporosis. All of the OS patients underwent wholebody DXA (Lunar iDXA; GE Healthcare, Waukesha, WI, USA) 2 weeks prior to or after surgery. Patients who underwent elective procedures such as THR and TKR underwent preoperative whole-body DXA routinely whereas patients who suffered from fragility hip fractures received DXA postoperatively when they were ambulatory and free of severe pain. Patients who did not receive whole-body DXA were excluded from the study; 23% (66 patients) of all OS patients (288 patients) who did not complete wholebody DXA during the study period were excluded.
Patient Demographics
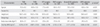
Ultimately, 586 patients (117 males and 469 females) were included in the study (Table 1). There were significantly more women in the OPD group. The average age of the patients was 66.1 ± 13.0 years. Patients undergoing OS were significantly older by 6.4 years than the OPD patients and taller, whereas body mass index (BMI) was slightly higher in the OPD group. The total hip BMD was higher in the OPD group than in the OS group. Male patients in the OS group were older (67.8 ± 12.8 year vs. 53.9 ± 18.1 year, p < 0.001), shorter (166.3 ± 7.4 cm vs. 169.4 ± 8.2 cm, p = 0.032), and lighter (62.3 ± 11.2 kg vs. 78.5 ± 20.8 kg, p < 0.001) than those in the OPD group. The average BMI of the OS group was lower than that of the OPD group (22.1 ± 3.4 kg/m2 vs. 27.2 ± 5.6 kg/m2, p < 0.001). The total hip BMD of the OS group was significantly lower than that of the OPD group (0.845 ± 0.144 g/cm2 vs. 0.979 ± 0.177 g/cm2, p = 0.011). Women were older in the OS group than in the OPD group (71.3 ± 9.5 year vs. 65.1 ± 12.2 year, p < 0.001) and their total hip BMD was lower in the OS group than in the OPD group (0.737 ± 0.146 g/cm2 vs. 0.803 ± 0.142 g/cm2, p < 0.001), while there was no significant difference in weight and BMI between the groups (58.6 ± 10.0 kg vs. 57.2 ± 9.6 kg, p = 0.185; 24.9 ± 4.0 kg/m2 vs. 24.6 ± 3.8 kg/m2, p = 0.365).
Body Composition and BMD
Body composition and BMD were measured by wholebody DXA. The accuracy error for BMD measurements was determined according to the standardized protocols from the International Society for Clinical Densitometry.19) All BMD measurements were performed by an experienced technician at the lumbar spine and the proximal femur. The total hip BMD was used for final analysis. Appendicular skeletal mass (ASM) was defined as the sum of muscle mass in the arms and legs, assuming that all nonfat and nonbone tissue is skeletal muscle. The total fat mass was recorded in grams and as a percentage of the total body weight.
Definitions of Sarcopenia and Sarcopenic Obesity
Three different measures of ASM were applied for defining sarcopenia: ASM relative to height squared, ASM relative to body weight, and ASM relative to height and total fat mass (residuals). Class I sarcopenia was defined as when the height- or weight-adjusted ASM was between 1 and 2 standard deviations (SDs) below the gender-specific mean for young adults. Class II sarcopenia was defined as when the ASM was below 2 SD.16) Height-adjusted ASM was calculated using the equation (ASM/height2, kg/m2) previously proposed by Baumgartner et al.15) The cut-off value for class II sarcopenia among Koreans was defined as 6.58 kg/m2 for men and 4.59 kg/m2 for women.20) Body weight–adjusted ASM was expressed as a percentage of lean body mass relative to body weight, skeletal muscle mass index (ASM/weight × 100 [%]),16) and the cut-off value of Koreans was defined as 29.1% for men and 23.0% for women.20) The ASM relative to height and total fat mass was determined after adjusting for height and fat mass using a linear regression model.17) The residuals of the regression model were analysed, and the 20th percentile of the distribution of residuals of all individuals was used as the cut-off point, which was –0.98 for men and –0.91 for women. Obesity among Koreans was defined as having a BMI of > 25.0 kg/m2.
Background Data
The potential demographic risk factors for sarcopenia were assessed: OS, age, gender, BMI, and total hip BMD. All subjects were Korean. The patients were categorized into 3 groups according to age (8–50 years, 51–70 years, and > 70 years) to account for the different levels of physical activity and their potential influence on sarcopenia.
Statistical Analysis
We calculated the distribution of relative ASM adjusted by height, weight, and residuals (mean, SD), the percentages of patients with class I and II sarcopenia adjusted for height and weight, and also the ratio of patients with sarcopenia when the residual method was used. We used unpaired Student t-test to compare characteristics between the OS and OPD patients. Univariate logistic regression models were used to identify the independent relative risk for class II sarcopenia. Stepwise multivariate logistic regression analysis was performed to evaluate the independent effects of age, gender, OS, BMI, and the total femoral BMD, where p-values were all less than 0.15. In the multivariate analysis, a forward method was used and age was considered a continuous variable. The level of significance was set at p ≤ 0.05. The unadjusted odds ratio (OR), 95% confidence interval (CI), and p-value estimated for each risk factor were also determined. The chi-square test and Fisher exact test were used to compare ratios when indicated. All analyses were performed using two-tailed tests on SPSS ver. 16.0 (SPSS Inc., Chicago, IL, USA).
RESULTS
Prevalence of Sarcopenia According to Different Criteria
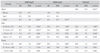
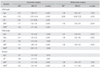
When using the height-adjusted ASM, the average relative lean mass in OS patients was 6.33 ± 1.06 kg/m2 for males and 5.85 ± 0.92 kg/m2 for females, whereas the value in OPD patients was 7.89 ± 1.47 kg/m2 for males and 5.88 ± 0.88 kg/m2 for females. The prevalence of sarcopenia in the OS group was significantly higher irrespective of the criteria (Table 2). The subjects were divided into 2 groups based on gender and then subdivided into 3 different age groups to elucidate the effects of age and gender on the prevalence of class II sarcopenia (Table 2). The residual method was the only measure in which the prevalence was higher in both male and female patients.
Comparison of Prevalence of Sarcopenia According to Different Types of Surgeries
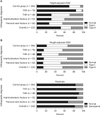
The highest rate of class II sarcopenia with height-adjusted definition was seen in patients who were diagnosed with femoral neck fracture (FNF) (Fig. 1). When adjusted for weight, the rate was highest in patients who received THR (52.6%). When using the residual method, the prevalence of sarcopenia was highest in the FNF patients (32.7%).
Prevalence of Obesity and Sarcopenic Obesity According to Different Criteria
There was no significant difference between the height-adjusted ASM and weight-adjusted ASM with regard to the prevalence of obesity and sarcopenic obesity. However, there were significantly more patients with sarcopenic obesity when the residual method was applied (p = 0.049) (Table 3).
Risk Factors According to Different Criteria for Sarcopenia
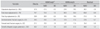
When the ASM was adjusted for height, males and elderly patients were more likely to be diagnosed as sarcopenic in the multivariate analysis (Table 4). When the ASM was adjusted for weight, older age, male sex, and lower BMI were independent risk factors. When the diagnosis of sarcopenia was determined by the residual method, lower BMI and BMD were independent risk factors.
DISCUSSION
Patients with sarcopenia are at a greater risk for falls21) and incident disability.22) Therefore, there are significant implications of sarcopenia in patients undergoing OS, especially those performed on the lower extremities among the elderly. Our study demonstrated that there were significantly more patients with sarcopenia in the OS group than in the OPD group. The prevalence ranged from 25.7% to 44.1% in the OS group according to different criteria whereas this was between 6.0% and 33.1% in the OPD group. In all age- and gender-matched subgroups (except for women > 70 years of age), the prevalence was also higher in the OS patients based on all 3 criteria even though no statistical significance was found in all subgroups. To the best of our knowledge, these results are unprecedented; hence, we were unable to find any comparative studies. This discrepancy between the OS group and the OPD groups was verified by our results of multivariate regression analysis. In the univariate logistic regression analysis, OS patients were 5.38, 1.59, and 1.98 times more likely to have sarcopenia when ASM was adjusted for height, weight, and residuals, respectively. In the multivariate analysis, however, OS was not an independent risk factor after adjusting for variables, whereas age, gender, and BMI were all independent risk factors when the ASM was adjusted for height and weight with BMD being the only independent factor when the residual method was used. These differences in patient demographics between the 2 groups resulted in significantly different values of prevalence. The demographics of the OS patients from this study were quite similar to those in recently reported studies on TKR,23) THR,24) and hip fracture surgery,25) which were conducted on Korean patients, and so were the demographics of the OPD patients in our study when compared with the data from a nationwide survey on nutritional status.20)
However, the prevalence of sarcopenia among elderly patients from a national survey in our country was 12.4% in men and 0.1% in women based on the height-adjusted criteria and 9.7% in men and 11.8% in women based on the weight-adjusted criteria.20) These values are clearly lower than ours: 41.7% of men and 10.3% of women in the OPD group were sarcopenic based on the height-adjusted criteria, whereas 41.7% of males and 43.1% of females were sarcopenic based on the weight-adjusted criteria. These discrepancies might be attributable to the fact that all of the OPD patients underwent DXA for various underlying conditions that could affect the bone quantity and quality leading to osteopenia and osteoporosis, such as rheumatologic or metabolic disorder, although we did not investigate this further.
There were clear differences in the prevalence of sarcopenia among different types of OS when applying different criteria. The highest prevalence of class II sarcopenia based on the height-adjusted definition was seen in patients with FNF and intertrochanteric fracture (ITF). The prevalence was higher in the FNF group than the ITF group. Although the male-to-female ratio and average age were higher in the ITF group, BMI was lower by 0.7 kg/m2 in the FNF group, which resulted in the higher prevalence. The prevalence was the lowest among patients who had TKR, which was even lower than that of the OPD patients. The female predominance in TKR patients might explain such a low sarcopenia prevalence. In contrast, when adjusted for weight, the prevalence of class II sarcopenia was highest in patients who had THR (52.6%), which was slightly higher than patients who had FNF surgery (48.1%) or TKR (44.3%). The OR of gender and BMI in case of weight-adjusted sarcopenia (1.04 and 1.83, respectively) using the multivariate regression models were relatively smaller compared to those using the height-adjusted definition (28.38 and 1.83, respectively). Therefore, it seems logical to assume that there would be another factor for the prediction of sarcopenia when adjusting for weight. Another nationwide study performed in Korea showed that men and women in the lowest skeletal muscle mass index quintile were more likely to have metabolic syndrome by 4.62 times and 3.55 times, respectively, than patients in the highest quintile.26) Thus, sarcopenia based on the weight-adjusted definition may be associated with metabolic syndrome. Sarcopenia based on the residual method (ASM adjusted for height and total fat mass) was reported to be closely related to lower extremity physical function.17) Recent studies on the prevalence of sarcopenia demonstrated that the residual method could be more useful in identifying overweight senior population with sarcopenia than the height-adjusted method.2728) Loss of BMD involving the whole hip, which is one of the well-known risk factors for sarcopenia, was an independent risk factor for sarcopenia only when applying the residual method in the multiple regression analysis and a significant difference in prevalence between the OS and OPD patients in both men and women was also observed only when the residual method was applied. Our findings and abovementioned studies suggest that the residual method should be included when clinicians attempt to evaluate muscle volume before and after OS.
This study has its limitations. First, only elderly Korean patients were included in the study; thus, such a high prevalence of sarcopenia as in our OS patients might not be found in other ethnic groups. However, the risk factors for sarcopenia and the associated OR reported in this study were comparable to those in studies involving different ethnicities.172728) Therefore, our findings might be cautiously considered clinically relevant for clinicians outside Korea. Second, the body composition data from wholebody DXA bears fundamental shortcomings; sarcopenia cannot be diagnosed based on the relative muscle volume alone, as muscle strength and functional capacity also play a role.1) Besides, recent studies have demonstrated that fat degeneration of the thigh muscles is far more important for predicting incident disability and future hip fractures than muscle mass alone.2229) Our study did not address serum markers such as tumor necrosis factor (TNF-α), interleukin (IL-6), IL-1, albumin, or 25-hydroxy vitamin D levels30) because the primary focus of the study was to evaluate the muscle volume and to highlight and raise awareness among clinicians of such high prevalence of sarcopenia. We hope that our study would serve as a foundation or reference for future studies. Third, the timing of DXA scans was not standardized among OS patients: DXA scans were performed prior to surgery in patients with conditions other than hip fracture, whereas patients with hip fracture underwent DXA scans when they were able to ambulate with little pain after surgery. All of these limitations necessitate further prospective studies among OS patients.
In conclusion, we demonstrated that the prevalence of sarcopenia among Korean adults receiving OS on a lower extremity is relatively high. Male gender, older age, and BMI were universally significant risk factors while total hip BMD mattered only for sarcopenia based on the definition of ASM adjusted by height and fat mass. These risk factors should be taken into consideration pre- and postoperatively in light of the clinical significance of sarcopenia for musculoskeletal health among the elderly.
 XML Download