

 PDF
PDF ePub
ePub Citation
 Print
Print


Introduction
Stroke is a major cause of death and disability,1 and carotid atherosclerosis is an important cause of stroke, accounting for 25-50% of ischemic stroke.2-4 Atherosclerosis is a diffuse systemic disease with a long asymptomatic interval before sudden, and often catastrophic, clinical presentation with ischemic symptoms. Some atherosclerotic plaques are prone to rupture, thereby causing sudden thromboembolic vascular occlusion, while others are clinically silent.5-7
Given the high prevalence of silent atheorosclerosis in the general population, there is a pressing need for imaging tools to help identify those patients who will be undergoing plaque rupture, and thus who may benefit from primary or secondary preventive interventions such as carotid endarterectomy or stenting.4 Conventional imaging methods, such as X-ray angiography and duplex ultrasonography (DUS), have limited abilities to detect the 'morphologic' characteristics of plaque vulnerability such as ulceration, a large lipid necrotic core, and a thin fibrous cap.3,4,8,9 Moreover, these anatomy-based imaging modalities cannot define the 'molecular' features of vulnerable plaques, particularly the infiltration of inflammatory cells,10,11 such as macrophages that secrete matrix-disorganizing proteolytic enzyme,5,12,13 into the plaque. 18F-fluorodeoxyglucose (FDG), a radio-labeled glucose analogue, is known to accumulate in macrophage-rich areas of plaques. Many clinical studies have demonstrated that vessels harboring atherosclerotic plaques exhibit a higher FDG positron-emission tomography (PET) signal than unaffected vessels,14-16 suggesting that the molecular imaging tool has strong potential to detect vulnerable plaques in routine clinical practice.5,8,11,13,17
It has been shown that spontaneous changes in plaque FDG uptake are low over a period of a few weeks. However, the pattern of FDG uptake may change more significantly over longer periods of time such as several months.18 There is clinical and histological evidence that atherosclerotic plaques undergo periods of active inflammation and periods of quiescence.6,19 This natural fluctuation of inflammation should be considered when FDG vascular imaging is used as a means of predicting clinical events in high-risk individuals.18,20-22 However, there have been only few carotid FDG-PET studies17 focusing on acute/subacute periods of 'carotid-origin embolic cerebral infarction'. Moreover, the clinical utility of FDG-PET as a stand-alone technique has not been clearly established given that prior studies have shown that 1) not all symptomatic plaques are highlighted,21-23 2) some asymptomatic plaques exhibit marked FDG uptake,14,23 and 3) FDG uptake could be similar between carotid plaques and unaffected contralateral
arteries.22
Together these findings prompted us to investigate the potential clinical roles of carotid FDG-PET computed tomography (CT) in plaque characterization, performed within 4 weeks from the onset of carotid-origin embolic stroke, by analyzing the correspondences and discrepancies between the FDG-PET images and DUS or angiography data. Patients with chronic carotid stenosis were enrolled as controls.
Methods
Written informed consent was obtained from all subjects, and this study was approved by the Institutional Review Boards of the Dongguk University Ilsan Hospital (DUIH), Korea.
Patients
We studied 27 patients (age=70.4±9.1 years, mean±SD; 17 males) who were admitted to the DUIH Stroke Center from July 2006 to July 2009 with either recent (<1 month) carotid embolic stroke or chronic carotid stenosis. All of the patients underwent carotid FDG-PET/CT and systemic investigations, including assessment of ischemic cerebral events, vascular risk factors, and other routine laboratory tests. The recently symptomatic stenosis group comprised 14 patients who had 1) evidence of acute embolic cerebral infarction on diffusion-weighted magnetic resonance (MR) imaging (MRI), 2) ipsilateral extracranial carotid stenosis without intracranial artery stenosis on MR angiography, 3) no evidence of cardioembolic sources on transthoracic electrocardiography, 24-h Holter monitoring, and echocardiography, and 4) undergone carotid FDG-PET/CT within 4 weeks of the stroke onset (median, 9 days; interquartile range, 3-19 days). Contrast-enhanced MR angiography (n=26) or DUS (n=25) was performed in most patients. Conventional angiography data were available for 14 patients, most of whom were treated with carotid stenting (n=12). The chronic stenosis group comprised 10 patients with asymptomatic carotid plaques on angiography or DUS; MRI was performed in these patients to ascertain the silent lesion; in three patients there was a chronic plaque that had been associated with stroke (2, 4, and 72 months prior, respectively).
DUS
Duplex ultrasonography was performed in 25 patients (13 with recently symptomatic stenosis and 12 with chronic stenosis) according to a previously described standardized protocol.27 Patients were examined in the supine position with their head slightly elevated and the neck extended. All images were obtained using a Vivid 7 ultrasound scanner (General Electric, Horten, Norway) with a high-resolution, 7.5-MHz linear-array transducer. Longitudinal and transverse scans of the entire common carotid artery (CCA) were obtained from the clavicle to the carotid bifurcation. Longitudinal and transverse scans of the internal carotid arteries (ICAs) and the external carotid arteries were then also obtained from the carotid bifurcation to their disappearance beyond the angle of the mandible. Ultrasonographic data of representative segments and any suspicious pathology were stored for later inspection and reevaluation.
Ultrasonographic plaque characterization
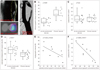
Computer-assisted measurement of the overall (Fig. 1A) plaque echodensity was performed as described previously,24 whereby the median of the frequency distribution of grayscale values of the pixels within the plaque [grayscale median (GSM)] was measured. The histogram facility and 'Curves' option of Adobe Photoshop (San Jose, CA, USA) were used to normalize images, after which two reference points-blood and adventitia-were set to have GSM values of 0-5 and 185-195, respectively.
FDG-PET/CT image acquisition
FDG-PET/CT was performed using a GEMINI 16 power PET/CT scanner (Philips Medical Systems, Cleveland, OH, USA). After overnight fasting, each patient received an intravenous administration of FDG (body weight×0.14 mCi) and then rested for 60 minutes. No patient had a glucose level of 200 mg/dL or higher. The head and neck were placed in a head holder, and noncontrast CT images were taken from the skull base to the clavicle (120 kVp; 250 mAs; pitch, 0.813; tube rotation speed, 0.5 s; slice thickness, 5 mm; field of view, 600 mm; and matrix, 512×512 pixels), and were used for anatomic co-registration with the FDG-PET images. The carotid FDG-PET images were acquired in 2D mode for 10 minutes (field of view, 576 mm). After FDG-PET scanning, contrastenhanced CT and CT angiography were performed (120 kVp; 250 mAs; pitch, 0.938; tube rotation speed, 0.75 s; slice thickness, 1 mm; field of view, 250 mm; and matrix, 512×512 pixels) after the intravenous injection of 80 mL of iomeprol (Bracco, Milan, Italy) at a speed of 5 mL/s.
FDG-PET/CT image analysis
The FDG-PET and CT images (Fig. 1A) were co-registered on a workstation (Sun Microsystems, Santa Clara, CA, USA) equipped with dedicated fusion software (Syntegra, version 2.1 J, Philips, Milpitas, CA, USA). The FDG-PET/CT images were then analyzed by three investigators (one nuclear medicine radiologist and two neurologists); any disagreements were resolved by consensus. First, the transaxial and sagittal FDG-PET/CT images were examined visually for the presence of abnormal metabolism in the carotid system. Carotid sonograms and MR or X-ray contrast angiograms were also examined in order to confirm that the FDG uptake was from plaque areas in the stenotic carotid arteries. On the transaxial co-registered FDG-PET/CT images, FDG uptake was measured by drawing regions of interest (ROIs) in the plaque areas. The FDG uptake was quantified by measuring standardized uptake values (SUVs): the decay-corrected tissue concentration of FDG (kBq/mL) divided by the injected dose per body weight (kBq/kg). Maximum SUVs (maxSUVs) were calculated using maximum pixel activity values within the ROI in the area of the greatest FDG uptake. In the absence of a definite plaque or stenosis, maxSUVs were calculated in the carotid bulb area, which is known to be a predilection site for atheroma formation.25
Statistical analysis
Comparisons of continuous variables between groups were performed using the Mann-Whitney test. Chi-square or Fisher's exact tests were used to compare proportions between groups. When dichotomization was needed, variables were split at the median to form high and low groups. Spearman's correlation was used to determine how two variables were related. All statistical analyses were conducted using a software package (SPSS 18.0, Chicago, IL, USA). The level of statistical significance was set at p<0.05.
Results
Patient characteristics
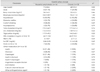
Detailed demographic and clinical characteristics of the 27 patients enrolled in this study are presented in Table 1. The degree of angiographic stenosis, measured by using the North American Carotid Endarterectomy Trial (NASCET) method,26,27 was greater in patients with recently symptomatic carotid plaques (67.5±21.5%) than in patients with chronic carotid stenosis (32.4±26.8%, p=0.002). The level of high-sensitivity C-reactive protein tended to be higher in the recently symptomatic stenosis group (0.84±1.01 mg/dL) than in the chronic stenosis group (0.14±0.08 mg/dL), but the difference did not reach statistical significance (p=0.694). After FDG-PET imaging, ten patients in the recently symptomatic stenosis group and three patients in the chronic stenosis group underwent carotid stenting by experienced neurosurgeons; there was no periprocedural neurological deterioration. The other variables did not differ between the groups. During the follow-up period (median=39 months), no patient experienced stroke recurrence and one patient died of known stomach cancer.
Lower lesional GSMs on DUS in patients with recently symptomatic carotid plaques
Lesional GSMs on the carotid DUS were lower in the recently symptomatic stenosis group (n=9, 28.2±10.0) than in the chronic stenosis group (n=8, 53.9±14.0, p=0.001). Eight patients in the recently symptomatic stenosis group (80%) and one in the chronic stenosis group (12.5%, p=0.015, Fisher's exact test) had GSMs lower than 39, which was the median value of all 17 patients (Fig. 1B).
Higher lesional/contralesional maxSUV ratios in patients with recently symptomatic carotid plaques
As shown in Fig. 1C, lesional maxSUVs on the carotid FDG-PET did not differ between the recently symptomatic stenosis group (n=14, 1.56±0.53) and the chronic stenosis group (n=13, 1.56±0.34, p=0.65).
However, the percentage ratios of the lesional to contralesional maxSUVs (maxSUV ratios) were higher in the recently symptomatic stenosis group (113±17%) than in the chronic stenosis group (98±10%, p=0.017); none of the 13 patients in the chronic stenosis group had a maxSUV ratio higher than 113% (Fig. 1D). The use of target-to-background ratios28,29 to adjust for the SUV in the jugular vein did not change the study results (data not shown).
No overall significant correlations between angiographic stenosis, DUS echodensity, and FDG-PET SUV
NASCET26,27 degrees of angiographic carotid stenosis (Fig. 1A) tended to correlate inversely with lesional GSMs (ρ=-0.462, p=0.062); there was a trend toward a significant negative correlation in the recently symptomatic stenosis group (ρ=-0.617, p=0.077) (Fig. 1E) but not in the chronic stenosis group (ρ=-0.228, p=0.588). There was no correlation between the degree of stenosis and the lesional maxSUV, either overall and within each group (all p>0.05). There were no significant correlations between lesional GSMs and lesional maxSUVs or maxSUV ratios (ρ=-0.191 and p=0.462, and ρ=-0.264 and p=0.307, respectively). However, lesional GSMs were correlated with lesional maxSUVs in the chronic stenosis group (ρ=-0.802, p=0.017) (Fig. 1F) but not in the recently symptomatic stenosis group (ρ=-0.154, p=0.589).
In the recently symptomatic stenosis group, four of the eight patients who were not indicated for carotid endarterectomy according to the NASCET criteria26,27 had high FDG-PET maxSUV ratios (>113%). Three of these four had low GSMs (<39). GSM was also low in three of the four patients who were not indicated for the surgery and had low maxSUV ratios (≤113%).
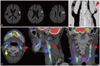
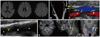
Representative cases illustrating that angiography, DUS, and FDG-PET may complement each other
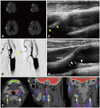
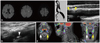
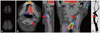
Fig. 2 shows that symptomatic echolucent plaques had strong FDG uptake, which was not the case in the contralateral asymptomatic mixed-echoic plaques. However, as shown in Fig. 3, FDG-PET uptake could be higher in asymptomatic plaques than in the contralateral symptomatic plaques. In some patients, strong FDG uptake was focally restricted to a culprit plaque (Fig. 4); in other patients, FDG uptake was diffusely scattered (Fig. 5) in the CCA as well as in the carotid bulb and ICA. Our qualitative and quantitative data suggest that each imaging modality has something to contribute - in a complementary fashion (Fig. 6) - to the clinical estimation of carotid plaque vulnerability.
Discussion
To the best of our knowledge, this is the first clinical study to comprehensively describe the multimodal imaging characteristics of recently symptomatic carotid plaques within 1 month of embolic infarction, versus matched chronically stenosed controls. All of our ischemic cases were confirmed by diffusion MRI and had strong evidence from angiography to link them to carotid disease as the cause of the infarct. Quantitative analyses demonstrated that there were no overall significant correlations between angiographic stenosis, ultrasonographic echodensity, and FDG-PET uptake, although subgroup analyses revealed some correlations. Qualitative case analyses using the combined imaging datasets showed that the conventional anatomic imaging and FDG-PET molecular imaging could complement each other. These findings suggest that a multimodal approach rather than a single-modality approach should be applied to stroke-risk assessment.
The ultrasonographic echodensity was significantly lower in recently symptomatic carotid plaques than in chronic plaques, a finding that is consistent with the known pathophysiology of plaques with a large lipid necrotic core being more prone to rupture.9,19,30,31 Despite significant intergroup differences with regard to the degree of carotid stenosis, lesional FDG-PET maxSUV values did not differ between the culprit plaques of patients with a recent stroke and the chronic plaques of control subjects. Hypothetically, 'rupture-prone' plaques of chronic asymptomatic patients could have maxSUV values that are as high as 'ruptured' plaques of recently symptomatic patients. Thus, it was necessary to use internal controls and express the data as ratios of the lesional to contralesional maxSUV, in order to separate recently symptomatic from chronic patients. This very likely reflects the reality that atherosclerosis is a diffuse systemic disease with focal manifestations.
The relatively high lesion-to-contralesional maxSUV ratios in the recently symptomatic patients compared with the chronic patients is in line with a recent study32 on a group of 33 patients with stroke, transient ischemic attack, or transient monocular blindness (median=46 days), which showed that FDG SUV differed between asymptomatic and symptomatic plaques, both of which were from the same patient group. A significant negative correlation between GSM values and FDG SUV was also reported, while GSM did not differentiate the asymptomatic from symptomatic plaques. In contrast, the findings of the present study were similar to other previous reports32 of differences in lesional GSMs between recently symptomatic and chronic stenosis patients. In addition, the lesional GSMs were correlated with the corresponding lesional max-SUVs32 only in the chronic stenosis group. Previous studies showed that FDG uptake may not entirely reflect plaque inflammation,21,22,33,34 inflammation may not always cause plaque rupture,19,35 and plaque rupture can heal spontaneously without clinical event.6,7,19,36 Together these divergent findings suggest that comprehensive datasets from DUS and other clinical investigations, as well as FDG-PET complement each other with respect to the stratification of plaque vulnerability.
As reported previously by ourselves2 and illustrated in the representative cases of the present study, there was correspondence but also some informative divergence between anatomic imaging that offers primarily structural information and molecular imaging that provides underlying molecular information on the pathologic processes. Asymptomatic plaques or chronic stenotic arteries could have high FDG uptake, while recently symptomatic plaques had low FDG uptake. Human atherosclerotic lesions have a large content of metabolically inactive components such as collagen, proteoglycans, calcification, lipid, and dead tissues. It is possible that earlier and more cell-dense lesions, including diffuse intimal thickening in the CCA or perhaps even fatty streaks, can be highlighted on FDG-PET images, but these lesions rarely, if ever, cause clinical disease.21,37,38 These again suggest that FDG-PET might not be able to serve as a stand-alone technique for identifying rupture-prone vulnerable plaques.
The absence of a correlation between the angiographic stenosis and FDG-PET uptake supports the notion that inflammatory plaques are not well identified by conventional measures of stenosis.23,39 However, it should be noted that highgrade carotid stenosis, particularly in association with angiographic or ultrasonographic luminal irregularity reflecting ulceration and thrombosis,40-42 has been linked to a relatively aggressive clinical course, suggesting a role for anatomic imaging. We also found that high FDG uptake was often observed not in the whole area but rather only in a localized portion of a plaque (as illustrated in Figs. 4 and 6). In these cases, in addition to acquiring the molecular information, it would be of critical importance to capture location-specific structural information such as thickness of the overlying fibrous cap or the presence of an underlying large necrotic core in and around the area of FDG uptake.
The small sample size and the use of controls not matched for age or sex could potentially have biased the results, which thus need to be interpreted with caution. In order to increase the power of lesional SUVs in discriminating recently symptomatic plaques from chronic plaques, we performed carotid FDG-PET during the early post-stroke period in a relatively homogeneous group of patients with carotid-origin embolic infarction and without other potential causes of stroke, which was carefully assessed by using diffusion MRI, angiography, and other methods of vascular work-up. However, this might have failed to compensate for the natural fluctuation of FDG uptake in chronic atheromata or treatment-related attenuation of inflammation in symptomatic atheromata. In addition, pericarotid inflammation that was not related to atherosclerosis may have affected our results. Nevertheless, by using contralesional ICA or atheroma as an internal control, we found that the maxSUV ratios did differ between the acute/subacute symptomatic stenosis and chronic stenosis groups.
In summary, there were both correspondences and discrepancies between the carotid FDG-PET images and DUS or angiography data, which suggests that molecular imaging and conventional anatomy-based imaging complement each other. Further studies with larger samples are required to determine whether a multimodal carotid imaging technique could improve current therapeutic decision-making processes in atherosclerosis clinic. Prospective studies on the prediction of future stroke risk17 would be particularly informative for estimating the clinical utility of multimodal carotid imaging techniques.
 XML Download