

 PDF
PDF ePub
ePub Citation
 Print
Print


Introduction
Phenylketonuria (PKU) is caused by a deficiency of phenylalanine (Phe) hydroxylase, which utilizes tetrahydrobiopterin (BH4) as a cofactor and converts Phe to tyrosine.1 PKU can cause severe mental retardation; however, implementation of a Phe-restricted diet shortly after birth prevents many of the neurologic manifestations of PKU.1 PKU patients may have difficulties with executive function, attention, emotional lability, and depression2 in spite of diet treatment. Although the causes of brain damage, neurocognitive dysfunction or depression in PKU remain unknown, some data point to impaired protein synthesis, or deficiencies of brain dopamine and serotonin.3-7 Evidence also indicates that there is altered energy metabolism in the brain of the child with PKU.5-7 Phe and its metabolites appear to impair several aspects of brain energetics including: 1) inhibition of glucose uptake; 2) diminished glycosylation of cytoskeletal proteins; 3) inhibition of hexokinase and pyruvate kinase; 4) reduced flux through the glycolysis and 5) inhibition of mitochondrial electron transport chain.
Tetrahydrobiopterin is the first drug (sapropterin dihydrochloride-KUVAN), which acts as a pharmacological chaperone, approved to be used in PKU patients by the Food and Drug Administration in 2007. Since then, numerous studies have confirmed that about 40-50% of PKU patients, especially the ones with some residual enzyme activity, respond to BH4 to the point that it becomes possible to ease dietary restrictions, establish lower and more stable Phe levels or even replace the diet with a near-normal regimen.8-10
The aim of this pilot study is to determine if there are any changes in brain glucose metabolism in patients with PKU before and 4 months after sapropterin therapy. Primary importance will be the generation of pilot data to assess the feasibility of evaluating brain glucose metabolism with Fluorodeoxyglucose Positron Emission Tomography (FDG-PET) imaging and to explore potential trends resulting from the administration of sapropterin therapy.
Methods
Subjects
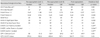
Five adults (3 male and 2 female) with Classical PKU participated in the study. Participants ranged in age from 22 years to 51 years (median: 27.2; IQR: 19.0) (Table 1). All participants were naïve to sapropterin therapy.
The first subject was diagnosed and put on a Phe-restricted diet at 9 months of age. The other four subjects were detected through newborn screening and started on a Phe-restricted diet before 2 weeks of life. At the time of the study, subjects 1 and 3 were on a low protein diet and Phe free formula. Subject 2 was on a low protein diet, and subject 4 and 5 were on a regular diet (Table 1). Their Phe intake was 2522.0 mg/day (3703.0) [median (IQR)].
All patients were examined with FDG-PET brain imaging, physical and neurological exam, blood tests for Phe and tyrosine levels, and neuropsychological tests before and 4 months after sapropterin therapy (mean 122±9 days between studies). All patients' Phe and tyrosine levels were monitored once a week during the study. Subjects kept 3-day diet records that allowed calculation of Phe intake. All subjects received sapropterin at a dose of 20 mg/kg/day for four months. Response to sapropterin is defined as 30% or more decrease in Phe level at 1 month and 4 month-evaluations.
Methods
FDG-PET
Subjects received intravenous administration of 0.14 mCi/kg (+/- 10%) of FDG, with a maximum dose of 10 mCi. PET imaging was initiated approximately 60 minutes after injection. Using a Philips Gemini 16 Power PET/CT scanner (Cleveland, OH, USA), data were acquired in 4 back-to-back time frames for total imaging time of 40 minutes. Following PET emission data acquisition, transmission scans were obtained using the Cs-137 point source for attenuation correction purposes. The emission and transmission data were reconstructed with an iterative reconstruction algorithm, the expectation maximization algorithm with ordered subsets (OSEM). Quantification of regional brain glucose metabolism (RBGM) for each study was determined using Philips NeuroQ 3.0™ [20 iterations, normalizing each of the 47 regions of interest (ROI) to whole brain metabolism].
Neuropsychological battery
The battery was designed to assess verbal memory (Hopkins Verbal Learning Test, HVLT), immediate auditory attention and processing speed (Paced Auditory Serial Addition Task, PASAT), graphomotor speed (Symbol-Digit Modalities Test), verbal and visual working memory [Wechsler Adult Intelligence Scale-Fourth Edition (WAIS-IV) Digit Span subtest and Wechsler Memory Scale-Fourth Edition Symbol Span subtest respectively], sustained attention and impulse control (Conners' Continuous Performance Test-Second Edition, Version 5), and verbal fluency [Delis-Kaplan Executive Function System (D-KEFS) Verbal Fluency subtest].
Test choice and a double-baseline approach were used to minimize and statistically control for potential practice effects. Five participants were tested three times: at an initial baseline before treatment; a second baseline which occurred approximately 7 to 14 days later but before initiation of treatment; and at post-treatment approximately four months after the second baseline. Additionally, alternate test forms were used when applicable (HVLT, PASAT, D-KEFS). All tests were given at all-time points, with the exception of the D-KEFS Verbal Fluency task, which was given only at second baseline and post-treatment as only two alternate forms for this task exist. Two test battery versions were prepared, which counterbalanced test forms across time points to prevent order effects.
Statistical methods
Wilcoxon matched-pairs signed-ranks tests were used to examine differences between pre- and post-measurements of Phe levels, neurocognitive test scores done only at two time points, and FDG-PET values. The Friedman test, a non-parametric alternative to the one-way ANOVA with repeated measures, was used to examine neuropsychological outcomes across the three time-points.
Results
Clinical/biochemical findings
Physical and neurological examinations were normal in all subjects. Concurrent plasma Phe and tyrosine levels were 18.0 (18.95) mg/dL and 0.90 (0.50) mg/dL at pre-sapropterin visit 1, 9.4 (17.90) mg/dL and 1.20 (0.75) mg/dL at pre-sapropterin visit 2, and 17.2 (16.35) mg/dL and 0.95 (0.70) mg/dL at post-sapropterin visit. Liver function tests including prothrombin time and partial thromboplastin time were normal. No patient experienced any side effects related to sapropterin. Phe intake in diet was 2522.0 (3703.0) mg/day and 2670.0 (3519.5) mg/day at pre-sapropterin visit 2 and post-sapropterin visit, respectively, and there was no statistically significant difference. None of the subjects responded to sapropterin therapy based on at least a 30% decrease in blood Phe level, nor did subjects have increased Phe tolerance in diet.
Neuropsychological findings
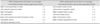
There was no statistically significant difference between performance of tasks at baseline 1 relative to baseline 2, with the exception of auditory working memory (WAIS-IV Digit Span, p≤0.043). When comparing pre-sapropterin visit 2 (baseline 2) to post-sapropterin, only one potential significant result was noted, in that semantic verbal fluency (D-KEFS Verbal Fluency Total Letter Fluency) increased an average of half a standard deviation across subjects (Wilcoxon p≤0.066) (Table 2).
FDG-PET findings
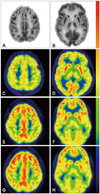
On the initial FDG-PET brain scan, seven ROI's were measured to be at least, on average, 1 standard deviation below expected activity: right visual association cortex (-1.7), left parietal-temporal cortex (-1.4), right cerebellum (-1.3), left cerebellum (-1.3) right infero-lateral posterior temporal cortex (-1.2), cerebellar vermis (-1.2) and left inferior parietal cortex (-1.1). Six regions were measured to be at least, on average, 1 standard deviation above the mean: left medial frontal cortex (+2.0), left anterior cingulate cortex (+1.5), right medial frontal cortex (+1.5), left mid-frontal cortex (+1.3), right midfrontal cortex (+1.3), and right anterior cingulated cortex (+1.1) (Table 3). In response to the sapropterin therapy, two ROI's showed significant (p<0.05) change in RBGM: left Broca's area (p=0.043, pre and post median levels of 0.74 and 1.30, respectively) and right superior lateral temporal cortex (p=0.043, pre and post median levels of -0.784 and 0.035, respectively) (Table 4). FDG-PET transaxial images shown in Fig. 1 represent the differences between normal brain, and one of the study subjects' brain before and after Sapropterin supplementation.
Discussion
In brain, FDG-PET imaging measures regional glucose metabolic rate and reflects a complex scenario that involves activity of the entire neurovascular unit and the multifunctional role of astrocytes.11,12 Our data show that PKU patients have reproducible patterns of RBGM, which differ from those of a normal data set. Generally, glucose metabolism appeared depressed in the cerebellum and left parietal cortex while it increased in the frontal and anterior cingulate cortices. We speculate that increased brain glucose metabolism in the frontal cortex may have resulted from increased energy demand in brain cells caused by elevated Phe levels. Pietz et al.6 evaluated cerebral energy metabolism using 31P-MRS in adult PKU patients whose phe levels ranged from 831 to 1784 umol. They demonstrated that adenosine triphosphate (ATP) and phosphocreatine (PR) levels and phe concentrations were inversely related: increasing Phe concentrations after Phe loading resulted in decreasing ATP and PR levels. They pointed to a link between Phe neurotoxicity and imbalances of cerebral energy metabolism. Neurons require energy in the form of ATP to maintain their membrane potential. Increased demand for ATP will increase cerebral metabolic rate for glucose, which is used to replenish the ATP. Interestingly, the presence of increased glucose uptake in the frontal cortex, largely responsible for executive function is unexpected as patients with PKU can have impaired executive function.2 Increased glucose metabolic rate may reflect compensation efforts of this region as all early treated subjects showed relatively normal executive functioning in neurocognitive evaluation.
It is more difficult to explain the diminished uptake in cerebellum and left parietal cortex. The differences of glucose uptake in different regions of brain may be a consequence of a domino-like effect of elevated Phe, which can help to better understand and define circuits and networks involved in the pathogenesis of neurocognitive symptoms of PKU.
After sapropterin therapy, relative glucose metabolism showed significant increases in left Broca's and right superior lateral temporal cortices. There were no significant changes in other regions. There was corresponding enhanced performance in a standardized verbal fluency test performed during pre and post-sapropterin neuropsychological evaluation. Published data point to other biological roles of BH4 in human beings besides being a cofactor for aromatic amino acid hydroxylases.13-16 These other roles include BH4 1) as a cofactor of nitric oxide (NO) syntheses to produce NO 2) as an intracellular antioxidant to scavenge reactive oxygen species (ROS) 3) as a way to stimulate the increased release of dopamine and serotonin. These roles may be important in preventing neurotoxic effects of elevated Phe in PKU. It is unknown if intracellular biochemical events and increased oxidative stress can lead to disruption of BH4 homeostasis in PKU. Sanayama et al.17 reported increased oxidative stress status in PKU patients and found significant correlation with plasma Phe levels and the magnitude of oxidative stress. Intracellular ROS can diminish BH4/BH2 ratio through accelerated oxidation of BH4 to BH2, and insufficient availability of BH4 to nitric oxide synthase (NOS) results in the formation of superoxide rather than NO (NOS uncoupling). Dihydrofolate reductase (DHPR) enzyme, which recycles BH4, may play a key factor in the pathophysiology of PKU and its management with sapropterin. If DHPR is up-regulated in PKU, it can override the rate of BH4 oxidation, and BH4/BH2 ratio recovers to a high level and NOS remains in a coupled state. If DHPR activity is down-regulated under oxidative stress in PKU, it can result in further deterioration of uncoupling of NOS.
While it is not well-known if oral supplementation of BH4 can be transported into the brain, one may speculate that increased glucose uptake in left Broca's and right superior lateral temporal cortices may be the effect of increased blood flow caused by NO production in the presence of BH4 or increased release of neurotransmitters by BH4.
The small sample size constrains the statistical significance of this study. While useful in indicating potential trends worthy of fuller exploration, the results of this pilot study should be cautiously interpreted.
Further studies are needed with larger samples of patients 1) to assess brain energy metabolism using a combination of imaging tools including PET scan, MRI, functional MRI and magnetic resonance spectroscopy; 2) to reach more definitive conclusions regarding the effect of sapropterin supplementation in PKU patients who do not respond to the therapy with decreased Phe levels or increased Phe tolerance. Further research is also needed to understand if PKU disturbs BH4 cellular homeostasis. If it does, PKU patients may benefit from BH4 supplementation to keep their BH4/BH2 ratio at a high level, and prevent further increase in oxidative stress. The numerous remaining questions guarantee that additional research will offer us valuable new insights in the near future.


 XML Download