

 PDF
PDF ePub
ePub Citation
 Print
Print


Introduction
Mismatch negativity (MMN) is an early auditory event-related potential (ERP) that is elicited when infrequent ("deviant") sounds occur in a sequence of repetitive ("standard") sounds even in the absence of attention to these sounds.1 MMN is defined as the difference between the response to a stimulus presented as a deviant under one condition, and the response to the same stimulus presented as a standard in a separate measurement. This negative component of the auditory ERP, which usually peaks at 150-250 ms from the change onset, is known to be a component of primitive intelligence originating from the auditory cortex.2 MMN is thought to be generated by an automatic cortical change-detection process, during which a difference is found between current input and the representation of regular aspects of the preceding auditory input.3
ERP analyses conventionally focus on mean amplitude differences under the implicit assumption that from trial to trial, all neuronal activity of interest is evoked by the stimulus in a time-locked manner. However, focusing on evoked activity might result in useful information available from single EEG trials being overlooked.4 Recent studies using single-trial analyses have suggested that ERP components can largely be explained by the partial phase resetting of ongoing activity in restricted frequency bands5-8 in addition to the modulation of amplitude. Thus, investigating certain oscillatory characteristics of ERP components may provide additional information compared with that obtained in averaged ERP analysis.
Fuentemilla et al.9 recently used time-frequency analysis of single-trial ERPs to demonstrate that MMN is due to a combination of increased theta power and phase resetting for deviant trials. They also found that amplitude modulation and phase-resetting mechanisms depend upon the source location of the MMN. Hsiao et al.10 revealed in a magnetoencephalography (MEG) study that phase-locked theta oscillation during a passive oddball paradigm is associated with auditory change detection. Thus, these two studies clearly demonstrated that theta oscillation at around 100-250 ms after stimulation might be associated with the auditory discrimination process reflecting MMN.
However, since both previous studies used the oddball paradigm, where stimuli with different physical properties are presented with different probabilities, it is not clear which factor is related to the elicited theta oscillation. To address this issue, we compared power and phase resetting of theta oscillation between an oddball paradigm and a control condition.11,12 Under the latter condition (henceforth referred to as the control paradigm), the two tones used in the oddball paradigm were presented with the same probability.
The aims of the present study were to identify theta oscillations in response to deviant auditory stimuli reflecting MMN in a passive oddball paradigm and, using a control paradigm, to verify that theta oscillations elicited by the oddball paradigm are not due to physical differences between the stimuli.
Methods
Participants
Thirteen healthy, right-handed university students (six males, aged 23.31±1.60 years, mean±SD) participated in this study. Each subject gave written informed consent to participate. The experimental protocol was approved by the Institutional Review Board of Korea University Medical Center.
EEG recording
EEGs were recorded using a 32-channel digital EEG device (Grass Neurodata Acquisition System Model 12, Grass Technologies, Quincy, MA, USA) with 27 electrodes that were placed on the scalp according to the international 10-20 system, with extended coverage of the lower temporal region (F9/10, T9/10, and P9/10). The reference electrode was set to Pz. Electrode impedance was kept below 5 kΩ. The band-pass filter setting was 0.1 to-100 Hz, with a sampling rate of 400 Hz. Two electrooculography channels (placed on the left and right outer canthi) were added to confirm eyeball movements and to allow electrooculography artifacts to be removed. The participant sat in a comfortable chair and listened to the presented sounds through earphones.
Stimuli and procedure
Pure tones (90 dB spatial pulse length) were generated using a commercial program (Cool Edit Pro V.2.1, Adobe Systems, San Jose, CA, USA), and the oddball paradigm was designed using Presentation (V.11.0, Neurobehavioral Systems, Albany, NY, USA). Subjects were instructed to read a book and to ignore the auditory stimuli during the task. The oddball paradigm was based on sequences of two tones, each starting on a random basis, either with a 1000-Hz standard (p=0.8; n=960) tone followed by a 1030-Hz deviant (p=0.2; n=240) tone, or vice versa. The tone duration was 100 ms, with rise and fall times of 10 ms, and the inter-stimulus interval was 1000 ms. Each subject received three blocks of an auditory oddball task, containing a mix of 400 tones.
The control paradigm was performed in seven of the subjects (aged 23.43±0.79 years, mean±SD) who had completed the oddball paradigms. This experiment was designed to establish that auditory discrimination is not merely generated by physical differences between sounds. The same tones used in the oddball paradigm (1000 and 1030 Hz) were presented randomly, each with a probability of 0.5. In the control paradigm, we assigned the 1000-Hz tone as the standard stimulus and the 1030-Hz tone as the deviant stimulus.
Average ERP analysis
EEG data were analyzed using EEGLAB version 6.01b,13 which is an open source toolbox operated in the MATLAB environment (version 7.01, MathWorks, Natick, MA, USA). EEG data were referenced to average references. The band-pass filter was set to 0.5-50 Hz. Epochs were then extracted, with a time window of -200 to +800 ms from stimulus onset. Baselines were corrected by subtracting the root mean square of the prestimulus interval from the whole length of the epoch. All data epochs from each subject were assembled and subjected to Infomax independent component analysis, with a blind source separation. A 27×27 unmixing square matrix was identified by independent component analysis, with the removal of 1 to 3 independent components that were responsible for eye-blinking.14 Other components were not removed from the original EEG data sets because of the possibility of unintentionally erasing significant signals. After removing blinking components, the remaining independent components were back-projected to construct a new EEG data set, which was then used for further analysis. Epochs containing any artifacts caused by muscle contraction and movement were then deleted.
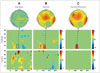
The ERP data were averaged with the sweep from 200 ms before to 800 ms after stimulus onset. N1 and N2 components were identified as the largest negative deflections in the time windows 70-140 ms and 170-270 ms following the auditory stimuli, respectively. The MMN component was obtained by subtracting the ERP response to standard tones from that to deviant tones. The MMN component was thus identified as the most negative peak between 150 and 250 ms following auditory stimuli. The latencies and amplitudes of each ERP component were measured relative to the prestimulus baseline period. A scalp mapping of voltage topography was obtained from -25 to +25 ms at the peak of each ERP component.
Event-related spectral perturbation and inter-trial phase coherence
To evaluate average dynamic changes in in-phase consistency and in the amplitude of EEG spectra at each frequency and time window across trials, we calculated event-related spectral perturbations (ERSPs) and inter-trial phase coherences (ITCs) using the EEGLAB package.15,16 ERSPs measure average dynamic changes in the amplitude of a broadband EEG frequency spectrum as a function of time relative to an experimental event:13
where, for n trials, Fk(f, t) is the spectral estimate of trial k at frequency f and time t. The ITC is a measure of the consistency of the EEG spectral phase at each frequency and latency window across trials:
To compute these measures, each single-trial ERP time series was transformed to a baseline-normalized spectrographic image using a moving-window average of FFT spectra. The output comprised 32 amplitude estimates, with a frequency bin width of 1.56 Hz (from 1.56 to 50.00 Hz).
Statistical analysis
As the topographic distribution of ERP, ERSP, and ITC values was maximal at both frontocentral regions, averaged values from the frontocentral electrodes (F3, Fz, F4, C3, Cz, and C4) for each subject were used in the statistical analysis. The amplitude and latency differences of each ERP component between standard- and deviant-elicited responses were estimated with a nonparametric Wilcoxon signed-rank test.
Results
Average ERP
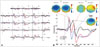
Originally 20 subjects were recruited for the study, but 7 of them were excluded because they did not show a clear MMN component at the frontal electrodes. Thus, data from 13 subjects were analyzed further in the present study. Grand average waveforms and spatial distributions of ERPs in the oddball paradigm in response to auditory stimuli are shown in Fig. 1. In the oddball paradigm the MMN was clearly identified, and it had a peak latency of 190 ms. The Wilcoxon signed-rank test showed that the latencies of the N1 and N2 components did not differ significantly between the stimuli. However, the amplitudes of deviant N1 and N2 components were significantly larger than those of the standard ones (Table 1).
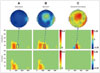
In the control paradigm, N1 amplitudes and latencies did not differ between the two stimuli (Table 2). In addition, no significant difference was observed for different types of auditory stimuli in terms of the amplitude and latency of N2 components. No discernible MMN component was observed with the control paradigm (Fig. 2).
Time-frequency analysis of single-trial ERPs
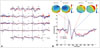
Since ERSPs and ITCs may depend strongly on the number of trials, the trial number of both conditions was matched between paradigms. The spatial distribution of ERSPs and ITCs exhibited frontocentral predominance (Figs. 3 and 4, respectively), and so only data from the Fz electrodes are presented at the individual level. Figs. 3 and 4 show ERSPs and ITCs at the Fz electrode for each auditory stimulus of the oddball and control paradigms.
Comparison of ERSPs and ITCs during the pre- and poststimulus periods
To determine whether ERSPs and ITCs increase significantly during task execution as compared with the prestimulus baseline at individual electrode locations for each subject, a bootstrap method with 200 repetitions was used to compute significant changes (p<0.001) from the distributions of ERSP and ITC values from surrogate data windows drawn at random from the same data epochs.17
For ERSPs in the oddball paradigm, time-frequency analysis of single-trial ERPs revealed that ERSPs increased significantly from 3 to 12 Hz following standard sound stimuli at around 120 ms (Fig. 3A). The ERP response to deviant tones exhibited an elevated ERSP from 3 to 12 Hz at around 250 ms in addition to an early response at 120 ms after auditory stimulation (Fig. 3B). In contrast to the oddball paradigm, no significant ERSP changes to either standard (1000 Hz) or deviant (1030 Hz) sound stimuli were noted for the control paradigm.
For ITCs in the oddball paradigm, the standard response exhibited a significant ITC increase from 3 to 12 Hz at 120 ms following auditory stimulation (Fig. 4A). The deviant response gave rise to a significant ITC increase from 3 to 12 Hz at 250 ms in addition to a significant increase at 120 ms (Fig. 4B). For the control paradigm, both standard (1000 Hz) and deviant (1030 Hz) tones gave rise to a significant ITC increase of 2-12 Hz at around 120 ms. However, deviant tones did not induce any change in ITC at around 250 ms, as in the control paradigm.
Comparison between the ERSPs/ITCs of standard and deviant stimuli
The ERP responses to standard and deviant sounds were compared across subjects by subtracting ERSPs and ITCs of standard responses from those of deviant responses. The results of the topographic mapping of these differences are depicted in Figs. 3 and 4. For the oddball paradigm, ERSP differences between deviant and standard single-trial ERPs showed that deviant tones produced an ERSP that was 4-10 Hz higher at around 250 ms than the standard tones (Fig. 3C). Differences between the ITCs of deviant and standard single-trial ERPs in the oddball paradigm demonstrated that deviant sound produced an ITC that was increased by 4-10 Hz at 250 ms (Fig. 4C). Neither the ERSPs nor ITCs differed significantly in the control paradigm.
ERSP and ITC values of the time-frequency of interest (TFOI) identified during the analysis described above (the box in Figs. 3C and 4C) were subjected to statistical analysis using the Wilcoxon signed-rank test. The TFOI was 4.69-10.94 Hz at 223.6-295.4 ms for ERSPs and 4.69-10.94 Hz at 236.3-295.4 ms for ITCs. An averaged value from six frontocentral leads was calculated for each subject. The Wilcoxon singed-rank test showed that ERSP (p=0.028) and ITC (p=0.003) were significantly larger for deviant tones than for the standard tone (Table 3). As found for the control paradigm, no significant TFOI was identified, and thus, no further statistical analysis was performed.
Discussion
We investigated the oscillatory characteristics of auditory discrimination by applying time-frequency analysis to single-trial ERPs. In the present study, average ERP analysis demonstrated that while deviant stimuli in the oddball paradigm clearly elicited MMN components, the standard tone did not. Time-frequency analysis of single-trial ERPs revealed that both power and phase modulations in the theta frequency band were significantly increased at around 120 ms for both standard and deviant stimuli. Additional theta power (ERSP) and phase modulation (ITC) were observed at around 250 ms only in response to the deviant stimulus. ERSP is a plot of the baseline-normalized spectrogram that enables visualization of mean event-related changes in spectral power over time over a broad frequency range. ITC is a frequency-domain measure of the partial or exact synchronization of activity at a particular latency and frequency in response to a set of experimental events to which EEG data trials are time locked. This additional theta oscillation was present only in ERPs elicited by deviant tones, which could be related to the auditory discrimination process reflected in MMN. It has been reported that theta oscillation is involved in various cognitive functions, including working memory.18 Thus, our findings may support the memory-dependence of auditory discrimination in the generation of MMN.3,19
Our results are in agreement with those of previous studies that used either EEG9 or MEG.10 Fuentemilla et al.9 analyzed auditory change detection using event-related brain potentials, and reported that MMN in the frontal region was accompanied by an increase in theta power and phase alignment for deviant trials. Hsiao et al.10 compared the MEG responses from ten healthy subjects using an auditory oddball paradigm that compared deviant and standard stimuli, and found that deviant stimuli elicited responses with a larger theta phase-locking value and a larger theta power change.
It is likely that EEG oscillation is elicited by physical differences and/or probability differences in the stimuli. To eliminate the effect of probability differences, we used a control paradigm in which auditory tones with the same physical properties as in the oddball paradigm were presented with equal probability. No significant ERSP change was detected in the control paradigm. Furthermore, no discernible phase modulation was observed at around 250 ms; only phase modulation of the theta frequency band at around 120 ms was observed. This finding indicates that when stimuli are presented with equal probability, subjects show only a weak early theta oscillation response, which should correspond to a primary sensory process, and subjects do not detect an auditory change, as reflected by the absence of the second theta oscillation. Interestingly, a single-trial analysis of the ERPs of seven subjects in the present study who did not show an MMN response revealed that they exhibited neither ERSPs nor ITC (Supplemental Fig. 1). Thus, our results strongly support that the MMN response in the oddball paradigm is related to theta power and phase modulation at around 250 ms.
In the present study, the spatial distributions of theta ERSPs and ITC were strongest on the frontocentral region, followed by the temporal area, and particularly the right side. Right hemispheric dominance of theta oscillation in relation to auditory discrimination is in line with the findings of other studies.10,20,21 It has been reported that both frontal and temporal sources are important for detecting auditory changes in MMN.21,22 Temporal sources are associated with auditory change detection, whereas frontal sources are associated with involuntary switching of attention to sound change. This finding suggests the presence of a functional relationship between the frontal and temporal regions. An analysis of functional connectivity, such as phase synchrony between brain regions, should be conducted to clarify this relationship.
This study was subject to one main limitation. For technical reasons, we were only able to obtain control-paradigm data from seven subjects, and this may have introduced statistical bias when comparing the two paradigms.
In conclusion, the presented results confirm that the auditory discriminatory process reflected in MMN is accompanied by phase resetting and power modulation at the theta frequency.

 XML Download