

 PDF
PDF ePub
ePub Citation
 Print
Print


Introduction
The presurgical evaluation of patients with refractory epilepsy often requires the implantation of subdural and/or depth electrodes when non-invasive diagnostic tools do not indicate a single epileptic focus or when it is not possible to accurately localize one.1,2 Long-term monitoring with intracranial electroencephalogram (iEEG) is necessary for the precise localization of the seizure onset zone (SOZ) in these patients. During the procedure, several stereotyped seizures are recorded to allow the clinicans to determine the location of the epileptic brain regions, which should be subsequently removed to yield seizure freedom.2 However, this process can be time-consuming, lasting up to several weeks and carries significant risks of infection, epidural hematoma, and increased intracranial pressure.3 Furthermore, ictal discharges are often not well localized, especially in neocortical epilepsy cases. The application of a reliable electrophysiological biomarker that can provide useful information about SOZ during interictal period may reduce the duration of electrode implantation and the probability of complications, enable a more precise determination of the resection margin, and ultimately enhance the efficacy of epilepsy surgery.
Interictal spikes are well-characterized electrophysiological signals in the epileptic brain, but their sensitivity and specificity in predicting the position of SOZ remain elusive.4 It is unclear how this irritative zone (IZ) is related to epileptogenicity. Spikes can sometimes be localized to the SOZ, but they can often occur independently where no seizures are initiated: this has led to the hypothesis of "red" and "green" spikes.5 However, there is no clear explanation of how the two can be differentiated. Another interictal marker of the epileptic brain, interictal high-frequency oscillations (HFO) was first reported in the epileptic hippocampus in rodent models and later in human patients, recorded from microwires and depth macroelectrodes.6-14 These studies focused largely on the use of depth electrodes to record interictal HFOs mainly in the medial temporal structures or neocortical lesions. Although subdural ma-croelectrodes are useful for determining the spatial extent of the epileptogenic region, since they can cover larger areas than depth electrodes,15 their efficacy in recording HFOs has been explored in less detail.
Interictal HFOs can be divided into two categories according to their spectral content: ripple (R) events, ranging from 80 to 200 Hz, and fast ripple (FR) events, ranging from 200 to 500 Hz.6 Many previous studies have consistently shown that FR events, which reflect the neuronal substrates of the epileptogenic region, are concentrated mostly in the epileptic hippocampus in both human patients and animals.7,9 FR events have also been recorded in epileptogenic neocortical lesions using depth electrodes.13 The relationship of R events with epileptogenicity is less clear than for FR events, since they represent both normal and pathologic brain activity.11,16,17
The objectives of this study are to use a semi-automated approach to detect transient high-frequency signals during the interictal period and to determine the clinical utility of these signals in predicting the location of the epileptogenic brain region. We categorized detected HFO events according to their spectral characteristics (R and FR) and then constructed for each patient an HFO event distribution map (EDM), which illustrates the occurrence rate of detected HFOs relative to the electrode location. The spatial extent of the epileptogenic zone determined in this way was then compared with that determined clinically. We hypothesized that the occurrence rate of HFOs recorded by subdural electrodes can help to localize the SOZ, and that these HFOs thus hold promise as an interictal electrophysiological biomarker of the epileptic brain. We present the results from seven patients, focusing specifically on how useful information regarding the epileptogenic zone can be extracted by detecting HFO events.
Methods
Patients
We enrolled seven consecutive patients [four males; age at the time of surgery, 33.5±7.7 years, mean±standard deviation (SD)] with intractable partial epilepsy who underwent long-term video-EEG monitoring with intracranial electrodes between February and November 2010 at the epilepsy center of a university hospital. All patients submitted to a comprehensive evaluation with non-invasive diagnostic tools, including a detailed history, neurological examination, video-EEG monitoring with scalp electrodes, neuropsychological testing, Wada test, brain MRI, positron emission tomography, single photon emission computed tomography and functional brain MRI if necessary. The decision to perform an invasive EEG study was made when suspected SOZs determined by non-invasive examinations were incongruent or less clearly localized. Informed consent to participate was obtained from all patients involved in this study. All procedures were approved by the local institutional review board.
iEEG recording
Intracranial recordings were performed continuously in the epilepsy monitoring unit using commercially available subdural electrodes (AdTech Medical Instruments, Racine, WI, USA). Subdural electrodes were composed of strips [1×(6, 8)] and/or grids [4×(5, 8)] with one-sided circular contacts (4 mm in diameter, 2.3 mm exposed, and 10 mm inter-electrode spacing; impedance <100 Ω). The effective recording area of each electrode was 4.15 mm2. Electrode placements were individually tailored by a clinical team, based on the clinical history, seizure semiology, interictal and ictal scalp EEG recording, neuroimaging, neuropsychological testing, and intraoperative electrocorticography findings. Subdural grids and strips were inserted via a craniotomy. All patients underwent high-resolution 1.5- or 3-tesla volumetric brain MRI prior to electrode implantation, and CT head scans immediately after implantation surgery. The MRI and CT images were fused to identify electrode locations using Analyze software (Version 7.0, AnalyzeDirect, Overland Park, KS, USA).
The antiepileptic medication taken by each patient was reduced during video-iEEG monitoring to enable the recording of multiple habitual seizures. Clinical data were recorded using a conventional digital EEG device (Vanguard EEG system, Cleveland, OH, USA) at a sampling rate of 400 Hz. All clinical decisions were based on recordings from that system.
High-frequency EEG recording
In addition to conventional clinical EEG, iEEG data were recorded with high temporal resolution using a research data acquisition system (Neuroscan SynAmps2, Compumedics, El Paso, TX, USA). A 2000-Hz sampling rate was used with software-imposed band-pass filter from 0.05 to 500 Hz (12 dB/octave) to record an EEG over a wide frequency bandwidth. EEG signals were recorded against a scalp reference electrode placed in the parietal lobe (Pz), which is the least likely brain region to be an epileptic focus. Since our research data acquisition system can record from only up to 64 electrodes, and all of our patients were implanted with more than that, our clinical team selected a subset of contacts to be recorded with a high sampling rate. The channels selected for high-frequency recording were identified based on interictal-ictal EEG findings during the first few days of iEEG monitoring, the presence of an MRI lesion, positron emission tomography hypometabolism, and/or perfusion abnormalities in single photon emission computed tomography.
High-frequency EEG recording took place at the bedside during the night (>6 p.m.) and lasted for more than 6 hours per patient. The analysis of interictal HFOs was performed on three randomly selected 5-minute segments of wakeful-state EEG recording. Previous studies on HFOs have frequently found that HFOs occur more often in non-REM sleep, and especially in slow-wave sleep.17,18 However, epochs from traces recorded during quiet wakefulness can provide clinically useful information.14,17 The authors reviewed these randomly selected segments, and included only artifact-free data for further analysis.
Semiautomatic detection of HFO events
HFO events are by definition transient, fast, small-amplitude oscillations, and so manually reviewing EEG data and visual detection of these signals can be a painstakingly long process, especially when numerous multiple channels (e.g., >60) are involved. Furthermore, visual marking of HFOs can be unreliable and subjective, as indicated by the reportedly high inter-rater variability.19 It is much more reliable and convenient to use an automated detector to screen candidate HFO events, as this process can substantially lower the time cost of human labor. However, it should be noted that no automated detection algorithms are perfect. While we deliberately selected interictal epochs with no visually identifiable artifacts (e.g., line disconnection, large-amplitude movement artifacts, and chewing artifact), it is still possible for automated algorithms to detect false-positive events. To resolve this issue, we manually reviewed candidate HFO events (detected by an automated algorithm) by the naked eye and with the assistance of additional analysis tools. This approach, the so-called semiautomatic detection method, can substantially reduce the human labor requirement compared to fully manual detection, and has been utilized successfully in previous studies.9,11,14
We implemented an automated algorithm into a custom script in MATLAB (Version 7.6.0, MathWorks, Natick, MA, USA) by combining the advantageous features of previously published methods.9,14 An EEG recording with a high sampling rate was first presented using a bipolar montage (voltage difference between pairs of adjacent channels), since it reflects the neuronal activity of a local population and eliminates common noise picked up by a reference electrode. The raw EEG signal was band-pass filtered (using 90th-order finite impulse response) into two discrete frequency bands: one within the R frequency range (80-200 Hz) and the other within the FR range (200-500 Hz). The instantaneous amplitudes of these signals were then calculated using the Hilbert transform. Local maxima in the signal envelope were considered to be putative HFO events and automatically detected using an epoch-dependent threshold. We set the adaptive threshold as 5 SDs above the mean of the amplitude calculated over each 5-minute data epoch. A Z-score of 5 was used as a threshold value in previous literature,9,14 and our qualitative observation was that this represents a good balance between false-positive and false-negative errors. Additional restrictions were added to further reduce the inclusion of false-positive detections: putative events had to be at least 6 ms in duration, and band-passed versions of candidate events need to comprise a minimum of six peaks that were greater than 3 SDs above the mean value of the rectified band-pass signal.9 Any consecutive events separated by less than 10 ms were merged into a single event.
Since, as mentioned above, detection by an automated algorithm frequently results in false-positive detections, it was necessary to screen putative events and discard any false detections. Putative HFO events were shown by a custom-developed graphical user interface along with band-passed signals (one within the R range and another within the FR range) and time-frequency plots using the Morlet wavelet.14,20 Time-frequency maps were constructed by extracting 340 ms of data around the putative events and convolving it with a complex Morlet wavelet, w(t, ƒ0), having a Gaussian shape both in the time (SD σt) and frequency (SD σƒ) domain around its central frequency, ƒ0:

A wavelet family was characterized by a constant  ratio of 6 from 60 to 500 Hz in 1-Hz steps. Then, 20-ms portions at the beginning and end of convoluted signals were discarded, since they contained edge artifacts. The time-varying energy of the signal, E(t, ƒ0), is defined as the squared norm of the convolution product of a complex wavelet w(t, ƒ0), with the signal s(t):
ratio of 6 from 60 to 500 Hz in 1-Hz steps. Then, 20-ms portions at the beginning and end of convoluted signals were discarded, since they contained edge artifacts. The time-varying energy of the signal, E(t, ƒ0), is defined as the squared norm of the convolution product of a complex wavelet w(t, ƒ0), with the signal s(t):
Time-varying energy is shown on a logarithmic scale, ln[E (t, ƒ0)], to enhance visualization. During the visual validation step, the order of presented HFO events was randomized so that authors were blind to any kind of clinical information (e.g., time or electrode number). Since a bipolar montage was used for analysis, we also displayed two relevant channels with reference to the Pz electrode in order to identify which one of two channels actually contained the HFO events.
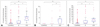
During the visual validation process, we followed our own definition of HFO events and any detection that did not qualify was rejected as an artifact. The HFO events are categorized into the R and FR types according to their spectral characteristics; R and FR events were declared if a putative HFO event exhibited clear high-amplitude activity in the 80-200-Hz and 200-500-Hz bands, respectively. Furthermore, clear oscillations had to be visible in the unfiltered signal. For FR events, the amplitudes of which are usually very small, it was necessary to magnify (i.e., display over a short time duration) events to identify oscillations. In a time-frequency decomposition plot with the Morlet wavelet, these oscillations can be visualized as "blobs" that represented activation over a restricted frequency range and time duration (Fig. 1).
Quantification of HFO events
We quantified three parameters for visually validated HFO events: peak frequency, peak amplitude, and duration. Peak frequency was calculated by first determining the power spectral density on R- or FR-bandpassed filtered versions of the detected signal (1024 points with zero padding) using Welch's method (MATLAB signal processing toolbox: pwelch). The frequency value at maximum power was declared to be the peak frequency. Peak amplitude was determined from the maximum value of the signal envelope (i.e., the absolute value of the Hilbert transform) from the detected signal. Duration was calculated automatically as the duration of the detected segment. An example of the quantification of detected HFO events is presented in Supplementary Fig. 1.
Construction of HFO EDMs
We constructed an HFO EDM for each patient to illustrate which electrodes were associated with a high occurrence rate of HFO events, and compared it with the clinically determined epileptogenic zone for the corresponding patient. We first identified the location of the electrodes sampled by the Neuroscan system using a fused image of the postimplant CT and the presurgical MRI, overlaid on a three-dimensional brain image of each patient. For each electrode, we color-coded the average rate of HFO events from black to red to white, in the order reflecting how many HFO events the electrode had recorded. The clinical utility of interictal HFO event distributions for identifying the epileptogenic brain area was evaluated by comparing this map to the epileptogenic zone determined clinically by clinicians after recording multiple seizures and interictal spikes (please see the next sections for further details).
Categorization within the epileptic focus
The clinical utility of interictal HFO events for identifying the epileptogenic brain region was determined by evaluating the degree of spatial overlap between the EDM and the clinically determined epileptogenic zone in the same patient. The clinical epileptogenic zone, which was determined after recording multiple seizures and interictal spikes, was further characterized into three categories based on its electrophysiological characteristics. First, electrodes with the earliest EEG changes during seizures were defined as the SOZ. It is possible that one of our patients had multifocal ictal origins (i.e., patient 4). Second, electrodes with frequent interictal spikes but which did not participate in seizure initiation were defined as the IZ. Finally, any other electrodes that exhibited no epileptiform discharges were regarded as the control (CONTROL) brain region. The HFO event distribution was calculated for each category and subjected to statistical analysis.
Statistical analysis
We used Kruskal-Wallis (KW) analysis of variance (ANOVA) to test for the presence of statistical significance in the number of HFO events in different brain regions (SOZ, IZ, and CONTROL region) for HFO events (total HFO, FR, and R events). Post-hoc analysis between groups was performed using the Wilcoxon rank-sum test with Bonferroni correction for multiple comparisons. Please note that only nonparametric statistical tests were used since the null hypothesis that the distributions of HFO events and quantified parameters follow standard normal distribution was rejected by a Kolmogorov-Smirnov test at the 5% significance level.
Results
Localization of the SOZ and IZ
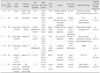
From conventional clinical recordings, seizures were first reviewed visually and the channels with earliest ictal EEG change were determined to be the SOZ. The locations of seizure onset determined by iEEG monitoring are summarized in Table 1. Two patients with pathologically confirmed hippocampal sclerosis (#2 and #6) had seizure onsets in the medial temporal lobe. Three patients (#3, #4, and #5) with an MRI-visible neocortical lesion (comprising a fibrocalcific nodule, astrocytoma, and dysembryoplastic neuroepithelial tumor) had seizures that originated from the lesional sites. The MRI of patient 6 revealed a focal mass in the lateral temporo-occipital cortex, but seizures from this patient originated in the posterior basal temporal lobe. Patient 1 had no MRI lesion and seizure onset in the right temporal-parietal junction. For each patient, two to three contacts (2.6±0.5; total, 18) were classified as the SOZ. IZs were defined as sites with frequent interictal spikes but without involvement in seizure generation. Electrode contacts categorized as IZ can be either adjacent or distant to the SOZ. For each patient, 7-33 contacts (19.6±10.5; total, 137) were categorized as IZs. Individual IZ sites could be seen in patient-specific HFO EDMs (Figs. 4, 5 and 6). Electrode contacts that were not classified as either the SOZ or IZ were regarded as the CONTROL region. The number of CONTROL region contacts ranged from 29 to 55 (41±10.1; total, 287).
HFO detection and quantification
We adopted a two-stage semi-automated approach for detecting interictal HFOs. The first-stage automated detection algorithm detected a total of 5848 candidate events from 442 channels. These were reviewed with a custom-developed graphic user interface to accept or reject candidate events. In total, 1634 events were selected from the second-stage visual screening process (Table 2). Examples of FR and R events are illustrated in Fig. 1. The time-frequency decomposition plot in Fig. 1 shows that the power increase of HFOs was band-limited to either the FR (Fig. 1A and B) or R (Fig. 1C and D) range. The R events made up about 95% (n=1556) of all detected HFOs, and were found in all seven patients. We identified only a small number of FR events (n=78; 5% of detected HFOs); they were found in five patients. About 43% (670/1556) of R and 65% (51/78) of FR events were associated with interictal spikes or sharp waves.11-13 For these HFOs, "riding-on-the-spike" oscillations were associated with sharp waves, and not the after-coming slow wave (Fig. 1B).
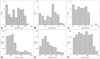
We quantified the peak frequency, peak amplitude, and duration of all of the detected HFO events, as illustrated in Fig. 2. Histograms of FR events for each parameter are shown in Fig. 2A, B and C. The peak frequency of FR events was 280.87±47.62 Hz (median, 283.39 Hz) (Fig. 2A), the peak amplitude was 14.09±4.65 µV (median, 15.34 µV) (Fig. 2B), and the duration was 16.42±4.18 ms (median, 16.09 ms) (Fig. 2C). Histograms of R events for each parameter are shown in Fig. 2D, E and F. The peak frequency of R events was 113.99±27.64 Hz (median, 107.15 Hz) (Fig. 2D), the peak amplitude was 50.34±20.43 µV (median, 45.90 µV) (Fig. 2E), and mean duration was 82.76±29.72 ms (median, 82.84 ms) (Fig. 2F).
HFO distribution in the epileptic brain
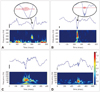
The clinical utility of HFO events was evaluated by calculating the occurrence rate of HFO events in the SOZ, IZ, and CONTROL region, and the findings were subjected to statistical analysis (Fig. 3). KW ANOVA revealed that the distribution of total HFO events (i.e., R+FR) differed significantly between distinct brain regions (KW statistic=143.0; p<0.0001; nSOZ=18, nIZ=137, nCONTROL=287). Post-hoc analysis using the Wilcoxon rank-sum test demonstrated that the occurrence rate of HFO events per 15 minutes was significantly higher in the SOZ (17.71±12.43 events/15 minutes/channel; range: 2-45) than in the IZ (7.57±12.11 events/15 minutes/channel; range: 0-50) and CONTROL region (1.12±3.25 events/15 minutes/channel; range: 0-38; p<0.001 and p<0.0001, respectively, after Bonferroni correction). HFO events were found significantly more frequently in the IZ than in the CONTROL region (p<0.0001 after Bonferroni correction). Please note that the median value of the HFO rate in the CONTROL region was zero; most of the outliers in this group were attributed to patient 1, who had many HFO R events outside the SOZ and IZ.
The same statistical analyses were performed for each category of HFO events (Fig. 3). There were significant differences between groups, as revealed by KW ANOVA (KW statistic=85.7 and 89.3 for FR and R events, respectively; all p<0.0001; nSOZ=18, nIZ=137, nCONTROL=287). The frequency of FR events was significantly higher in the SOZ (3.18±4.94 events/15 minutes/channel; range: 0-15) than in the IZ (0.13±1.05 events/15 minutes/channel; range: 0-11) and CONTROL region (no events found; Fig. 3B; p<0.0001 after Bonferroni correction). No FR events were found in the CONTROL region in any of the patients, but they were recorded in the IZ of one patient (#3); these FR events were recorded from the basal part of the anterior temporal lobe where no seizures were initiated (refer to the discussion for possible explanations). The median value of FR events was zero, with them being found only in a small proportion of the SOZ contacts in five patients. The frequency of R events was significantly higher in the SOZ (14.53±12.99 events/15 minutes/channel; range: 2-45) than in the IZ (7.44±12.05 events/15 minutes/channel, range: 0-50) and CONTROL region (1.11±3.23 events/15 minutes/channel; range: 0-38; Fig. 3C; p<0.001 and p<0.0001, respectively, after Bonferroni correction). Most of the R events recorded in the CONTROL region were attributable to patient 1, with only a small number (less than 5 events/15 minutes/channel) of such events being recording in the other patients. Different from FR events, R events tended to occur frequently in the IZ; nevertheless, R events occurred far more frequently in the SOZ than in the IZ.
HFO EDM
To utilize the detection of interictal HFO events for an individual patient for presurgical mapping, it was necessary to identify the occurrence rate of HFO events at each electrode contact and their location, so that their spatial distribution could be compared with the presumed epileptogenic zone determined by presurgical evaluation. We constructed HFO EDMs to visualize the individual electrode locations identified from fused MRI-CT images and the concentration of HFO events at those electrode contacts. Examples of spatial distribution maps are shown in Figs. 4, 5 and 6. Grid/strip electrodes were overlaid onto a three-dimensional image of the patient's brain, and were color-coded to illustrate the occurrence rate for all and each category of HFO events.
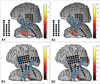
Fig. 4 shows examples from patients 2 and 7, who suffered from mesial temporal lobe (MTL) epilepsy. In patient 2 (Fig. 4A), HFO events were recorded from two strip electrodes located in the left basal and lateral temporal cortex. This patient had histologically confirmed hippocampal sclerosis, which was believed to be the cause of her seizures. A small number of FR events was recorded only in the anterior part of the basal temporal lobe, which is where the first ictal discharges were recorded from (Fig. 4A1). R events were recorded at both the basal and lateral sides, and the occurrence rates were comparable between the two regions (Fig. 4A2). Interestingly, the contralateral hemisphere and other regions rarely generated HFO events.
In patient 7 (Fig. 4B), HFO events were found in the left pa-rahippocampal gyrus, anterior lateral temporal lobe, and posterior portion of the inferior temporal gyrus. This patient exhibited encephalomalacia in the posterior inferior temporal gyrus on MRI. FR events were only recorded at two electrodes in the posterior parahippocampal gyrus, which corresponded to the site of ictal EEG onset in this patient (Fig. 4B1). R events were frequently recorded in the parahippocampal gyrus, but they were also present in the IZ (Fig. 4B2).
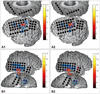
Fig. 5 presents cases of lesional neocortical epilepsy. Patient 5 (Fig. 5A) had epileptogenic DNET in the left middle frontal gyrus; HFO events were recorded from five electrode contacts near this lesion. FR events in particular were localized to one of the SOZ contacts (Fig. 5A1). Most of the R events were recorded around the lesion; other CONTROL regions rarely generated R events (Fig. 5A2).
Patient 3 (Fig. 5B) had an epileptogenic tumor in the right inferior temporal gyrus. FR events were recorded at one of the contacts overlying the lesion, but more were found in the anterior portion of the parahippocampal gyrus (Fig. 5B1). R events were widely distributed, being recorded both in and around the lesion and the anterior temporal lobe (Fig. 5B2).
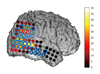
Fig. 6 illustrates the HFO EDM of patient 1, whose case was characterized by no MRI-visible lesions and a wide IZ. Compared to patients 2 and 5, whose HFO events were found only in limited contacts, R events were widespread in the posterior temporal, inferior parietal, and lateral occipital regions in this patient. The HFO occurrence rate in the SOZ was actually lower than for some of the IZ contacts. A large portion of HFO-generating tissue remained after surgery ("R" stands for resected in Figs. 4, 5 and 6).
Discussion
This study evaluated the clinical utility of interictal HFOs by detecting HFO events with a semi-automated approach and comparing their distribution with the clinically determined epileptogenic zone (please see supplementary material for a discussion of the HFO detection methodology). This preliminary investigation of seven patients with medically intractable epilepsy presents three main findings:
1) It is possible to record interictal HFOs-both R and FR events-with large-diameter subdural electrodes on the surface of the neocortex.
2) HFOs were highly concentrated in the SOZ compared to the other brain regions (i.e., the IZ and CONTROL region). Only a small number of FR events was found in five patients, but when present they were strong and specific indicators of the SOZ. R events were also concentrated in the SOZ compared to the IZ and CONTROL region.
3) The patient-specific HFO EDMs that we have described may be especially useful for clinicians for determining the epileptogenic area prior to surgical resection.
Overall, our findings suggest that the interictal HFOs recorded by large-diameter subdural electrodes can be used as surrogate markers of epileptic brain regions both for MTL21 and neocortical epilepsy.
HFOs and spikes for identifying the SOZ
Recording multiple habitual seizures and searching for sites with the earliest ictal electrographic change remains the gold standard presurgical evaluation method of determining the location of the SOZ. Interictal HFOs may be a reliable surrogate marker of epileptogenicity that can provide complementary and possibly additional information about the epileptogenic zone.5-14,17,18 Many of the previous studies have suggested a close association between the SOZ/epileptogenic zone and a high occurrence rate of HFOs (see below). FR events (200-500 Hz), which may reflect field potentials of population spikes from abnormal, synchronously bursting neurons, are generally considered to be pathological forms of HFOs (please see supplementary material for a discussion of the mechanisms underlying HFO).8,22 Recordings with microwires in the human medial temporal lobe have shown that FR events are far more concentrated in the seizure-generating hippocampus and entorhinal cortex than on the contralateral side.9 Other studies using depth electrodes have demonstrated that both R and FR events occur more frequently in the SOZ than in other brain regions.11,12,14 Another study showed that both R and FR events had better sensitivity and specificity in predicting the SOZ than did interictal spikes,13 and that they are indicative of the SOZ irrespective of the lesion type.23 Although the sample was small, the findings of our study are concordant with the claim that interictal HFOs are not markers of specific pathologies (our patients had various lesion types, such as hippocampal sclerosis, cortical tumor, and focal cortical dysplasia), but they are indicative of epileptogenicity. The strongest evidence of interictal HFOs as reliable markers of the epileptic brain lies in the finding that removal of the HFO-generating tissue is correlated with a good surgical outcome.24 Interestingly, there is a weaker correlation between removal of the spike-generating area or the SOZ and a good surgical outcome, emphasizing the importance of interictal HFO mapping during presurgical evaluation. This is consistent with our finding that patients in whom the HFO-generating tissue was mostly resected (i.e., all of our patients except patient 1) had a good surgical outcome (Engel class IA or IB). Only patient 1, who had a much wider extent of HFO-generating tissue than the tissue that was resected, continues to have seizures. However, our finding regarding a possible association between removal of the HFO-generating region and a good surgical outcome is not yet unequivocal, since the follow-up duration of this study was too short (less than 1 year for all seven patients).
Interictal spikes have long been postulated to represent epileptogenicity and have been used widely by clinicians to aid the presurgical definition of the epileptogenic zone.2,25 However, their role in seizure generation remains unclear. Controversy exists as to whether removing the spike-generating tissue affects seizure outcome: some reported that removing the IZ is crucial to a good surgical outcome,26 but others have reported no specific correlation.4 Moreover, the occurrence of spikes increases after a seizure and decreases after medication withdrawal;27 this is contrary to the effect of seizures on HFO frequency, which increases after antiepileptic drug reduction.28 In our study, interictal spikes were always more diffusely distributed than HFOs. Some of the IZs were not removed in three of our patients (#3, #6, and #7); however, these patients have thus far not suffered postoperative seizures, again challenging the role of interictal spikes in seizure generation.
However, some of the spikes are clearly localized to the SOZ, a finding that has led to the hypothesis of "red" and "green" spikes, which postulates that there are pathological and non pathological subsets of interictal spikes.5 However, the distinctiveness of these different spike types remains to be clarified; visual analysis alone cannot differentiate between the two.5 One speculation is that spikes with HFOs represent a subpopulation of "red" spikes.5 It has been suggested that spikes with and without HFOs are different since they can occur independently and may represent different generating mechanisms.13 Spikes often occur widely in the case of neocortical epilepsy, and only some of these regions may contain HFOs, suggesting that the spatial extent of epileptogenic region that should be resected for seizure freedom.29 This idea should be addressed in detail in future studies.
HFOs in the neocortex
HFOs at the onset of neocortical seizures can be recorded by subdural macroelectrodes, mostly at the high-gamma (60-100 Hz) and R-event range.30-35 Khosravani et al.34 recorded multiple seizures with subdural electrodes and showed that ictal HFOs above 100 Hz were localized to channels of ictal onset. Moreover, they demonstrated that HFO power significantly increases for 8 s prior to electrographic onset, arguing that HFOs may be a precursor of seizure generation. Ochi et al.35 presented similar findings that HFOs up to 250 Hz can be localized to the SOZ at ictal onset, and that removal of this HFO-generating tissue was correlated with a good surgical outcome in pediatric patients.
Interictal HFOs recorded by subdural electrodes are reported less frequently than HFOs located near to the region of seizure onset. Worrell et al.10 described high-gamma-range HFOs in neocortical epilepsy patients, but could not detect R and FR events since they used a low sampling rate (200 Hz). There is considerable debate as to whether the epileptic neocortex can generate FR events. In one study, Crépon et al.14 failed to localize FR events (>200 Hz) in the epileptogenic neocortex (without MRI-visible lesions), unlike in the epileptic hippocampus. This finding differs from those of previous studies involving depth electrodes that showed that FR events could be recorded inside an epileptogenic neocortical lesion.12,13,17,23,24 It is possible that only MRI-visible neocortical lesions can generate FR events, while diffuse epileptogenic regions cannot. Alternatively, small-diameter microelectrodes or depth electrodes have better sensitivity for recording neocortical FR events, especially when they are located near to FR-generating tissue.11,36 Our results provide additional insight into the nature of neocortical FR events, since 1) FR events were recorded at subdural macroelectrodes in a subset of patients, and 2) all of the detected FR events, although very small in number, were recorded only in the basal temporal cortex of patients with hippocampal sclerosis, and in MRI-positive neocortical lesions. FR-generating tissue in these patients was found exclusively at the SOZ contacts, except for patient 3 (Fig. 5B), in whom one of the SOZ contacts generated an FR event, but the electrodes on the basal medial temporal lobe generated more, where no seizures originated during the monitoring period. It is unclear why FR events were located outside of the SOZ in this patient, although focal neuronal loss in the hippocampus and surrounding cortex-as revealed by pathology examination-could give rise to FR events. It would be interesting to investigate whether this FR-generating area subsequently becomes the SOZ and contributes to a poor surgical outcome, but this issue could not be addressed in this particular patient since this area was also removed due to frequent interictal spikes. A larger patient database with more diverse types of electrodes is necessary to further investigate the characteristics and clinical significance of neocortical FR events.
The clinical value of R events in epileptogenicity is less clear than for FR events, since both physiological and pathological forms of oscillation can occur in this frequency range. Some studies argue against the clinical value of R events in predicting the SOZ by showing that their frequency was greater in the contralateral hippocampus,9 and others showed that the occurrence rate of R events was more pronounced in the SOZ.11-13,17,23,24 R events were found in all of our patients, comprising 95% of all detected HFOs. The statistically significant findings regarding HFO R events is consistent with the latter view that the occurrence rate of these events was significantly higher in the SOZ than in the other regions, suggesting that most of them reflect a pathological form of HFOs. R-range oscillations can be pathological population spikes of bursting pyramidal neurons, since their bursting frequency can be as "low" as 100 Hz.22,37 Moreover, physiological R events usually occur in the hippocampus and parahippocampal structures during non-REM sleep.16 Since our analysis was confined to interictal epochs recorded while patients were awake, we speculate that most of the detected R events were products of epileptic activity, especially for patients with extrahippocampal seizure onset. However, with current technology it is impossible to differentiate between physiological and pathological R events from iEEG recordings. This poses a challenge in the case of MTL epilepsy, because of the physiological R events originating from the MTL structures.16 Therefore, it may be necessary to distinguish between MTL and neocortical epilepsy. For example, in the former, only FR events should be considered as pathological HFOs;14 this is supported by our findings of FR events in all patients with MTL seizure onset.
The clinical significance of R events in the case of neocortical epilepsy is of great interest, as there is controversy regarding the presence of FR events in the neocortical surface. The R-event occurrence rates measured in the neocortical epilepsy patients in the present study (#1, #3, #4, and #5) support the clinical utility of R events in epilepsy with extra-MTL seizure onset. Furthermore, high-gamma-range HFOs may also play a significant role as a signature of an epileptic neocortex, and thus deserve further investigation.10 The clinical utility of R events and high-gamma HFOs in the case of lesional or nonlesional neocortical epilepsy should be addressed in future studies.
Study limitations and possible improvements
Our study suffered from several limitations. First, the sample of patients was small, which makes it necessary to collect more data to further support the clinical utility of HFOs. Second, we tried to minimize the amount of human labor and subjectivity by adopting a semi-automated detection approach to discriminate HFO events, but still the process was not completely objective. Human bias can be eliminated by developing a fully automated algorithm. The definition of HFOs is still evolving with the increasing number of studies on this subject. Further knowledge and consensus about the morphology/structure of pathological HFOs may help to develop a more powerful HFO-detection algorithm. With a fully automated approach, it will be possible to analyze a much larger database across various behavioral states with minimal selection bias and human labor. Finally, we obtained no data from non-epileptic subjects, since it is impossible to conduct intracranial recording solely for scientific research purposes. Although the clinical importance of interictal HFOs could be strengthened by comparing results from healthy brains, our finding that very few HFO events were detected in brain areas remote from the ictal activity (such as the contralateral hemisphere and any area denoted as CONTROL region) supports the specificity of HFO events in the epileptic brain.
 XML Download